. 2016 Jul 1;594(13):3729-44.
doi: 10.1113/JP271953.

The transcription factor NeuroD2 coordinates synaptic innervation and cell intrinsic properties to control excitability of cortical pyramidal neurons

Affiliations

The transcription factor NeuroD2 coordinates synaptic innervation and cell intrinsic properties to control excitability of cortical pyramidal neurons

Fading Chen et al. J Physiol. .

Abstract

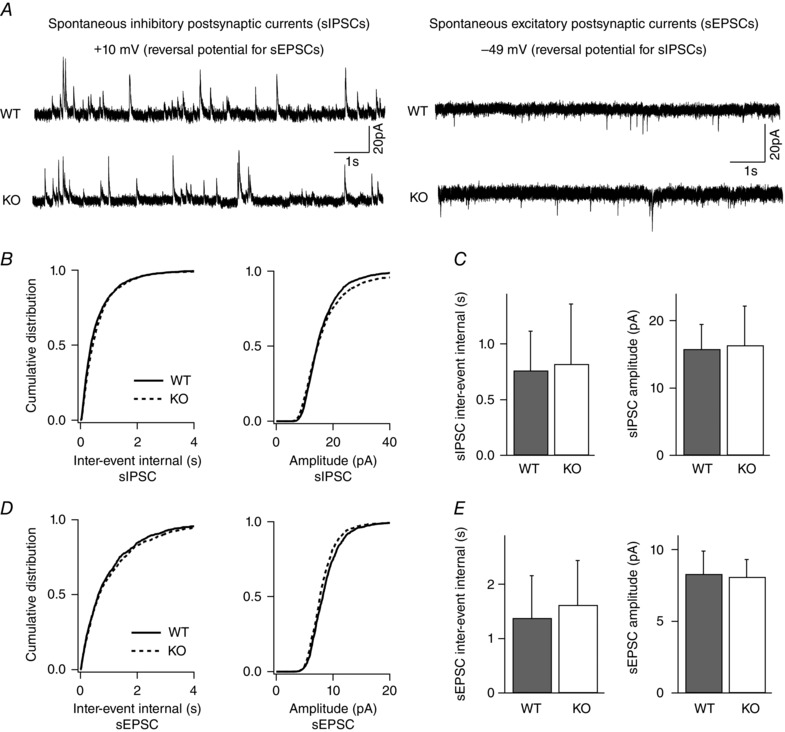
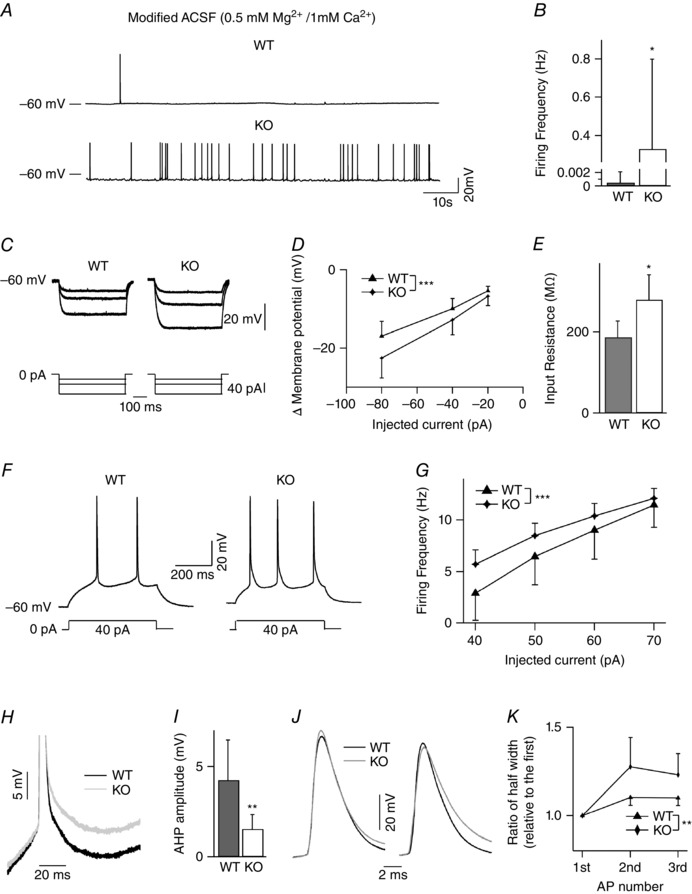
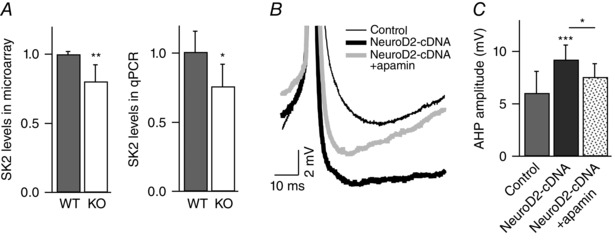
Key points: Synaptic excitation and inhibition must be properly balanced in individual neurons and neuronal networks to allow proper brain function. Disrupting this balance may lead to autism spectral disorders and epilepsy. We show the basic helix-loop-helix transcription factor NeuroD2 promotes inhibitory synaptic drive but also decreases cell-intrinsic neuronal excitability of cortical pyramidal neurons both in vitro and in vivo. We identify two genes potentially downstream of NeuroD2-mediated transcription that regulate these parameters: gastrin-releasing peptide and the small conductance, calcium-activated potassium channel, SK2. Our results reveal an important function for NeuroD2 in balancing synaptic neurotransmission and intrinsic excitability. Our results offer insight into how synaptic innervation and intrinsic excitability are coordinated during cortical development.

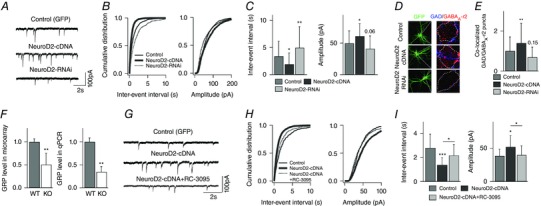
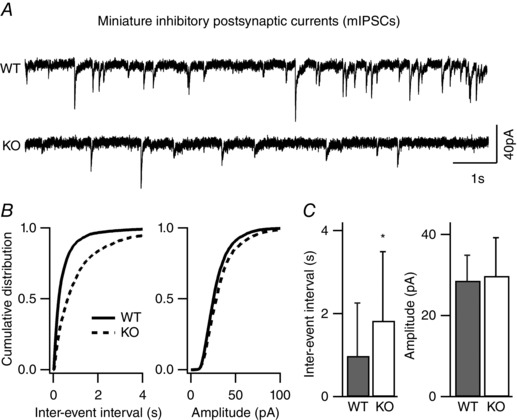
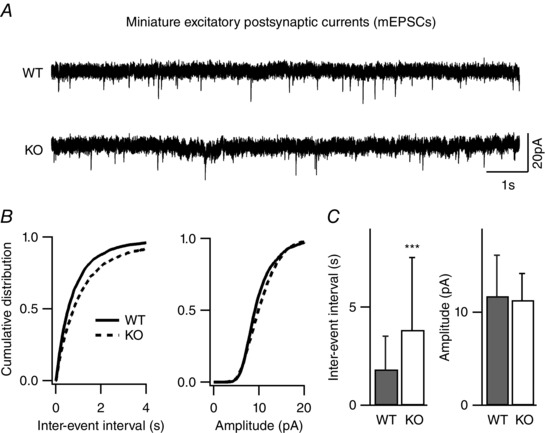
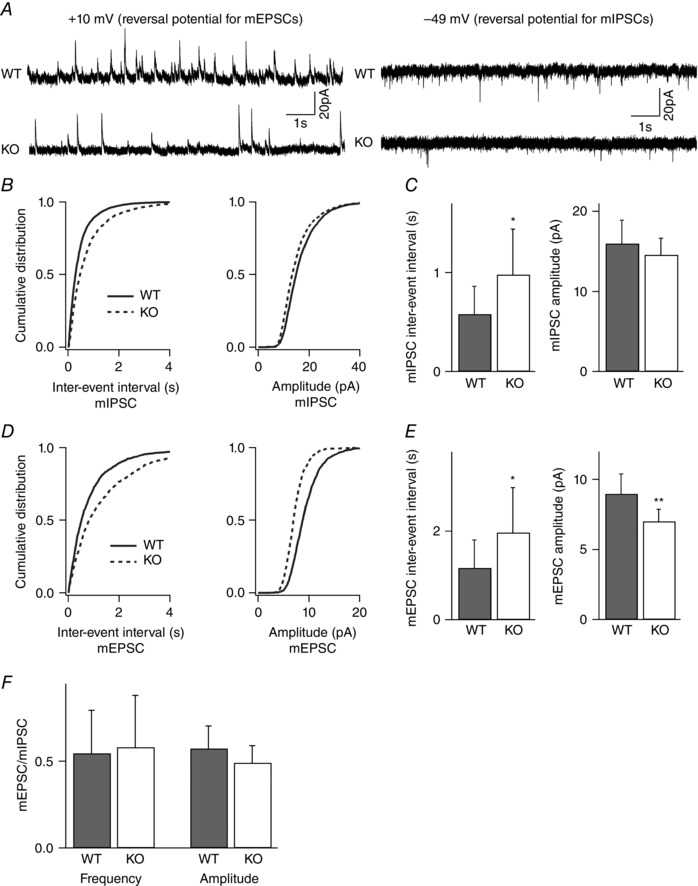
Abstract: Synaptic excitation and inhibition must be properly balanced in individual neurons and neuronal networks for proper brain function. Disruption of this balance during development may lead to autism spectral disorders and epilepsy. Synaptic excitation is counterbalanced by synaptic inhibition but also by attenuation of cell-intrinsic neuronal excitability. To maintain proper excitation levels during development, neurons must sense activity over time and regulate the expression of genes that control these parameters. While this is a critical process, little is known about the transcription factors involved in coordinating gene expression to control excitatory/inhibitory synaptic balance. We show here that the basic helix-loop-helix transcription factor NeuroD2 promotes inhibitory synaptic drive but also decreases cell-intrinsic neuronal excitability of cortical pyramidal neurons both in vitro and in vivo as shown by ex vivo analysis of a NeuroD2 knockout mouse. Using microarray analysis and comparing wild-type and NeuroD2 knockout cortical networks, we identified two potential gene targets of NeuroD2 that contribute to these processes: gastrin-releasing peptide (GRP) and the small conductance, calcium-activated potassium channel, SK2. We found that the GRP receptor antagonist RC-3059 and the SK2 specific blocker apamin partially reversed the effects of increased NeuroD2 expression on inhibitory synaptic drive and action potential repolarization, respectively. Our results reveal an important function for NeuroD2 in balancing synaptic neurotransmission and intrinsic excitability and offer insight into how these processes are coordinated during cortical development.


Figures

Figure 1
Figure 1. NeuroD2 regulates inhibitory synaptic development through GRP‐GRPR signalling in vitro
A, representative mIPSCs recorded from cultured cortical neurons transfected with GFP (control), NeuroD2‐cDNA or NeuroD2‐RNAi plasmid. Scale bar, 100 pA, 2 s. B, cumulative distributions of mIPSC inter‐event intervals and amplitudes from neurons under the same conditions as in A. C, summary of mIPSC inter‐event intervals and amplitudes from neurons under the same conditions as in A (n = 30 for GFP, n = 36 for NeuroD2‐cDNA and n = 26 for NeuroD2‐RNAi. *< 0.05; **< 0.01). D, representative images of immunofluorescent labeling of GAD65 and GABAA‐γ2 in control, NeuroD2‐cDNA or NeuroD2‐RNAi neurons. E, summary of inhibitory synaptic puncta analysis in control, NeuroD2‐cDNA or NeuroD2‐RNAi neurons (n = 36 for GFP, n = 46 for NeuroD2‐cDNA and n = 32 for NeuroD2‐RNAi, **< 0.01). F, GRP mRNA levels measured by microarray (n = 7 for both WT and KO) and by qPCR (n = 3 experiments each in triplicate format for both WT and KO) in 14 DIV cultured cortical neurons (**< 0.01). G, representative mIPSCs recorded from cultured cortical neurons transfected with GFP and NeuroD2‐cDNA in a separate set of experiments. The GRPR antagonist RC‐3095 was added into the growth medium after transfection (scale bar, 100 pA, 2 s). H, cumulative distributions of mIPSC inter‐event intervals and amplitudes recorded from neurons transfected with GFP, NeuroD2‐cDNA or NeuroD2‐cDNA+RC‐3095. I, summary of mIPSC inter‐event intervals and amplitudes recorded from neurons transfected with GFP, NeuroD2‐cDNA or NeuroD2‐cDNA+RC‐3095 (n = 8 for GFP, n = 14 for NeuroD2‐cDNA and n = 11 for NeuroD2‐cDNA+RC‐3095; *< 0.05, ***< 0.001).
Figure 2
Figure 2. Reduced frequency of inhibitory quantal transmission in layer II/III pyramidal neurons of NeuroD2 null mice
mIPSCs recorded from layer II/III pyramidal neurons in the presence of TTX, APV, and DNQX. A, sample traces from WT and mutant neurons voltage clamped at −70 mV (scale bar, 40 pA, 1 s). B, cumulative distributions of inter‐event interval (IEI) and amplitude from all mIPSCs events of 24 WT neurons and 32 mutant neurons showed a significant rightward shift in the mIPSC frequency for mutant neurons. C, average data of mIPSC inter‐event intervals and amplitudes showed a significant decrease in mIPSC frequency (increased IEI) in KO neurons (n = 24 for WT and n = 32 for KO; *< 0.05).
Figure 3
Figure 3. Reduced frequency of excitatory quantal transmission in layer II/III pyramidal neurons of NeuroD2 null mice
mEPSCs recorded from layer II/III pyramidal neurons in the presence of TTX, and picrotoxin. A, sample traces from WT and mutant neurons voltage clamped at −65 mV (scale bar, 20 pA, 1 s). B, cumulative distributions of inter‐event interval and amplitude from all mEPSCs events of 28 WT neurons and 32 mutant neurons showed a significant rightward shift in the mEPSC frequency for mutant neurons. C, average data of mEPSC inter‐event intervals and amplitudes showed a significant decrease in mEPSC frequency (increased IEI) in KO neurons (n = 28 for WT and n = 32 for KO; ***< 0.001).
Figure 4
Figure 4. Frequency of both inhibitory and excitatory quantal events is reduced in layer II/III pyramidal neurons of NeuroD2 null mice
mIPSCs and mEPSCs recorded from the same layer II/III pyramidal neurons in the presence of TTX. A, sample traces from WT and mutant neurons voltage clamped at +10 mV for mIPSCs and −49 mV for mEPSCs (scale bar, 20 pA, 1 s). B, cumulative distributions of inter‐event interval and amplitude from all mIPSCs events of 11 WT neurons and 13 mutant neurons showed a significant rightward shift in the mIPSC frequency for mutant neurons. C, average data of mIPSC inter‐event intervals and amplitudes showed a significant decrease in mIPSC frequency (increased IEI) in KO neurons (n = 11 for WT and n = 13 for KO; *< 0.05). D, cumulative distributions of inter‐event interval and amplitude from all mEPSCs events of 11 WT neurons and 13 mutant neurons showed a significant rightward shift in the mEPSC frequency and a leftward shift in the mEPSC amplitude for mutant neurons. E, average data of mEPSC inter‐event intervals and amplitudes showed a significant decrease in mEPSC frequency (increased IEI) and amplitude in KO neurons (n = 11 for WT and n = 13 for KO; *< 0.05, **< 0.01). F, the ratio of mEPSC to mIPSC IEI and amplitude was unchanged in NeuroD2 mutant neurons compared to WT.
Figure 5
Figure 5. Spontaneous inhibitory and excitatory synaptic neurotransmission in layer II/III pyramidal neurons is unchanged in the absence of NeuroD2
sIPSCs and sEPSCs recorded from single layer II/III pyramidal neurons. A, sample traces from a WT and KO neuron voltage clamped at +10 mV for sIPSCs and −49 mV for sEPSCs (scale bar, 20 pA, 1 s). B, cumulative distributions of inter‐event intervals and amplitudes of all sIPSCs events for 14 WT neurons and 13 KO neurons revealed no difference between WT and mutant neurons. C, average data of sIPSC inter‐event intervals and amplitudes in WT and mutant neurons (n = 14 cells for WT and n = 13 cells for KO; P = 0.82 and P = 0.87 for sIPSC frequency and amplitude, respectively). D, cumulative distributions of inter‐event intervals and amplitudes from all sEPSC events of 14 WT neurons and 13 mutant neurons showed no difference between WT and mutant neurons. E, average data of sEPSC inter‐event intervals and amplitudes in WT and mutant neurons (n = 14 cells for WT and n = 13 cells for KO; P = 0.37 and 0.64 for sEPSC frequency and amplitude, respectively).
Figure 6
Figure 6. Increased intrinsic excitability and higher spontaneous AP rates in layer II/III pyramidal neurons of NeuroD2 null neurons
A, representative spontaneous AP firing for WT and NeuroD2 null cells. B, average spontaneous firing rate was significantly higher in NeuroD2 KO neurons than WT neurons (n = 10 for WT and n = 12 for KO; *< 0.05). C, superimposed voltage traces depicting the response to 500 ms hyperpolarizing step currents in one WT and KO neurons. D, current–voltage (I–V) curves of the steady‐state voltage in relation to injected currents (n = 6 for both WT and KO; ***< 0.001). E, input resistance of mutant neurons was significantly higher than WT neurons (*< 0.05). F, example current‐clamp recordings in response to 40 pA depolarizing current steps for WT and KO layer II/III cortical neurons. G, average firing frequency as a function of the current injected showing an increase in NeuroD2 KO neurons (n = 6 for both WT and KO; ***< 0.001). H, representative traces of AHP after the first AP (in 8 Hz AP trains) in NeuroD2 WT and KO neurons. I, average data showed decreased AHP after the first AP in NeuroD2 KO neurons compared to WT neurons (**< 0.01). J, representative traces of the first and third APs (in 8 Hz AP trains) from NeuroD2 WT and KO trains shown at expanded time base. K, the ratio of the half‐widths of the second and the third APs relative to the first AP is significantly greater in the KOs (**< 0.01).
Figure 7
Figure 7. NeuroD2 regulates AHP through SK2
A, SK2 mRNA levels are decreased in NeuroD2 KO tissue as measured by microarray (n = 7 for both WT and KO) and qPCR (n = 5 experiments with each in triplicate for both WT and KO). Data are from 14 DIV cultured cortical neurons (*< 0.05; **< 0.01). B, representative traces of AHP after the first AP (in 8 Hz AP trains) in control, NeuroD2‐cDNA, and NeuroD2‐cDNA + apamin. C, summary of AHP measurements after the first AP in control, NeuroD2‐cDNA and NeuroD2‐cDNA + apamin (*< 0.05, ***< 0.001).

References

    1. Adelman JP, Maylie J & Sah P (2012). Channels: Form and function. Annu Rev Physiol 74, 245–269. - PubMed
    1. Bayam E, Sahin GS, Guzelsoy G, Guner G, Kabakcioglu A & Ince‐Dunn G (2015). Genome‐wide target analysis of NEUROD2 provides new insights into regulation of cortical projection neuron migration and differentiation. BMC Genomics 16, 681 - PMC - PubMed
    1. Bédard T, Mountney C, Kent P, Anisman H & Merali Z (2007). Role of gastrin‐releasing peptide and neuromedin B in anxiety and fear‐related behaviour. Behav Brain Res 179, 133–140. - PubMed
    1. Cao X, Mercaldo V, Li P, Wu L‐J & Zhuo M (2010). Facilitation of the inhibitory transmission by gastrin‐releasing peptide in the anterior cingulate cortex. Mol Pain 6, 52. - PMC - PubMed
    1. Eichler SA & Meier JC (2008). E‐I balance and human diseases – from molecules to networking. Front Mol Neurosci 1, 2. - PMC - PubMed

Publication types

MeSH terms

Substances

LinkOut - more resources