Review
. 2016 Aug 31:17:353-73.
doi: 10.1146/annurev-genom-090314-024956. Epub 2016 May 4.

Phenome-Wide Association Studies as a Tool to Advance Precision Medicine

Affiliations
Review

Phenome-Wide Association Studies as a Tool to Advance Precision Medicine

Joshua C Denny et al. Annu Rev Genomics Hum Genet. .

Abstract

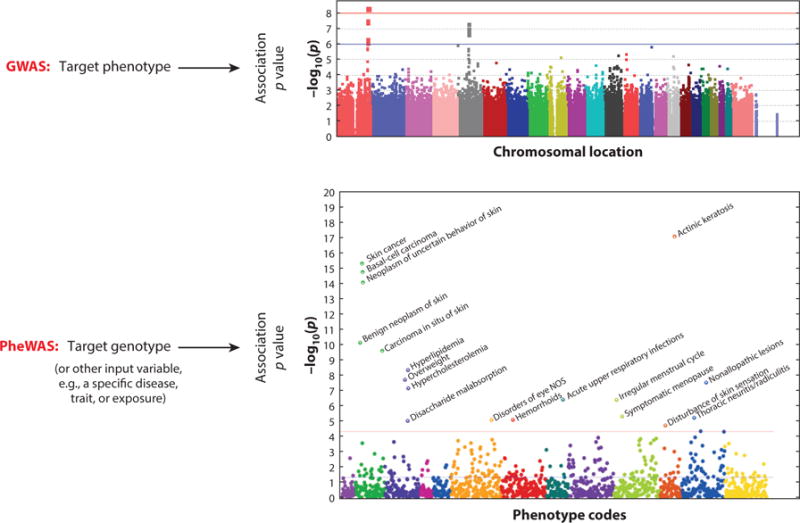
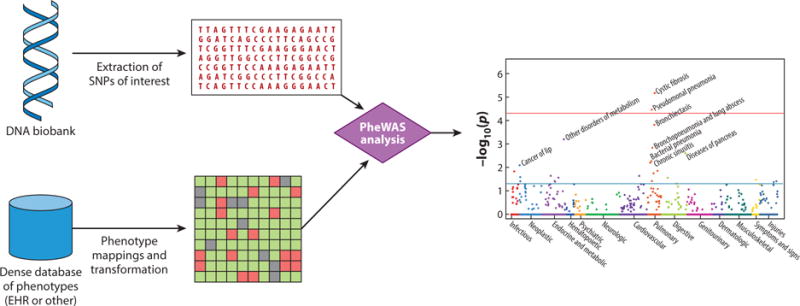
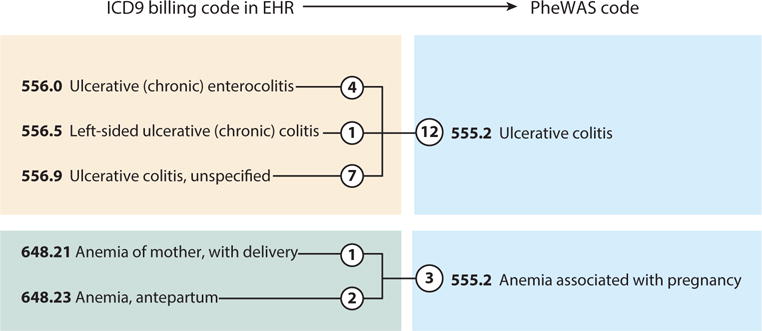
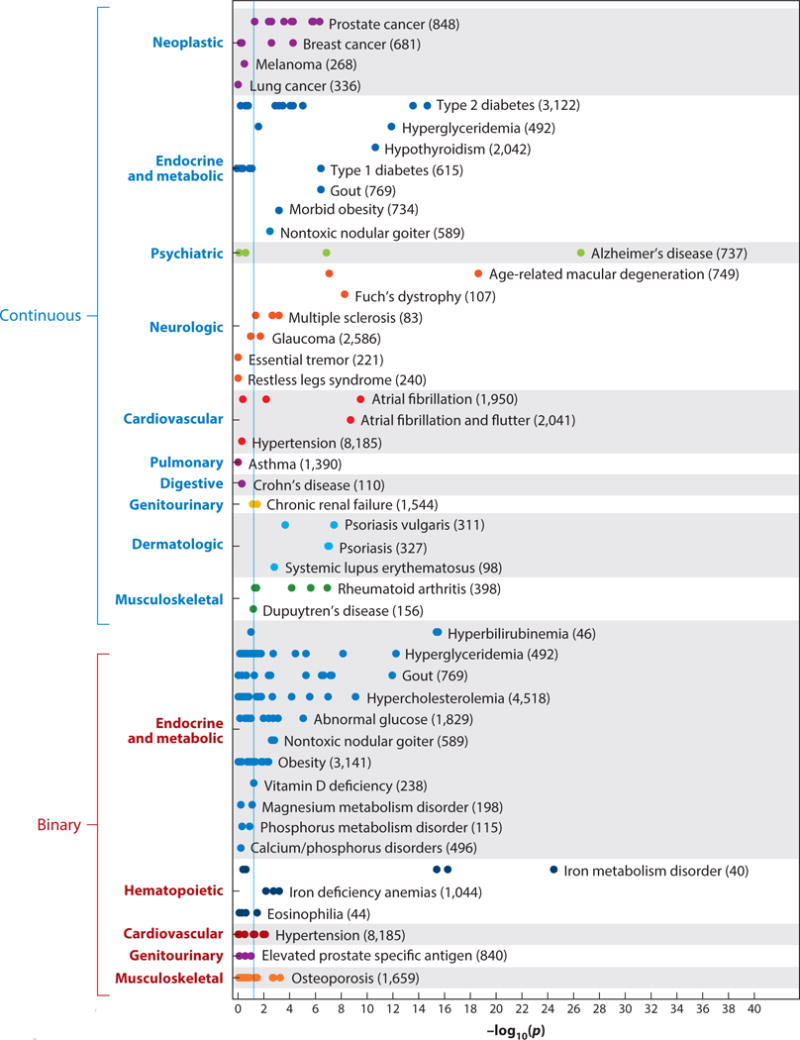
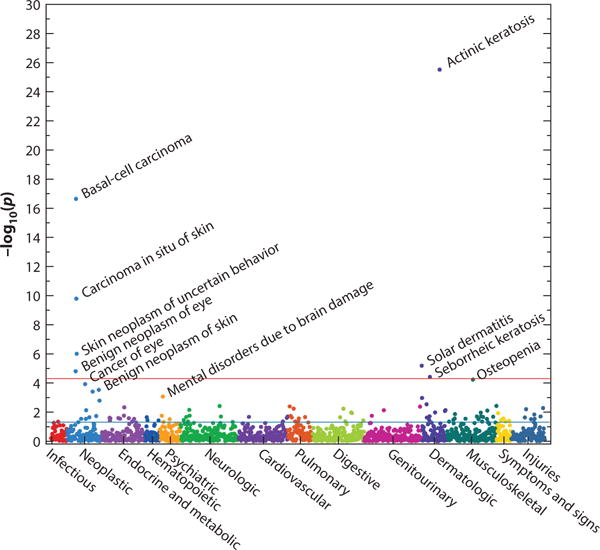
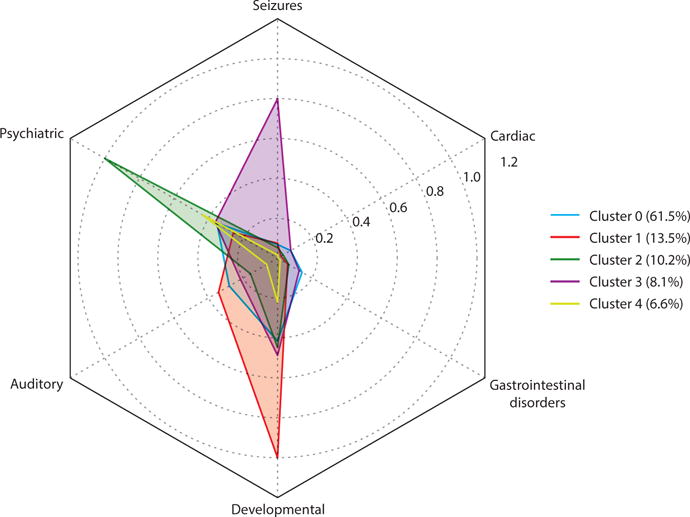
Beginning in the early 2000s, the accumulation of biospecimens linked to electronic health records (EHRs) made possible genome-phenome studies (i.e., comparative analyses of genetic variants and phenotypes) using only data collected as a by-product of typical health care. In addition to disease and trait genetics, EHRs proved a valuable resource for analyzing pharmacogenetic traits and developing reverse genetics approaches such as phenome-wide association studies (PheWASs). PheWASs are designed to survey which of many phenotypes may be associated with a given genetic variant. PheWAS methods have been validated through replication of hundreds of known genotype-phenotype associations, and their use has differentiated between true pleiotropy and clinical comorbidity, added context to genetic discoveries, and helped define disease subtypes, and may also help repurpose medications. PheWAS methods have also proven to be useful with research-collected data. Future efforts that integrate broad, robust collection of phenotype data (e.g., EHR data) with purpose-collected research data in combination with a greater understanding of EHR data will create a rich resource for increasingly more efficient and detailed genome-phenome analysis to usher in new discoveries in precision medicine.

Keywords: electronic health record; genome-wide association study; phenome-wide association study; phenotyping.


Figures

Figure 1
Figure 1
Genome-wide association studies (GWASs) versus phenome-wide association studies (PheWASs). Whereas GWASs usually study a single target phenotype across many genotypes (usually more than 500,000), PheWASs start with a single target genotype (or other independent variable) and analyze many phenotypes (usually more than 1,000). Adapted with permission from Reference with permission from Nature Biotechnology.
Figure 2
Figure 2
Phenome-wide association studies (PheWASs). A PheWAS begins with identification of a genetic variant of interest, such as a single-nucleotide polymorphism (SNP). For a PheWAS using electronic health records (EHRs), phenotypes are then extracted, and transformations are often made to map raw EHR data to defined cases and controls for analysis. A typical transformation would take ~14,000 diagnostic billing codes and identify ~1,600 distinct case phenotypes, each matched to a control group. A PheWAS analysis is then performed to test for associations between the SNP and each phenotype, using typical statistical genetics methods.
Figure 3
Figure 3
Phecode mappings of codes from the ninth edition of the International Classification of Diseases (ICD9). In this example, the individual has five unique ICD9 codes that map to two phenome-wide association study (PheWAS) phecodes. The circled numbers indicate the number of occurrences of each code in the individual’s electronic health record (EHR). Typically, a code must be billed two or three times in order to be considered a case for the phecode.
Figure 4
Figure 4
Replication of known single-nucleotide polymorphism (SNP)–phenotype associations by a phenome-wide association study (PheWAS). Each point represents a distinct SNP tested for the phenotype indicated. The numbers in parentheses represent the sample size within the PheWAS data set. The vertical blue line represents p = 0.05. Adapted from Reference with permission from Nature Biotechnology.
Figure 5
Figure 5
A phenotype-wide association study (PheWAS) plot of rs12203592 in IRF4. The horizontal red line indicates a Bonferroni correction for the number of phenotypes tested in this PheWAS (p = 0.05/1,358 = 3.7 × 10⁻⁵); the horizontal blue line indicates p = 0.05. The analysis shows that this single-nucleotide polymorphism is associated with several phenotypes related to sun exposure, such as actinic keratosis, basal cell carcinomas, osteopenia, and solar dermatitis (sunburns); these were new discoveries in this PheWAS. Figure drawn using data derived from Reference with permission from Nature Biotechnology.
Figure 6
Figure 6
Clustering of autism spectrum disorders (ASDs) based on phenome-wide association study (PheWAS) comorbidities in a Vanderbilt study. This study used the approach applied in Reference to identify different subpopulations of ASD patients by their comorbidities. Unsupervised hierarchical clustering was performed on all individuals identified as having an ASD. The five identified clusters are represented by the types of codes found in each cluster. For example, cluster 2 identifies 10.2% of patients with an ASD, and nearly all of these individuals had a psychiatric phecode. In cluster 3, 80% of the individuals had a seizure phecode.

References

    1. Boland MR, Hripcsak G, Albers DJ, Wei Y, Wilcox AB, et al. Discovering medical conditions associated with periodontitis using linked electronic health records. J Clin Periodontol. 2013;40:474–82. - PMC - PubMed
    1. Bowton E, Field JR, Wang S, Schildcrout JS, Van Driest SL, et al. Biobanks and electronic medical records: enabling cost-effective research. Sci Transl Med. 2014;6:234cm3. - PMC - PubMed
    1. Cannon CP, Blazing MA, Giugliano RP, McCagg A, White JA, et al. Ezetimibe added to statin therapy after acute coronary syndromes. N Engl J Med. 2015;372:2387–97. - PubMed
    1. Carroll RJ, Bastarache L, Denny JC. R PheWAS: data analysis and plotting tools for phenome-wide association studies in the R environment. Bioinformatics. 2014;30:2375–76. - PMC - PubMed
    1. Chapman WW, Bridewell W, Hanbury P, Cooper GF, Buchanan BG. A simple algorithm for identifying negated findings and diseases in discharge summaries. J Biomed Inform. 2001;34:301–10. - PubMed

Publication types

MeSH terms