

Functional characterization of a panel of high-grade serous ovarian cancer cell lines as representative experimental models of the disease
- PMID: 27147568
- PMCID: PMC5078053
- DOI: 10.18632/oncotarget.9053
Functional characterization of a panel of high-grade serous ovarian cancer cell lines as representative experimental models of the disease
Abstract
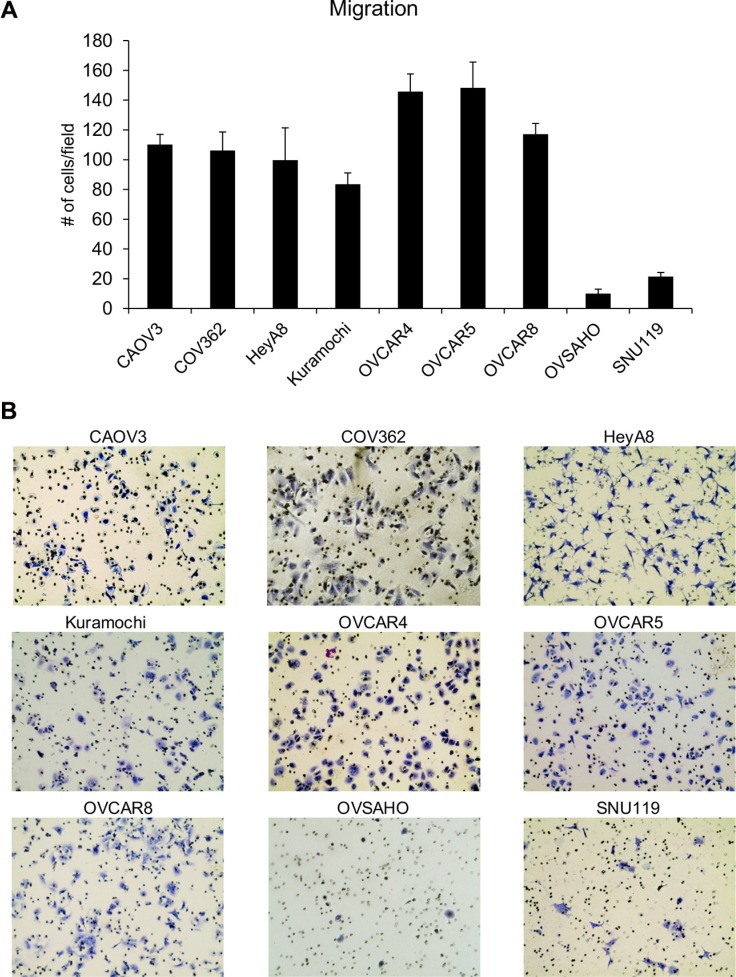
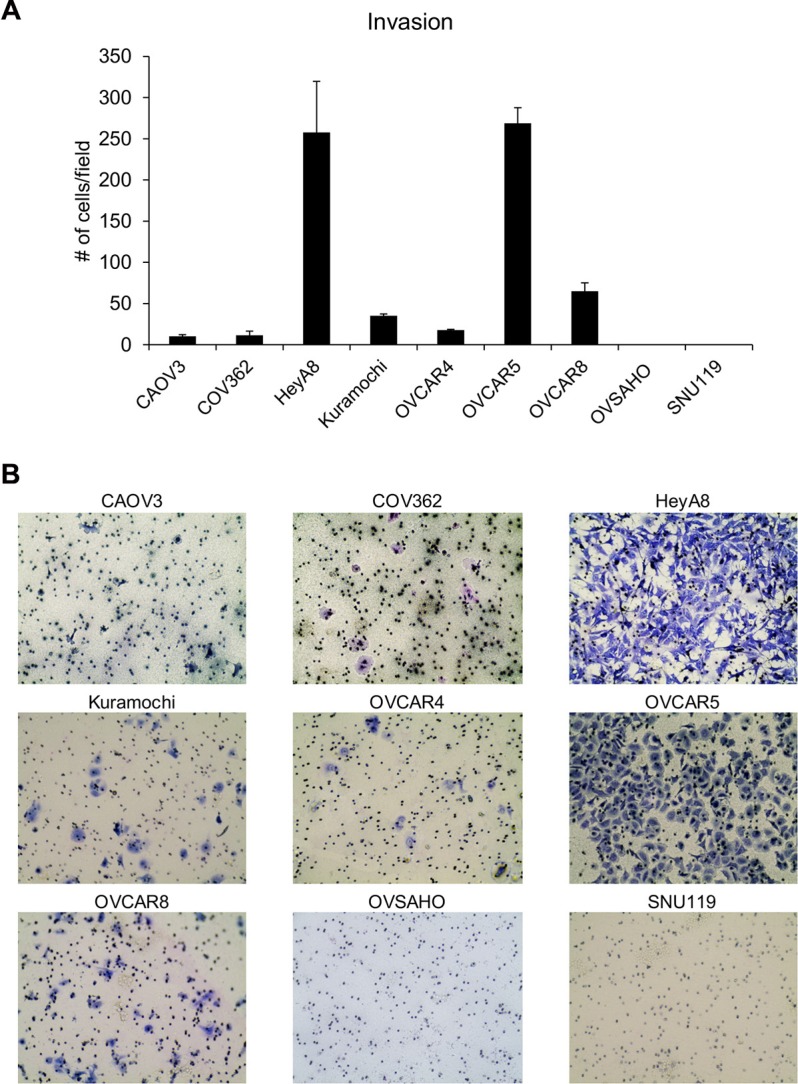
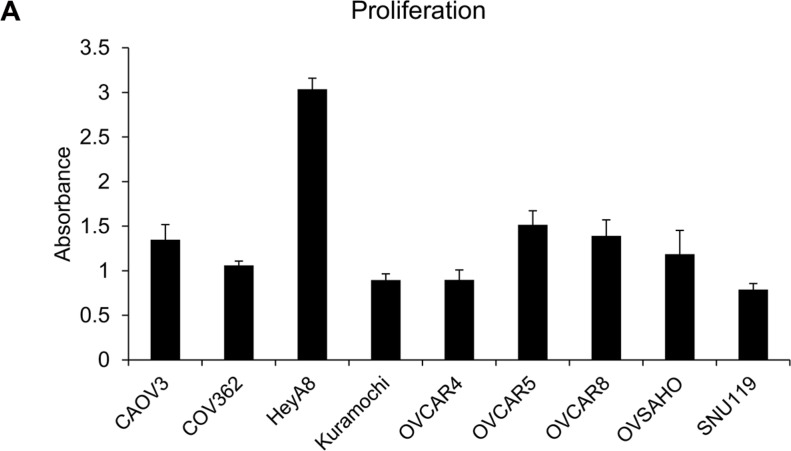
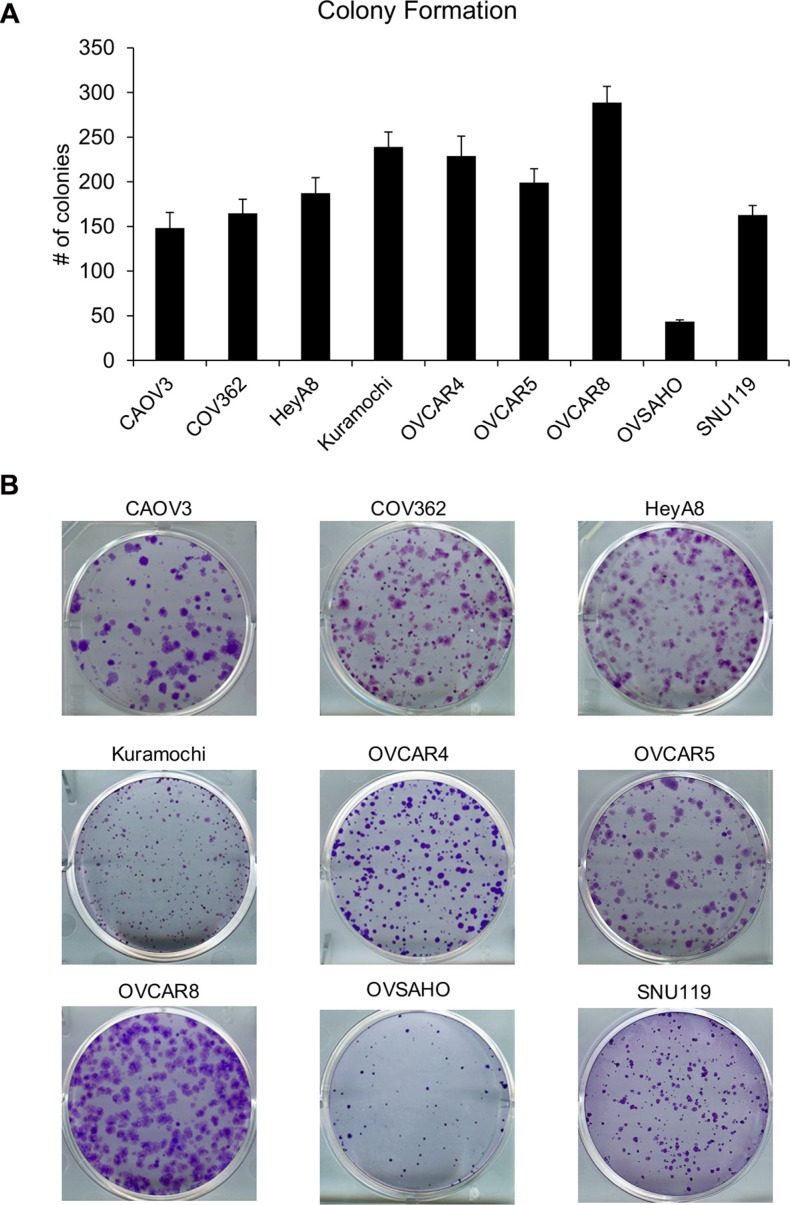
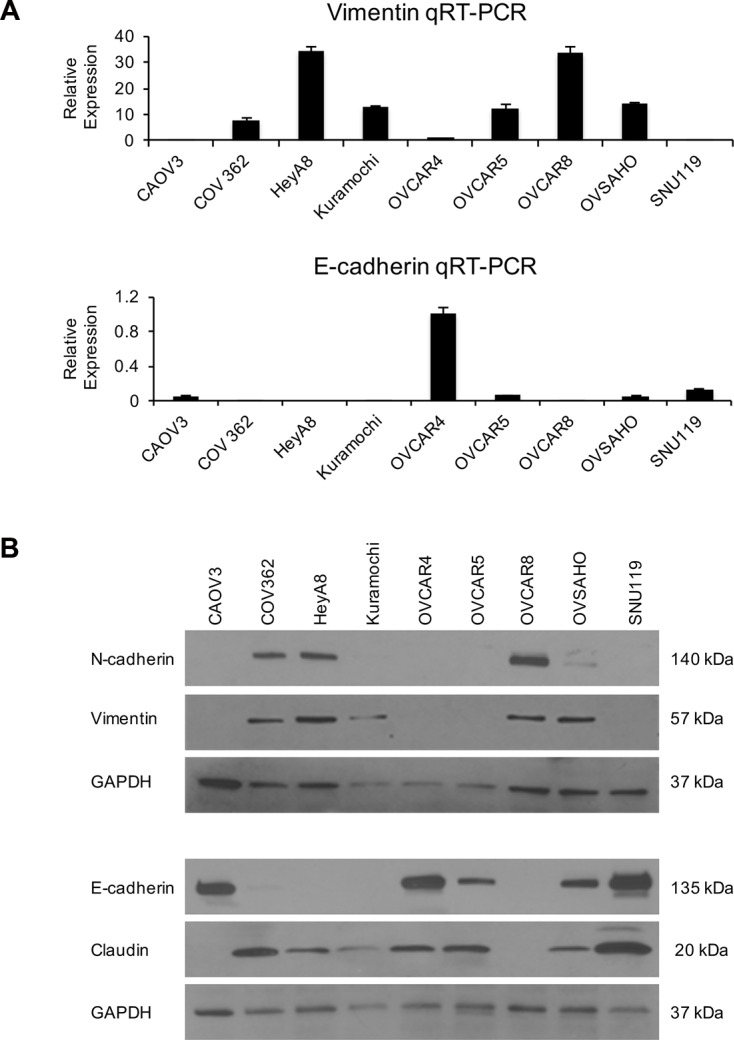
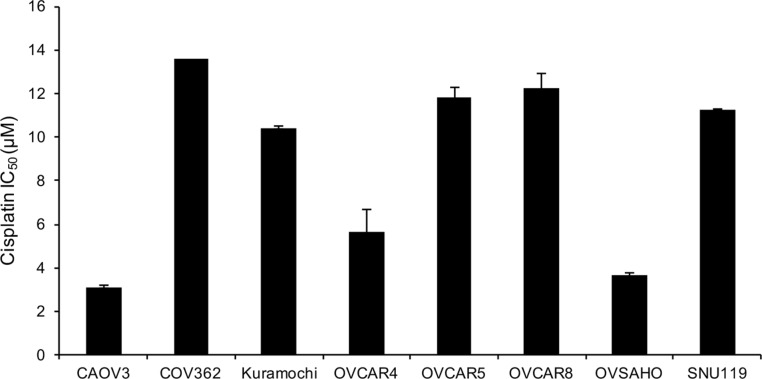
Genomic analysis of ovarian cancer cell lines has revealed a panel that best represents the most common ovarian cancer subtype, high-grade serous ovarian cancer (HGSOC). However, these HGSOC-like cell lines have not been extensively applied by ovarian cancer researchers to date, and the most commonly used cell lines in the ovarian cancer field do not genetically resemble the major clinical type of the disease. For the HGSOC-like lines to serve as suitable models, they need to be characterized for common functional assays. To achieve that objective, we systematically studied a panel of HGSOC cells CAOV3, COV362, Kuramochi, OVCAR4, OVCAR5, OVCAR8, OVSAHO and SNU119 for migration, invasion, proliferation, clonogenicity, EMT phenotype and cisplatin resistance. They exhibited a range of efficacies and OVCAR5, OVCAR8 and Kuramochi were the most aggressive. SNU119 and OVSAHO cells demonstrated the lowest functional activities. Wide differences in expression of EMT markers were observed between cell lines. SNU119 were the most epithelial and OVCAR8 had the most mesenchymal phenotype. COV362 was the most resistant to cisplatin while CAOV3 was the most sensitive. Taken together, our systematic characterization represents a valuable resource to help guide the application of HGSOC cells by the cancer research community.
Keywords: clonogenicity; invasion; migration; ovarian cancer; proliferation.
Conflict of interest statement
The authors declare no potential conflicts of interest.
Figures
Similar articles
-
In vivo tumor growth of high-grade serous ovarian cancer cell lines.Gynecol Oncol. 2015 Aug;138(2):372-7. doi: 10.1016/j.ygyno.2015.05.040. Epub 2015 Jun 5. Gynecol Oncol. 2015. PMID: 26050922 Free PMC article.
-
GATA3 as a master regulator for interactions of tumor-associated macrophages with high-grade serous ovarian carcinoma.Cell Signal. 2020 Apr;68:109539. doi: 10.1016/j.cellsig.2020.109539. Epub 2020 Jan 11. Cell Signal. 2020. PMID: 31935430
-
Patient-derived ovarian cancer xenografts re-growing after a cisplatinum treatment are less responsive to a second drug re-challenge: a new experimental setting to study response to therapy.Oncotarget. 2017 Jan 31;8(5):7441-7451. doi: 10.18632/oncotarget.7465. Oncotarget. 2017. PMID: 26910918 Free PMC article.
-
Studying platinum sensitivity and resistance in high-grade serous ovarian cancer: Different models for different questions.Drug Resist Updat. 2016 Jan;24:55-69. doi: 10.1016/j.drup.2015.11.005. Epub 2015 Nov 26. Drug Resist Updat. 2016. PMID: 26830315 Review.
-
The high-grade serous ovarian cancer metastasis and chemoresistance in 3D models.Biochim Biophys Acta Rev Cancer. 2024 Jan;1879(1):189052. doi: 10.1016/j.bbcan.2023.189052. Epub 2023 Dec 12. Biochim Biophys Acta Rev Cancer. 2024. PMID: 38097143 Review.
Cited by
-
Preclinical Evaluation of Artesunate as an Antineoplastic Agent in Ovarian Cancer Treatment.Diagnostics (Basel). 2021 Feb 26;11(3):395. doi: 10.3390/diagnostics11030395. Diagnostics (Basel). 2021. PMID: 33652561 Free PMC article.
-
Epithelial/mesenchymal heterogeneity of high-grade serous ovarian carcinoma samples correlates with miRNA let-7 levels and predicts tumor growth and metastasis.Mol Oncol. 2020 Nov;14(11):2796-2813. doi: 10.1002/1878-0261.12762. Epub 2020 Aug 21. Mol Oncol. 2020. PMID: 32652647 Free PMC article.
-
Model Cell Lines and Tissues of Different HGSOC Subtypes Differ in Local Estrogen Biosynthesis.Cancers (Basel). 2022 May 24;14(11):2583. doi: 10.3390/cancers14112583. Cancers (Basel). 2022. PMID: 35681563 Free PMC article.
-
Snail knockdown reverses stemness and inhibits tumour growth in ovarian cancer.Sci Rep. 2018 Jun 7;8(1):8704. doi: 10.1038/s41598-018-27021-z. Sci Rep. 2018. PMID: 29880891 Free PMC article.
-
Genome-wide analysis of copy number alterations led to the characterisation of PDCD10 as oncogene in ovarian cancer.Transl Oncol. 2021 Mar;14(3):101013. doi: 10.1016/j.tranon.2021.101013. Epub 2021 Jan 27. Transl Oncol. 2021. PMID: 33516089 Free PMC article.
References
-
- Siegel RL, Miller KD, Jemal A. Cancer statistics, 2015. CA Cancer J Clin. 2015;65:5–29. - PubMed
Publication types
MeSH terms
Substances
Grants and funding
LinkOut - more resources
Full Text Sources
Other Literature Sources
Medical
