. 2016 May 4;36(18):5034-46.
doi: 10.1523/JNEUROSCI.0213-16.2016.

Glutamatergic Preoptic Area Neurons That Express Leptin Receptors Drive Temperature-Dependent Body Weight Homeostasis

Affiliations

Glutamatergic Preoptic Area Neurons That Express Leptin Receptors Drive Temperature-Dependent Body Weight Homeostasis

Sangho Yu et al. J Neurosci. .

Abstract

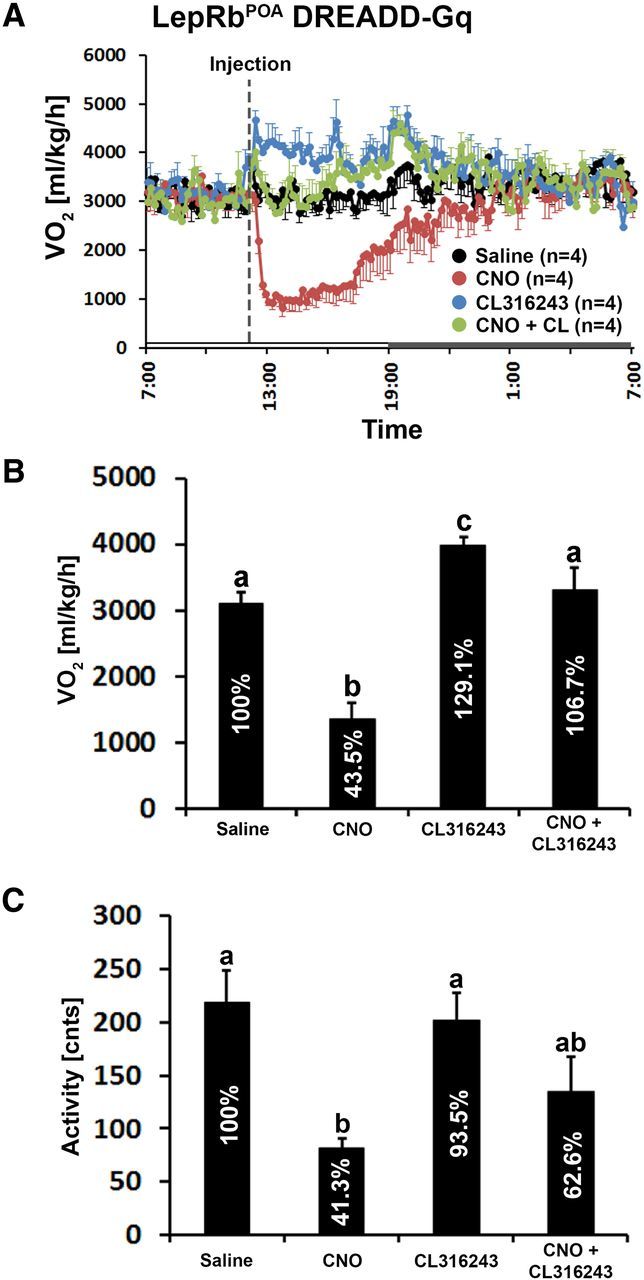
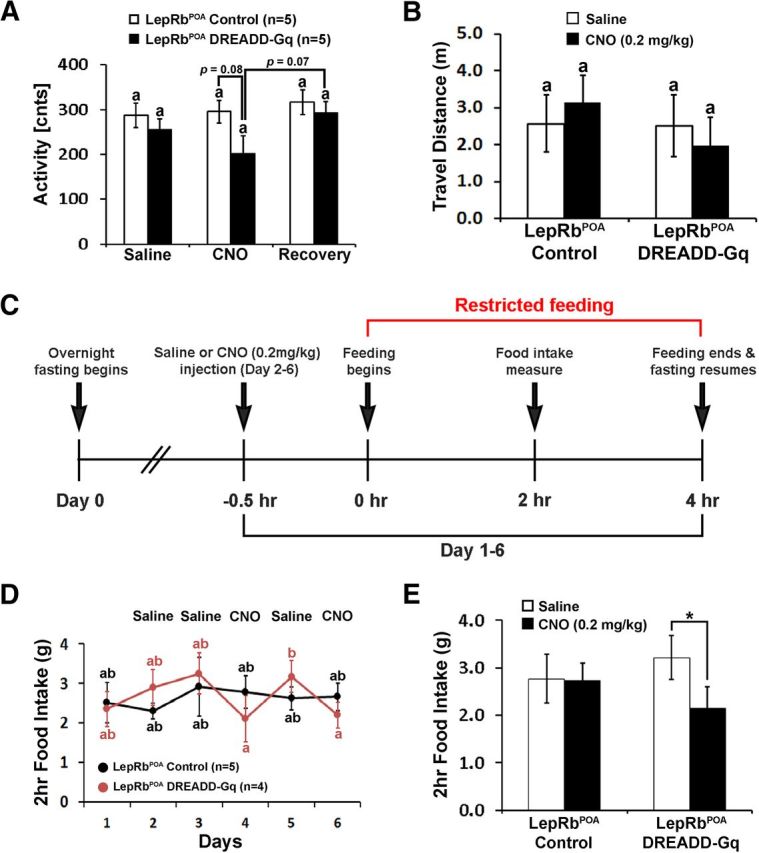
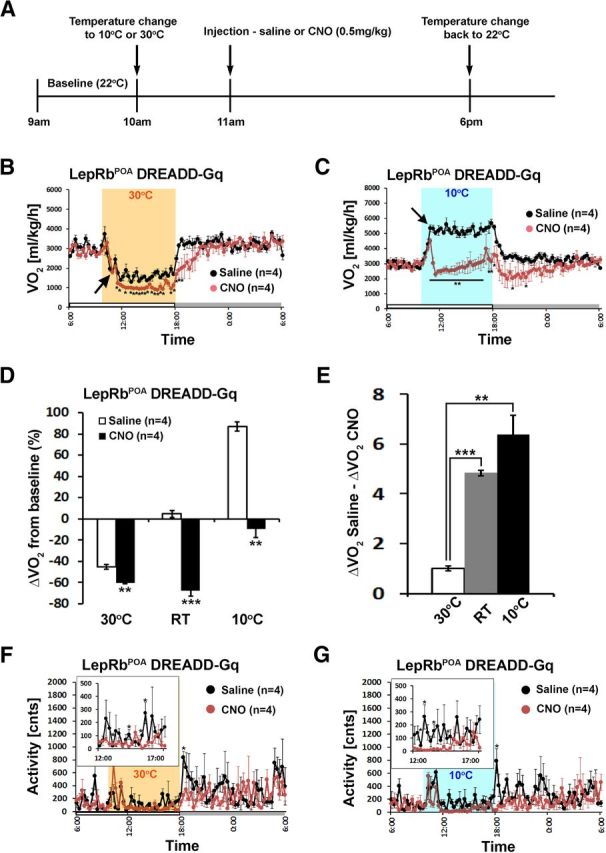
The preoptic area (POA) regulates body temperature, but is not considered a site for body weight control. A subpopulation of POA neurons express leptin receptors (LepRb(POA) neurons) and modulate reproductive function. However, LepRb(POA) neurons project to sympathetic premotor neurons that control brown adipose tissue (BAT) thermogenesis, suggesting an additional role in energy homeostasis and body weight regulation. We determined the role of LepRb(POA) neurons in energy homeostasis using cre-dependent viral vectors to selectively activate these neurons and analyzed functional outcomes in mice. We show that LepRb(POA) neurons mediate homeostatic adaptations to ambient temperature changes, and their pharmacogenetic activation drives robust suppression of energy expenditure and food intake, which lowers body temperature and body weight. Surprisingly, our data show that hypothermia-inducing LepRb(POA) neurons are glutamatergic, while GABAergic POA neurons, originally thought to mediate warm-induced inhibition of sympathetic premotor neurons, have no effect on energy expenditure. Our data suggest a new view into the neurochemical and functional properties of BAT-related POA circuits and highlight their additional role in modulating food intake and body weight.

Significance statement: Brown adipose tissue (BAT)-induced thermogenesis is a promising therapeutic target to treat obesity and metabolic diseases. The preoptic area (POA) controls body temperature by modulating BAT activity, but its role in body weight homeostasis has not been addressed. LepRb(POA) neurons are BAT-related neurons and we show that they are sufficient to inhibit energy expenditure. We further show that LepRb(POA) neurons modulate food intake and body weight, which is mediated by temperature-dependent homeostatic responses. We further found that LepRb(POA) neurons are stimulatory glutamatergic neurons, contrary to prevalent models, providing a new view on thermoregulatory neural circuits. In summary, our study significantly expands our current understanding of central circuits and mechanisms that modulate energy homeostasis.

Keywords: DREADD; body temperature; body weight; energy expenditure; food intake; thermoregulation.


Figures

Figure 1.
Figure 1.
LepRbPOA neurons decrease core temperature and energy expenditure. A, Distribution of LepRb-expressing neurons in the POA of LepRbEGFP reporter mice. Right panels show corresponding regions in the mouse brain atlas (Paxinos and Franklin, 2004). 3V, Third ventricle; MPA, medial preoptic area; LPO, lateral preoptic area; VOLT, vascular organ of the lamina terminalis; AVPe, anteroventral periventricular nucleus; VMPO, ventromedial preoptic nucleus; VLPO, ventrolateral preoptic nucleus; MnPO, median preoptic nucleus; ac, anterior commissure. B, Representative images showing virus-infected neurons (mCherry, red) and cFos (green) in the POA in LepRbPOA control and LepRbPOA DREADD-Gq mice. CNO (0.5 mg/kg, i.p.) was injected 2–3 h before perfusion. Insets show magnified images of the indicated areas (dotted line boxes). C, Rectal temperature of LepRbPOA control (n = 7) and LepRbPOA DREADD-Gq (n = 9) mice after CNO injection (1.5 mg/kg, i.p.) at RT. D, VO2 measurement in LepRbPOA DREADD-Gq mice (n = 4) during saline (black) or CNO (0.5 mg/kg, i.p.; red) injections at RT. E, Locomotor activity in the same LepRbPOA DREADD-Gq mice shown in D during the same period. Locomotor activity from 12:00 to 6:00 P.M. is enlarged in the box. F, Change in VO2 (percentage) in LepRbPOA control (n = 4) and LepRbPOA DREADD-Gq (n = 4) mice at different CNO concentrations at RT. G, Photos capturing postural extension 70 min after CNO injection (1.5 mg/kg, i.p.) in a LepRbPOA DREADD-Gq mouse compared with a control mouse at RT in their home cages. Data are represented as mean ± SEM *p < 0.05, **p < 0.01, and ***p < 0.0001 (two-way repeated-measures ANOVA and Bonferroni's pairwise comparisons).
Figure 2.
Figure 2.
LepRbPOA neurons inhibit β3 adrenergic receptor-dependent BAT thermogenesis. A, 24 h VO2 measurement in LepRbPOA DREADD-Gq mice (n = 4) after injections of saline (black), CNO (0.5 mg/kg, i.p.; red), CL316,243 (1.0 mg/kg, i.p.; blue), or CNO + CL316,243 (green). B, The average VO2 during 6 h of postinjection was compared between injections. Values inside columns represent percentages compared with the saline injection. C, The average locomotor activity during 6 h after injection was compared between injections. Values inside columns represent percentages compared with the saline injection. Data are represented as mean ± SEM. Bars with different letters denote significant differences at p < 0.05 (one-way repeated-measures ANOVA and Fisher's least significant difference pairwise comparisons).
Figure 3.
Figure 3.
Chronic activation of LepRbPOA neurons. A, The experimental scheme showing timings of body weight measurement and injections for chronic CNO treatment. CNO was injected intraperitoneally twice daily at 0.3 mg/kg for 6 consecutive days following 3 d of saline injections, and no injection was made during 3 d of recovery. B, Body weight of LepRbPOA control (n = 5) and LepRbPOA DREADD-Gq (n = 5) mice during chronic CNO treatment. C, CNO reduced energy expenditure during 6 d of CNO treatment in LepRbPOA DREADD-Gq (n = 5) but not in control (n = 5) mice. D, Average daily energy expenditure (kcal/g/d) was compared between groups and treatments. E, Chronic CNO reduced daily food intake in LepRbPOA DREADD-Gq (n = 5) but not in control (n = 5) mice. F, Average daily food intake (kcal/g/d) was compared between groups and treatments. G, Change in food intake (percentage) in LepRbPOA control (n = 4) and LepRbPOA DREADD-Gq (n = 4) mice at different CNO concentrations at RT. Data are represented as mean ± SEM *p < 0.05, **p < 0.01, and bars with different letters denote significant differences at p < 0.05 (two-way repeated-measures ANOVA and Bonferroni's pairwise comparisons).
Figure 4.
Figure 4.
LepRbPOA neurons modulate food intake. A, Average daily locomotor activity was compared between groups and treatments during chronic CNO treatment. B, Total travel distance during 5 min was compared between groups (control, n = 5; DREADD-Gq, n = 4) and treatments 30 min after injections. C, The experimental scheme for restricted feeding. D, The first 2 h food intake during restricted feeding was measured in LepRbPOA control (n = 5) and LepRbPOA DREADD-Gq (n = 4) mice. Only LepRbPOA DREADD-Gq mice reduced food intake by CNO injection. E, Average 2 h food intake during the restricted feeding (control, n = 5; DREADD-Gq, n = 4). Saline data are from days 3 and 5, and CNO data are from days 4 and 6. Data are represented as mean ± SEM. *p < 0.01 (paired t test). Data with different letters denote significant differences at p < 0.05 (two-way repeated-measures ANOVA and Bonferroni's pairwise comparisons).
Figure 5.
Figure 5.
LepRbPOA neurons are activated by warm exposure, but not by cold exposure. A, Comparisons of energy expenditure and food intake between mice housed at 22°C (n = 6) and 30°C (n = 6). B, Representative immunohistochemical images showing the distribution of cFos (red, top panels) and cFos/LepRbPOA-EGFP (bottom panels) after 3 h of cold (4°C; n = 6), RT (22°C; n = 9), and warm (30°C; n = 6) exposure in LepRbEGFP mice. Insets show magnified images of the indicated areas (dotted line boxes). C, The percentage of LepRbPOA-EGFP cells that express cFos was calculated for each temperature condition. D, E, Total number of EGFP+ (D) and EGFP+/cFos+ (E) cells in the POA counted in each temperature condition. *p < 0.001 (independent t test). Data with different letters denote significant differences at p < 0.01 for C and p < 0.05 for E (one-way ANOVA and Fisher's least significant difference pairwise comparisons). n.s., Not significant.
Figure 6.
Figure 6.
Pharmacogenetic activation of LepRbPOA neurons at warm and cold ambient temperature. A, The experimental scheme showing timings of temperature changes and injections for indirect calorimetry experiment. B, At 30°C, LepRbPOA DREADD-Gq mice further decreased VO2 by CNO injection compared with saline injection. C, At 10°C, CNO injection greatly attenuated cold-induced increase in VO2 in LepRbPOA DREADD-Gq mice. D, Average VO2 during 4 h postinjection was calculated and the change from baseline (ΔVO2) was compared between saline and CNO in each temperature condition. RT value is calculated from Figure 1D. E, ΔVO2 Saline − ΔVO2 CNO was calculated for each temperature condition and normalized to 30°C. F, G, Locomotor activity in the same LepRbPOA DREADD-Gq mice shown in B and C during the same period. Locomotor activity from 12:00 to 6:00 P.M. is enlarged in the box. Data are represented as mean ± SEM. *p < 0.05, **p < 0.01, and ***p < 0.001 (two-way repeated-measures ANOVA and Bonferroni's pairwise comparisons for B–D, F, and G, and one-way repeated-measures ANOVA and Fisher's least significant difference pairwise comparisons for E).
Figure 7.
Figure 7.
LepRbPOA neurons are glutamatergic. A, B, Representative immunohistochemical images showing leptin-induced pSTAT3 (black, DAB staining) in the POA of Vglut2EYFP (A, n = 3) and VgatEYFP (B, n = 3) mice. Areas within dotted line indicate areas used for pSTAT3 cell counting. C, D, Representative immunohistochemical images showing leptin-induced pSTAT3 (red) and EYFP (green) in the POA of Vglut2EYFP (C) and VgatEYFP (D) mice. Insets show magnified images of the indicated areas (dotted-line boxes) to show colocalization of pSTAT3 and EYFP. E, F, Schematic drawings for the distribution of pSTAT3 and EYFP double-positive cells in the POA in Vglut2EYFP and VgatEYFP mice. G, H, At RT, CNO injection (1.5 mg/kg, i.p.) decreased rectal temperature in Vglut2POA DREADD-Gq but not in VgatPOA DREADD-Gq mice. Data are represented as mean ± SEM. *p < 0.01 and **p < 0.001 (two-way repeated-measures ANOVA and Bonferroni's pairwise comparisons).
Figure 8.
Figure 8.
Glutamatergic, not GABAergic, POA neurons mediate adaptations to ambient temperature changes. A–F, VO2 was measured in Vglut2POA and VgatPOA DREADD-Gq mice (n = 4 each) at RT, 30°C, and 10°C. Saline (black) or CNO (0.5 mg/kg, i.p.; red) was injected at 11:00 A.M. (CT5, arrows; Fig. 6A). Orange and blue boxes indicate temperature change to 30 and 10°C, respectively. Only Vglut2POA DREADD-Gq mice, but not VgatPOA DREADD-Gq mice, further decreased VO2 by CNO injection compared with saline injection in all temperature conditions. G, H, Average VO2 during 4 h after injection was calculated and the change from baseline (ΔVO2) was compared between saline and CNO in each temperature condition. I, ΔVO2 Saline − ΔVO2 CNO was calculated for each temperature condition and normalized to 30°C. Data for LepRbPOA DREADD-Gq mice are from Figure 6E. J, K, Locomotor activity in the same mice shown in A and D during the same period at RT. Locomotor activity was not affected by CNO (0.5 mg/kg, i.p.) in either Vglut2POA (n = 4) or VgatPOA (n = 4) DREADD-Gq mice. Data are represented as mean ± SEM. *p < 0.05, **p < 0.01, and ***p < 0.001 (two-way repeated-measures ANOVA and Bonferroni's pairwise comparisons for A–H, J, and K, and one-way repeated-measures ANOVA and Fisher's least significant difference pairwise comparisons for I).
Figure 9.
Figure 9.
A new view for BAT-related POA circuits. A, The original view suggests direct GABAergic innervation from POA neurons to the DMH and RPa. Here, warm-sensitive GABAergic POA neurons directly inhibit BAT-related neurons in the DMH/DHA and RPa. Upon cold exposure, POA GABAergic neurons are inhibited and DMH and RPa neurons are disinhibited, which causes activation of SNA to BAT to counteract heat loss from cold exposure. B, The new view proposes glutamatergic inputs to the DMH and RPa, which must be indirect to BAT-activating DMH and RPa neurons. Alternatively, LepRbPOA neurons might directly innervate warm-sensitive DMH neurons that inhibit BAT-activating RPa neurons via acetylcholine (Ach; Jeong et al., 2015). Here, warm-sensitive glutamatergic LepRbPOA neurons modulate both energy expenditure and food intake in a temperature-dependent manner to regulate body temperature and body weight. Solid lines indicate direct neuronal connections and dashed lines indicate indirect connections. Connections with question marks require further verification. cs, Cold-sensitive neurons; EE, energy expenditure; FI; food intake; Glut; glutamate; NE, norepinephrine; ws, warm-sensitive neurons.

References

    1. Andersson B, Larsson B. Influence of local temperature changes in the preoptic area and rostral hypothalamus on the regulation of food and water intake. Acta Physiol Scand. 1961;52:75–89. doi: 10.1111/j.1748-1716.1961.tb02203.x. - DOI - PubMed
    1. Andersson B, Ekman L, Gale CC, Sundsten JW. Control of thyrotrophic hormone (Tsh) secretion by the “heat loss center.”. Acta Physiol Scand. 1963;59:12–33. doi: 10.1111/j.1748-1716.1963.tb02719.x. - DOI - PubMed
    1. Bellefontaine N, Chachlaki K, Parkash J, Vanacker C, Colledge W, d'Anglemont de Tassigny X, Garthwaite J, Bouret SG, Prevot V. Leptin-dependent neuronal NO signaling in the preoptic hypothalamus facilitates reproduction. J Clin Invest. 2014;124:2550–2559. doi: 10.1172/JCI65928. - DOI - PMC - PubMed
    1. Boulant JA, Dean JB. Temperature receptors in the central nervous system. Annu Rev Physiol. 1986;48:639–654. doi: 10.1146/annurev.ph.48.030186.003231. - DOI - PubMed
    1. Cannon B, Nedergaard J. Nonshivering thermogenesis and its adequate measurement in metabolic studies. J Exp Biol. 2011;214:242–253. doi: 10.1242/jeb.050989. - DOI - PubMed

Publication types

MeSH terms