. 2016 May 4;36(18):5071-83.
doi: 10.1523/JNEUROSCI.3540-15.2016.

Effects of Electrical Stimulation in the Inferior Colliculus on Frequency Discrimination by Rhesus Monkeys and Implications for the Auditory Midbrain Implant

Affiliations

Effects of Electrical Stimulation in the Inferior Colliculus on Frequency Discrimination by Rhesus Monkeys and Implications for the Auditory Midbrain Implant

Daniel S Pages et al. J Neurosci. .

Abstract

Understanding the relationship between the auditory selectivity of neurons and their contribution to perception is critical to the design of effective auditory brain prosthetics. These prosthetics seek to mimic natural activity patterns to achieve desired perceptual outcomes. We measured the contribution of inferior colliculus (IC) sites to perception using combined recording and electrical stimulation. Monkeys performed a frequency-based discrimination task, reporting whether a probe sound was higher or lower in frequency than a reference sound. Stimulation pulses were paired with the probe sound on 50% of trials (0.5-80 μA, 100-300 Hz, n = 172 IC locations in 3 rhesus monkeys). Electrical stimulation tended to bias the animals' judgments in a fashion that was coarsely but significantly correlated with the best frequency of the stimulation site compared with the reference frequency used in the task. Although there was considerable variability in the effects of stimulation (including impairments in performance and shifts in performance away from the direction predicted based on the site's response properties), the results indicate that stimulation of the IC can evoke percepts correlated with the frequency-tuning properties of the IC. Consistent with the implications of recent human studies, the main avenue for improvement for the auditory midbrain implant suggested by our findings is to increase the number and spatial extent of electrodes, to increase the size of the region that can be electrically activated, and to provide a greater range of evoked percepts.

Significance statement: Patients with hearing loss stemming from causes that interrupt the auditory pathway after the cochlea need a brain prosthetic to restore hearing. Recently, prosthetic stimulation in the human inferior colliculus (IC) was evaluated in a clinical trial. Thus far, speech understanding was limited for the subjects and this limitation is thought to be partly due to challenges in harnessing the sound frequency representation in the IC. Here, we tested the effects of IC stimulation in monkeys trained to report the sound frequencies they heard. Our results indicate that the IC can be used to introduce a range of frequency percepts and suggest that placement of a greater number of electrode contacts may improve the effectiveness of such implants.

Keywords: auditory; auditory midbrain implant; electrical stimulation; inferior colliculus; prosthesis.


Figures

Figure 1.
Figure 1.
Frequency discrimination task. Animals initiated trials by grasping a touch sensor. They then heard a series of “reference” sounds (shown as black dots) followed by “probe” sounds (red dots) interleaved with reference sounds. They reported whether the probe was higher (A) or lower (B) in frequency than the reference sounds. Decisions were indicated by either releasing (“go now”) or continuing to hold the touch sensor during the presentation of the probe sounds; in the latter case, they had to release the lever at the conclusion of the probe sounds when a broad band noise was delivered (gray bar; “go later”). Correct trials were reinforced with a liquid (typically juice) reward. During experiments that included electrical stimulation, the stimulation was applied on 50% of the trials and was delivered during the probe stimuli.
Figure 2.
Figure 2.
Example psychometric curves. Individual dots indicate the percentage “higher” judgments for a given probe frequency; each color (AC) or color family (D) represents a different RF. Positive slopes of logistic regressions indicate a greater proportion of “higher” choices for higher frequencies for a given RF; the shifts in the curves for the different RFs indicate that the monkeys were judging probe frequency relative to the corresponding RF. Trials came from testing sessions in which electrical stimulation was delivered in other trials, which are excluded from analysis in this figure (A, B, D), or from training trials in which electrical stimulation was not delivered at all during the session (C). The sound level of the RF was 55 dB SPL. Probe sound levels could be 45, 55, or 65 dB SPL for monkeys V and J; these monkeys successfully ignored this jitter in probe sound level and made judgements based primarily on probe frequency (D).
Figure 3.
Figure 3.
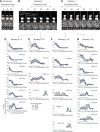
Location of recording sites within the IC (A–C) and tonotopic organization at example electrode penetrations (D–G). AC, MRI scans in the coronal plane. The recording cylinders were filled with saline for the scan and can be seen above the brain in white. The dark bands within in the recording cylinders are the plastic grids used to hold the shaft of the electrodes as they advanced toward the IC. Penetration locations could be reconstructed based on the positions of marking wires placed in the grid for the MRI scans. The red lines indicate the medial and lateral extent of our stimulation sites based on these reconstructions. The location of the IC is indicated in B by the dashed circles on the opposite side of the brain for clarity. The rostral/caudal extent of the stimulation sites are indicated by the bar above the relevant sections. The dorsal/ventral dimension in monkeys V and J is explored further in DG. Each plot indicates the multiunit response properties of an IC site as the animal passively listened to tones. The plots in a given column indicate the responses as the electrode was advanced at semiregular intervals from dorsal to ventral locations. Sites responded to higher and higher frequency sounds with increasing depth, demonstrating tonotopy consistent with the central nucleus of the IC and less consistent with other nearby regions. Tonotopy in monkey M was characterized in a previous study from our group (Bulkin and Groh, 2011).
Figure 4.
Figure 4.
Example effects of stimulation on frequency discrimination. The site illustrated in A and B was sharply tuned to the frequency as assessed with tones, exhibiting a BF of 600 Hz (peak of Gaussian fit; A). When stimulation was applied during performance of a task with a 3000 Hz RF (B), the monkey increased its proportion of “lower” choices and reduced its proportion of “higher” choices. C, D, A different site, tested with band-pass noise, having a BF of 3014 Hz, which was higher than the RF of 827 Hz. Stimulation at this site shifted the psychometric function in favor of higher choices. The effects of stimulation were statistically significant for both sites (Fisher's exact test; B, n = 235 trials, p = 6.1*10–9; D, n = 1318 trials, p = 1.2*10–14).
Figure 5.
Figure 5.
Electrical stimulation could also impair performance on the frequency discrimination task (A, B) or shift behavior away from the BF of the neurons at the stimulation site (C, D). The site illustrated in A had a BF of 454 Hz, which was lower than the RF of 827 Hz, but stimulation at this site produced only a small shift in the direction of the BF (B; Fisher's exact test, n = 1169, p = 0.022). Rather, the psychometric function was slightly but consistently flattened on stimulation trials compared with nonstimulated trials. C, D, Example “paradoxical” effect in which the stimulation exerted a shift in the psychometric function in the direction opposite to what would be expected based on the frequency-tuning properties of the site. The site had a BF of 509 Hz, lower than the RF of 827 Hz, but stimulation increased the proportion of high-frequency judgments relative to the control trials (Fisher's exact test, n = 197, p = 0.0039).
Figure 6.
Figure 6.
A, Effect of electrical stimulation on frequency discrimination correlated with the difference between BF of the recording site and the RF. Filled circles represent individual experiments; some individual experiments fall outside of the plotted range on this y-axis scale and are plotted as gray circles at the relevant edges of the panels, (stacked so that they can all be seen). Significance at the population level was assessed via linear regression of SEI versus log2(BF) − log2(RF) across the experiments. A positive slope for the population data (r = 0.16; p = 0.0013; n = 424) indicated that the animals reported higher frequency percepts when stimulated at sites where the BF was higher than the RF and the animals reported lower frequency percepts when stimulated at sites where the BF was lower than the RF. BD, Data subdivided by RF, revealing that the pattern was qualitatively similar for different ranges of RFs.
Figure 7.
Figure 7.
The effect of electrical stimulation on frequency discrimination correlated with BF of the recording site (A; r = 0.11, p = 0.009), but not with RF (B; r = 0.05, p = 0.27). Again, points outside of the axes are shown in gray circles and are both stacked and slightly jittered horizontally for clarity.
Figure 8.
Figure 8.
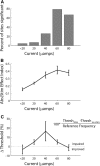
Relationship between electrical stimulation current and its effects on frequency discrimination. A, More intense electrical stimulation increased the proportion of sites where its effect was statistically significant (Fisher's exact test, p < 0.05). B, Stimulation tended to produce the largest systematic perceptual shifts at higher stimulation currents (40 μA and above). This panel plots the absolute value of the SEI versus stimulation current. SEI indicates the percentage “high” choices “added” by stimulation, so its absolute value captures both shifts in favor of more high choices and shifts in favor of more low choices. C, Stimulation-induced changes in frequency discrimination threshold as a function of stimulation current (Eq. 2).
Figure 9.
Figure 9.
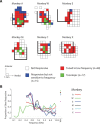
The primate IC shows limited topography and broad tuning at individual sites. This figure is reprinted from Figures 5 and 6 from Bulkin and Groh (2011). In that study, we mapped the IC in an awake but nonperforming monkey, characterizing the frequency-tuning properties of multiunit activity at sites spaces 500 μm apart along electrode trajectories passing through the IC and spaced 1 mm apart in a plane slightly tilted from the anterior/posterior and medial/lateral axes (see Bulkin and Groh, 2011 for full details). A, Only about one-fourth of the penetrations passing through tone-responsive regions were classified as tonotopic (green squares vs red ones), or 17% of the auditory responsive region as a whole. Non-tonotopic tone-responsive sites (red squares) responded best to low frequencies. Sites that were responsive but not selective for frequency were also observed (blue squares). Our present stimulation experiments were conducted at frequency selective sites (either low-frequency tuned or tonotopic locations). B, Proportion of sites responding as a function of tone frequency at 50 dB. Because all sites were tested at an overlapping set of frequencies and intensities, estimates of the proportion of the IC responding to a given tone frequency at a fixed, moderate intensity could be obtained. Dots on the right side of this plot show the corresponding information for broadband or white noise stimuli (marked WN).

References

    1. Aitkin LM, Moore DR. Inferior colliculus. II. Development of tuning characteristics and tonotopic organization in central nucleus of the neonatal cat. J Neurophysiol. 1975;38:1208–1216. - PubMed
    1. Atencio CA, Shih JY, Schreiner CE, Cheung SW. Primary auditory cortical responses to electrical stimulation of the thalamus. J Neurophysiol. 2014;111:1077–1087. doi: 10.1152/jn.00749.2012. - DOI - PMC - PubMed
    1. Bendor D, Wang X. The neuronal representation of pitch in primate auditory cortex. Nature. 2005;436:1161–1165. doi: 10.1038/nature03867. - DOI - PMC - PubMed
    1. Bendor D, Wang X. Cortical representations of pitch in monkeys and humans. Curr Opin Neurobiol. 2006;16:391–399. doi: 10.1016/j.conb.2006.07.001. - DOI - PMC - PubMed
    1. Bigelow J, Rossi B, Poremba A. Neural correlates of short-term memory in primate auditory cortex. Front Neurosci. 2014;8:250. doi: 10.3389/fnins.2014.00250. - DOI - PMC - PubMed

LinkOut - more resources