. 2016 Jul 1;311(1):F120-30.
doi: 10.1152/ajprenal.00456.2015. Epub 2016 May 4.

Albumin contributes to kidney disease progression in Alport syndrome

Affiliations

Albumin contributes to kidney disease progression in Alport syndrome

George Jarad et al. Am J Physiol Renal Physiol. .

Abstract

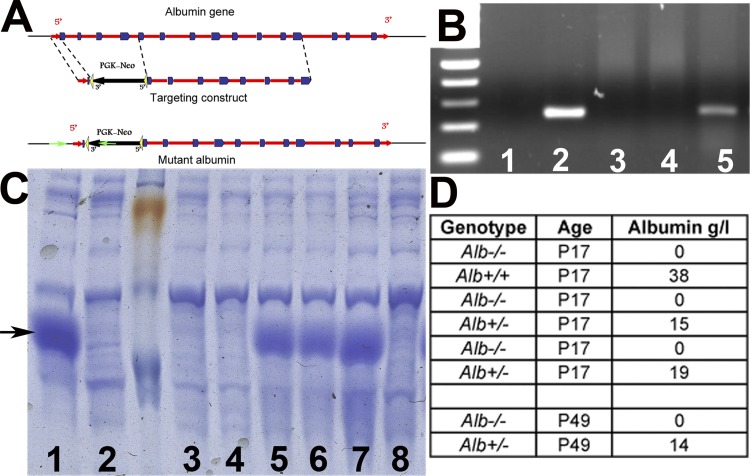
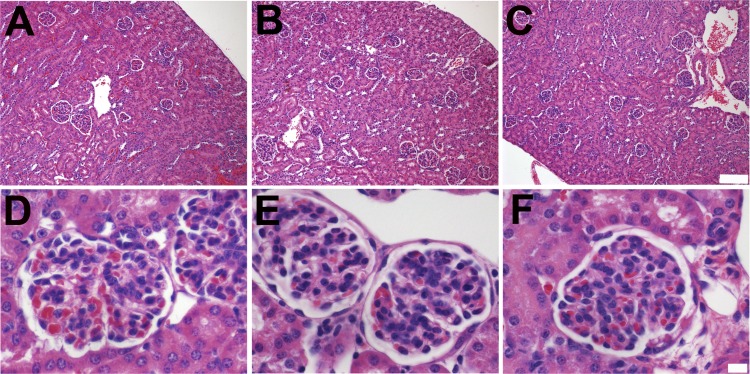
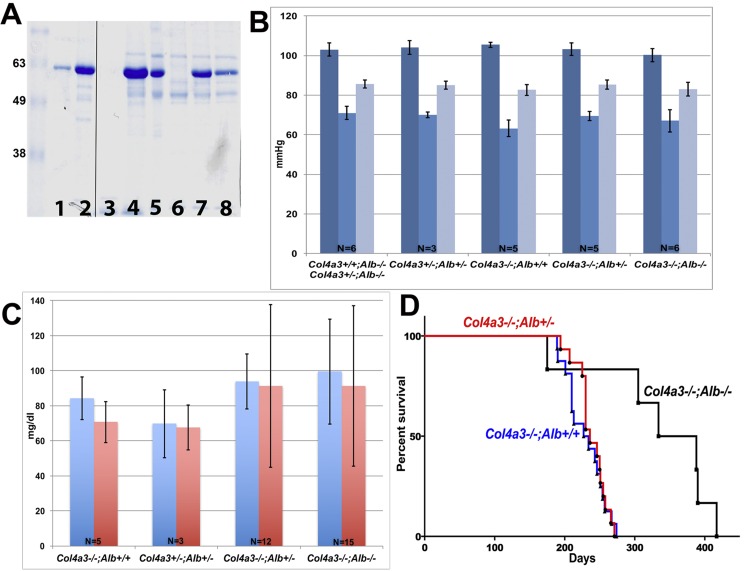
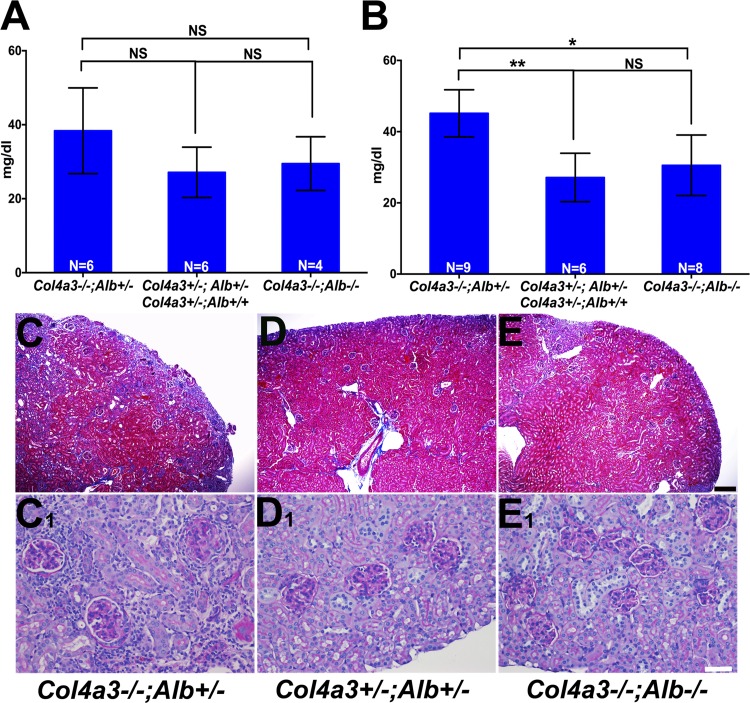
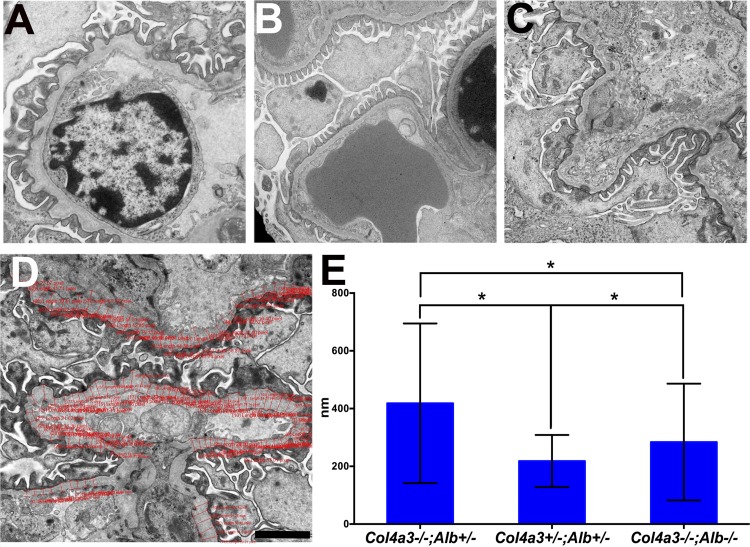
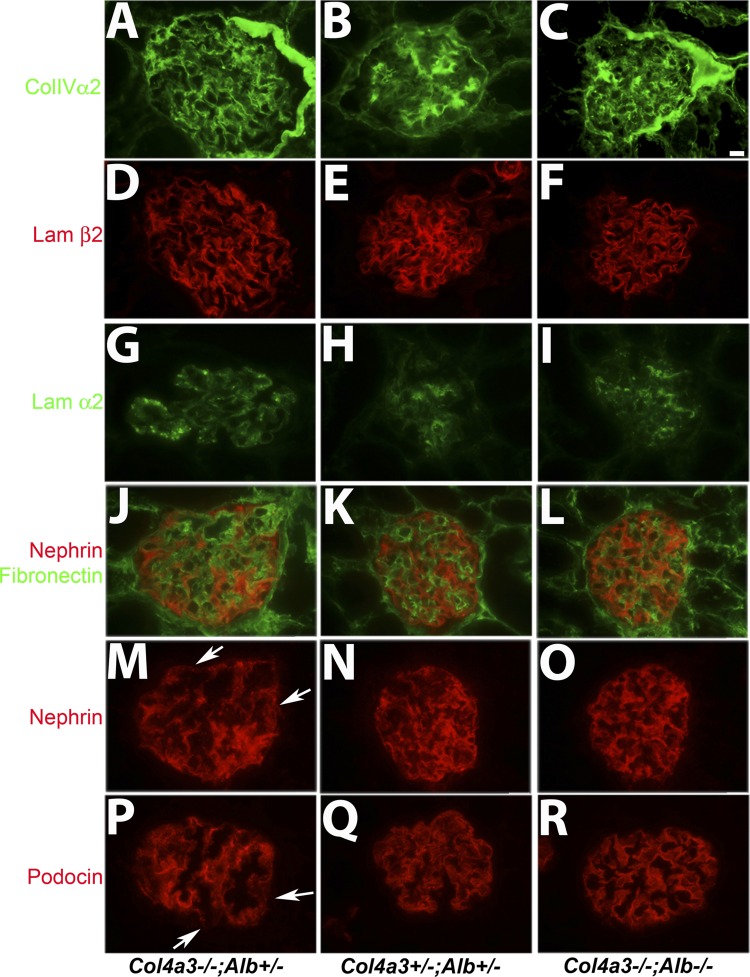
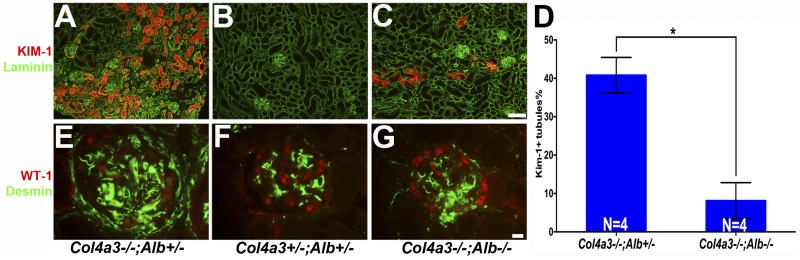
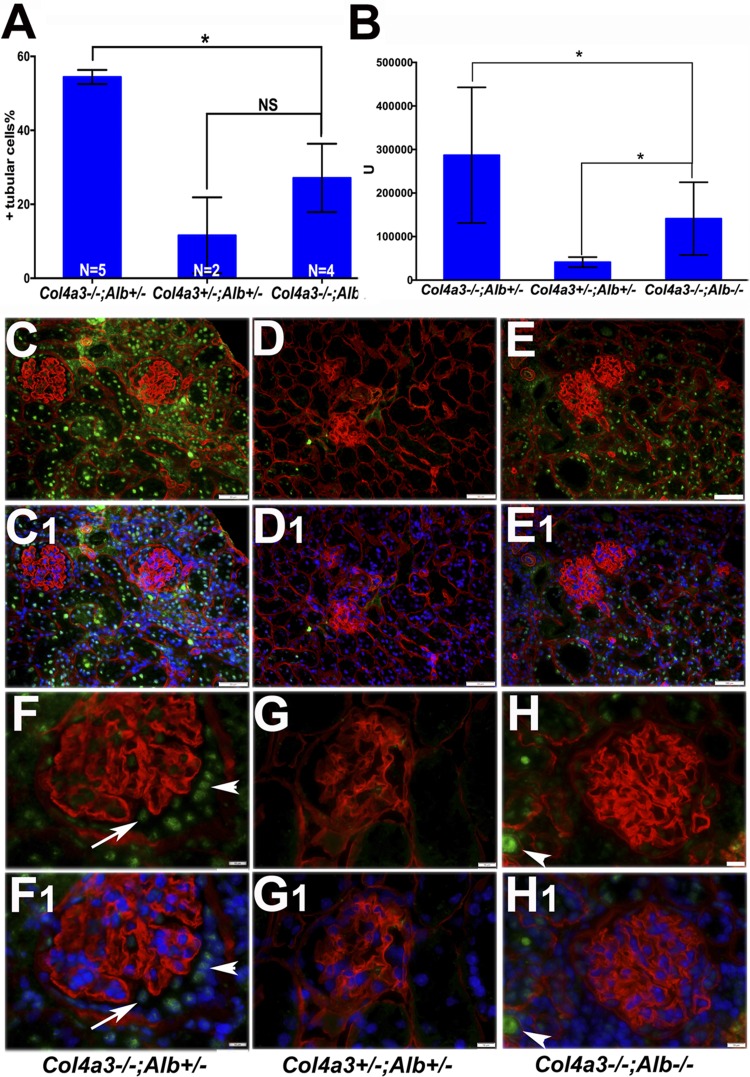
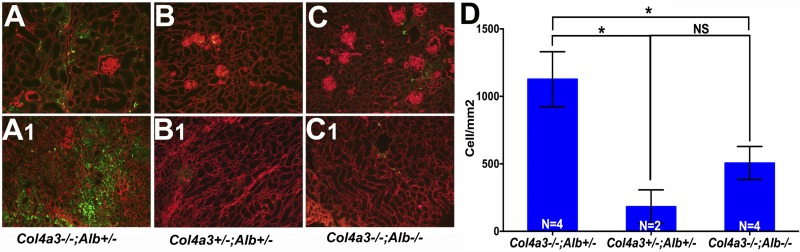
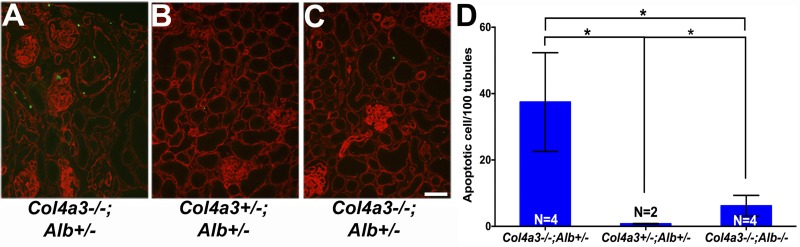
Alport syndrome is a familial kidney disease caused by defects in the collagen type IV network of the glomerular basement membrane. Lack of collagen-α3α4α5(IV) changes the glomerular basement membrane morphologically and functionally, rendering it leaky to albumin and other plasma proteins. Filtered albumin has been suggested to be a cause of the glomerular and tubular injuries observed at advanced stages of Alport syndrome. To directly investigate the role that albumin plays in the progression of disease in Alport syndrome, we generated albumin knockout (Alb(-/-)) mice to use as a tool for removing albuminuria as a component of kidney disease. Mice lacking albumin were healthy and indistinguishable from control littermates, although they developed hypertriglyceridemia. Dyslipidemia was observed in Alb(+/-) mice, which displayed half the normal plasma albumin concentration. Alb mutant mice were bred to collagen-α3(IV) knockout (Col4a3(-/-)) mice, which are a model for human Alport syndrome. Lack of circulating and filtered albumin in Col4a3(-/-);Alb(-/-) mice resulted in dramatically improved kidney disease outcomes, as these mice lived 64% longer than did Col4a3(-/-);Alb(+/+) and Col4a3(-/-);Alb(+/-) mice, despite similar blood pressures and serum triglyceride levels. Further investigations showed that the absence of albumin correlated with reduced transforming growth factor-β1 signaling as well as reduced tubulointerstitial, glomerular, and podocyte pathology. We conclude that filtered albumin is injurious to kidney cells in Alport syndrome and perhaps in other proteinuric kidney diseases, including diabetic nephropathy.

Keywords: Alport syndrome; albumin; collagen type IV.


Figures

Fig. 1.
Fig. 1.
Generation of albumin knockout (Alb−/−) mice and verification of the lack of albumin. A: schematic diagrams showing the Alb gene, the Alb targeting construct designed to eliminate four 5′-exons, and the targeted locus. Green arrows indicate the location of primers used to identify the mutant allele. B: RT-PCR from Alb−/− mouse liver RNA showing the lack of albumin mRNA. Lane 1, negative control (RNA from a normal liver without reverse transcriptase reaction); lane 2, wild-type (WT) liver; lane 3, Alb−/− liver; lane 4, normal spleen; lane 5, Alb+/− liver. C: SDS-PAGE analysis of 0.1 μl serum from Alb+/+ (lanes 1 and 7), Alb+/− (lanes 5 and 6), and Alb−/− (lanes 2–4 and 8) mice showing the complete lack of the dense albumin band in Alb−/− sera. Arrow points to the 67-kDa albumin band D: serum albumin concentrations in mice as measured by ELISA. Alb−/− mice had no albumin and Alb+/− mice had reduced albumin. None developed the ascites or subcutaneous edema commonly associated with hypoalbuminemia. Ages were measured in postnatal days (P).
Fig. 2.
Fig. 2.
Alb−/− and Alb+/− mice have normal kidney histology. A–F: low-magnification (×100; A–C) and high-magnification (×600; D–F) images of hematoxylin and eosin-stained kidney sections from Alb+/+ (A and D), Alb+/− (B and E), and Alb−/− (C and F) mice revealed no obvious histological abnormalities.
Fig. 3.
Fig. 3.
Characterization of collagen-α3(IV)-null (Col4a3−/−);Alb−/− double knockout (DKO) mice. A: SDS-PAGE analysis of 1 and 5 μg BSA (lanes 1 and 2, respectively), 5 μl urine (lanes 3–5), and 0.1 μl serum (lanes 6–8) from a DKO mouse (lanes 3 and 6), a Col4a3−/−;Alb+/+ mouse (lanes 4 and 7), and a Col4a3−/−;Alb+/− mouse (lanes 5 and 8); all were 190 days old. Note the complete lack of albumin and albuminuria in the DKO mouse and reduced circulating albumin and albuminuria in the Col4a3−/−;Alb+/− mouse. B: intravascular blood pressure (BP) measurements (means ± SD) in the different genotypes, as indicated. Systolic BPs are shown in dark blue, diastolic BPs in light blue, and mean BPs in gray. There were no significant differences between DKO (n = 6) and Col4a3−/−;Alb+/− (n = 5) mice (P values for systolic, diastolic, and mean BPs were 0.15, 0.54 and 0.21, respectively). C: total serum lipid (blue) and triglyceride (red) measurements in adult mice of the different genotypes (means ± SD), as indicated. DKO (n = 15) and Col4a3−/−;Alb+/− (n = 12) mice showed the same level of dyslipidemia (P values for total lipid and triglyceride levels were 0.5 and 0.7, respectively). DKO mice showed a trend toward higher lipid and triglyceride concentrations compared with Col4a3+/−;Alb+/− mice (P values for total lipid and triglyceride levels were 0.12 and 0.13, respectively) and Col4a3−/−;Alb+/+ mice (n = 5), but the differences did not reach statistical significance (P values for total lipid and triglyceride levels were >0.05). D: survival curves for B6 Alport mice WT for albumin (blue line, n = 14), heterozygous for albumin (red line, n = 15), and lacking albumin (black line, n = 6). The mean lifespan of Col4a3−/−;Alb+/+ mice was 220 days. Survival increased to 236 days in Col4a3−/−;Alb+/− mice and to 361 days in DKO mice. The difference in survival was statistically significant between DKO and Alport mice with albumin (P = 0.0015). The difference in survival was not significant between Col4a3−/−;Alb+/+ and Col4a3−/−;Alb+/− mice (P = 0.76).
Fig. 4.
Fig. 4.
Characterization of DKO kidney function and histology. A: Col4a3−/−;Alb+/− mice showed higher blood urea nitrogen (BUN) concentrations compared with control (Col4a3+/−;Alb+/− and Col4a3+/−;Alb+/+) and DKO mice before 180 days of age; however, the difference was not statistically significant (NS; P = 0.17 and 0.074, respectively). The difference between control and DKO mice was not significant (NS, P = 0.63). B: after 180 days of age, BUN rose more in Col4a3−/−;Alb+/− mice compared with DKO mice (*P = 0.0017) and compared with control mice (**P = 0.0004). There was no significant change in BUN of DKO mice compared with Col4a3+/−;Alb+/− mice (NS, P = 0.42). The control group was the same in both A and B. C–E: trichrome staining of kidney sections from 200-day-old Col4a3−/−;Alb+/− (C), Col4a3+/−;Alb+/− (D; control), and DKO (E) mice showing reduced fibrosis (blue staining) in DKO kidneys compared with Col4a3−/−;Alb+/− kidneys. Magnification: ×40. Scale bar = 200 μm. C,1–E,1: periodic acid-Schiff staining of kidney sections from 200-day-old Col4a3−/−;Alb+/− (C,1), Col4a3+/−;Alb+/− (D,1), and DKO (E,1) mice showing decreased interstitial fibrosis, inflammation, and glomerulosclerosis in DKO kidneys compared with Col4a3−/−;Alb+/− kidneys. Original magnification was ×200. Scale bar = 50 μm.
Fig. 5.
Fig. 5.
Ultrastructural analysis of the glomerular filtration barrier. A–C: analysis of the glomerular filtration barrier from 200-day-old Col4a3−/−;Alb+/− (A), Col4a3+/−;Alb+/− (B; control), and DKO (C) mice showing preserved glomerular basement membrane (GBM) width and podocyte foot processes in DKO kidneys compared with Col4a3−/−;Alb+/− kidneys (×15,000). D and E: analysis of GBM width. GBM width was measured using Olympus CellSens software as shown in D. Original magnification was ×10,000. Scale bar = 2,000 nm. E: GBM widths in a 200-day-old DKO mouse and a Col4a3−/−;Alb+/− mouse compared with a double heterozygous littermate (means ± SD). The numbers of individual measurements were 1,836 for the Col4a3−/−;Alb+/− group, 995 for the Col4a3+/−;Alb+/− group, and 2,298 for the DKO group. *P <0.0001 for all groups.
Fig. 6.
Fig. 6.
Characterization of GBM and podocyte proteins in sections from 200-day-old Col4a3−/−;Alb+/−, Col4a3+/−;Alb+/−, and DKO kidneys A–C: collagen-α2(IV) [part of the α1α1α2(IV) trimer] was predominant in the mesangial matrix of Col4a3+/−;Alb+/− glomeruli, with faint signal in the GBM (B). In Alport mice, collagen-α1α1α2(IV) was predominant in the GBM regardless of the presence (A) or absence (C) of albumin. D–F: in normal and Alport glomeruli, the predominant laminin in the GBM was laminin-521, as evidenced by the presence of laminin-β2 in the GBM in all cases. G–I: in normal glomeruli, laminin-α2 was found in the mesangial matrix (H). In Alport glomeruli, increasing amounts of laminin-α2 were deposited into the GBM (G), but this was less so in the absence of albumin (I). J–L: double staining for fibronectin (green) and nephrin (red). In Alport glomeruli (J), fibronectin expanded beyond the mesangial matrix into the GBM, while nephrin localization in podocytes became more diffuse throughout the cell body versus the typical linear signal in normal glomeruli (K). These changes were attenuated in the absence of albumin in DKO mice (L). M–O: nephrin staining from glomeruli shown in J–L. Arrows in M show areas of discontinuous nephrin staining. P–R: podocin localization paralleled that of nephrin. In Alport mice, podocin expression was somewhat reduced and lost its linear staining pattern (P) compared with control (Q). These changes were significantly attenuated in DKO mice (R). Arrows in P show areas of discontinuous podocin staining. Original magnification was ×600 for all images. Scale bar = 10 μm.
Fig. 7.
Fig. 7.
The absence of albumin improves tubular and glomerular injury. A–D: kidney injury molecule (KIM)-1 (red) showed increased expression in proximal tubules from Col4a3−/−;Alb+/− mice (A) compared with DKO mice (C). Counterstaining with anti-laminin (green) labeled basement membranes. Original magnification was ×100. Scale bar = 100μm. D: quantification of KIM-1 expression as measured by the percentage of KIM-1-positive tubules. *P <0.0001. KIM-1-positive tubules were very rare in control kidneys (B). Mice were 200 days old. F–H: desmin (green), a marker of mesangial cells, interstitial fibroblasts, and injured podocytes, was increased in Col4a3−/−;Alb+/− glomeruli compared with DKO glomeruli. Costaining for Wilms' tumor-1 (WT-1; red nuclei) showed that the number of podocytes was reduced in Col4a3−/−;Alb+/− mice versus the other mice. Original magnification was ×600. Scale bar = 10μm. Mice were 200 days old.
Fig. 8.
Fig. 8.
The absence of albumin attenuated transforming growth factor (TGF)-β1 signaling as assayed by nuclear phosphorylated (p-)SMAD2. Nuclear p-SMAD2 was detected by immunofluorescence in sections of 180- to 220-day-old Col4a3−/−;Alb+/, Col4a3+/−;Alb+/−, and DKO kidneys. A and B: quantification of p-SMAD2 staining in tubular cells. A: percentage of p-SMAD2-positive tubular nuclei. Col4a3−/−;Alb+/− kidneys showed a significant increase in p-SMAD2-positive tubular cells compared with DKO kidneys. *P = 0.0085. The difference between DKO and control kidneys was not significant (NS, P = 0.22). B: mean fluorescence intensity of 100 positive nuclei. *P < 0.0001 for all groups. C–E: examples of p-SMAD2 nuclear localization in Col4a3−/−;Alb+/− kidneys (C) compared with control (D) and DKO (E) kidneys. Counterstaining with anti-nidogen (red) labeled all basement membranes. C1E1: nuclei were counterstained with Hoechst 33342 to confirm p-SMAD2 nuclear localization. Original magnification was ×100. Scale bar = 100 μm. F–H: higher-magnification images showing nuclear p-SMAD2 distribution in glomeruli from 200-day-old mice. F1–H1: nuclei were counterstained with Hoechst 33342 to confirm p-SMAD2 nuclear localization. Arrowhead and arrow point to parietal epithelial cells with increased nuclear p-SMAD2 staining and a podocyte with nuclear p-SMAD2, respectively, in a Col4a3−/−;Alb+/− kidney. There was no detectable nuclear p-SMAD2 staining in control (G) or DKO (H) glomeruli. Arrowheads in H and H1 indicate background staining of a tubular cast. Original magnification was ×600. Scale bar = 10 μm.
Fig. 9.
Fig. 9.
Absence of albumin decreased macrophage infiltration in Alport kidneys. Kidneys from Col4a3−/−;Alb+/− mice (A and A1) showed extensive macrophage infiltration, as evidenced by extensive CD68 staining (green) in the cortex (A) and medulla (A,1). DKO kidneys (C and C1) showed a reduction in macrophage invasion that was similar to control kidneys (B and B1). Counterstaining with laminin-α5 antibody (red) labeled all basement membranes. Original magnification was ×100. Scale bar = 100 μm. Mice were 200 days old. D: quantification of macrophage infiltration as measured by the number of CD68-positive cells/mm2. The difference was significant between Col4a3−/−;Alb+/− kidneys and kidneys from DKO and control mice (*P = 0.0036 and 0.0039, respectively). The difference between DKO and control kidneys was not significant (NS, P = 0.093).
Fig. 10.
Fig. 10.
Absence of albumin decreased tubular cell apoptosis in DKO kidneys. TUNEL staining (green) identified increased numbers of apoptotic cells in Col4a3−/−;Alb+/− kidneys (A) compared with DKO kidneys (C). In control kidneys (B), there were only occasional (<1 cell/high-power field) apoptotic cells within the interstitium. Counterstaining with anti-nidogen (red) labeled all basement membranes. Original magnification was ×200. Scale bar = 50 μm. D: quantification of tubular cell apoptosis as measured by the number of TUNEL-positive nuclei per 100 tubules. The difference between Col4a3−/−;Alb+/− kidneys and kidneys from DKO and control mice was significant (*P = 0.022 and 0.016, respectively). There were significantly more apoptotic tubular cells in DKO kidneys compared with control kidneys (*P = 0.016).

References

    1. Abbate M, Zoja C, Morigi M, Rottoli D, Angioletti S, Tomasoni S, Zanchi C, Longaretti L, Donadelli R, Remuzzi G. Transforming growth factor-β1 is up-regulated by podocytes in response to excess intraglomerular passage of proteins: a central pathway in progressive glomerulosclerosis. Am J Pathol 161: 2179–2193, 2002. - PMC - PubMed
    1. Abe H, Shibuya T, Odashima S, Arichi S, Nagase S. Alterations in the glomerulus in aminonucleoside nephrosis in analbuminemic rats. Nephron 50: 351–355, 1988. - PubMed
    1. Abrahamson DR, Isom K, Roach E, Stroganova L, Zelenchuk A, Miner JH, St John PL. Laminin compensation in collagen α3(IV) knockout (Alport) glomeruli contributes to permeability defects. J Am Soc Nephrol 18: 2465–2472, 2007. - PubMed
    1. Andrews KL, Mudd JL, Li C, Miner JH. Quantitative trait loci influence renal disease progression in a mouse model of Alport syndrome. Am J Pathol 160: 721–730, 2002. - PMC - PubMed
    1. Bennhold H, Kallee E. Comparative studies on the half-life of I131-labeled albumins and nonradioactive human serum albumin in a case of analbuminemia. J Clin Invest 38: 863–872, 1959. - PMC - PubMed

Publication types

MeSH terms