. 2016 Jun 24;90(14):6387-6400.
doi: 10.1128/JVI.00619-16. Print 2016 Jul 15.

Hepatitis C Virus-Induced Upregulation of MicroRNA miR-146a-5p in Hepatocytes Promotes Viral Infection and Deregulates Metabolic Pathways Associated with Liver Disease Pathogenesis

Affiliations

Hepatitis C Virus-Induced Upregulation of MicroRNA miR-146a-5p in Hepatocytes Promotes Viral Infection and Deregulates Metabolic Pathways Associated with Liver Disease Pathogenesis

Simonetta Bandiera et al. J Virol. .

Abstract

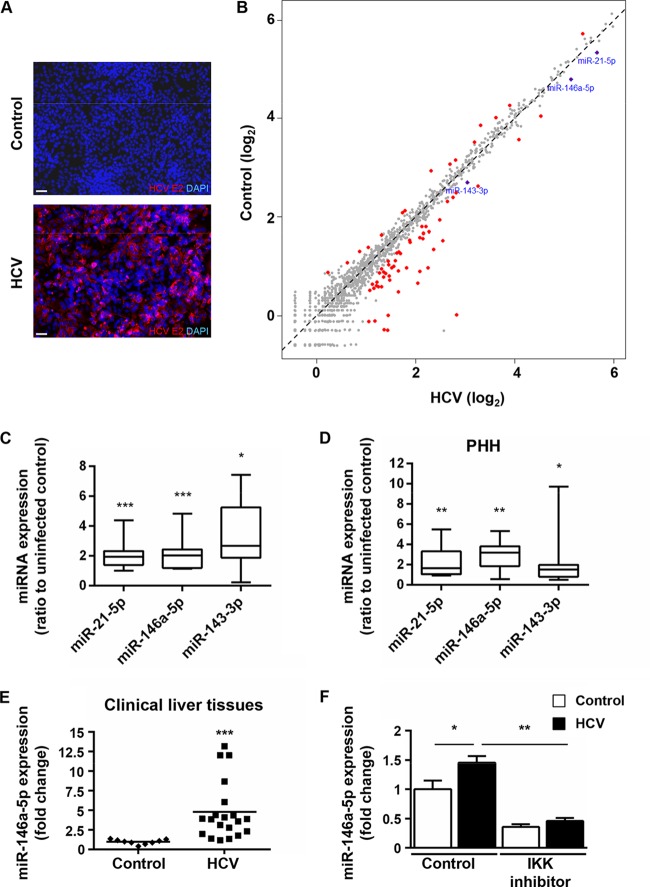
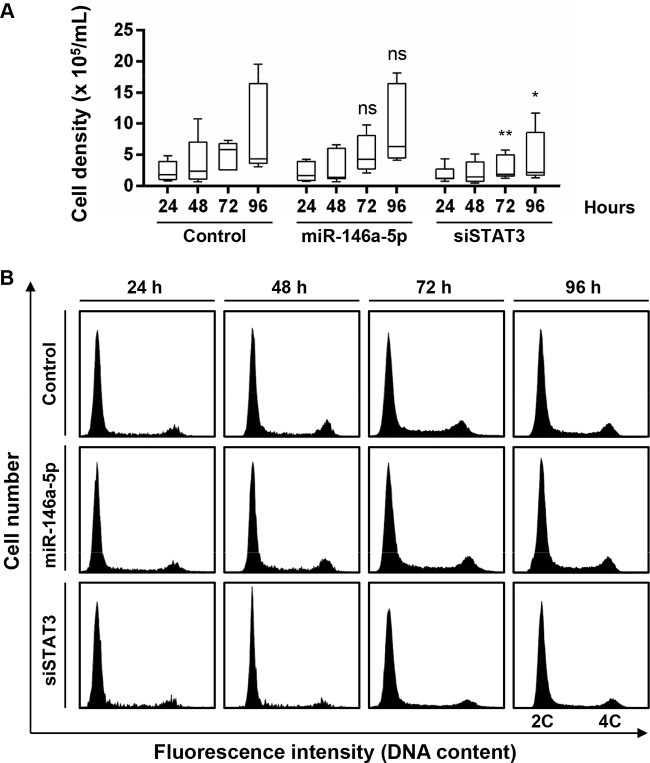
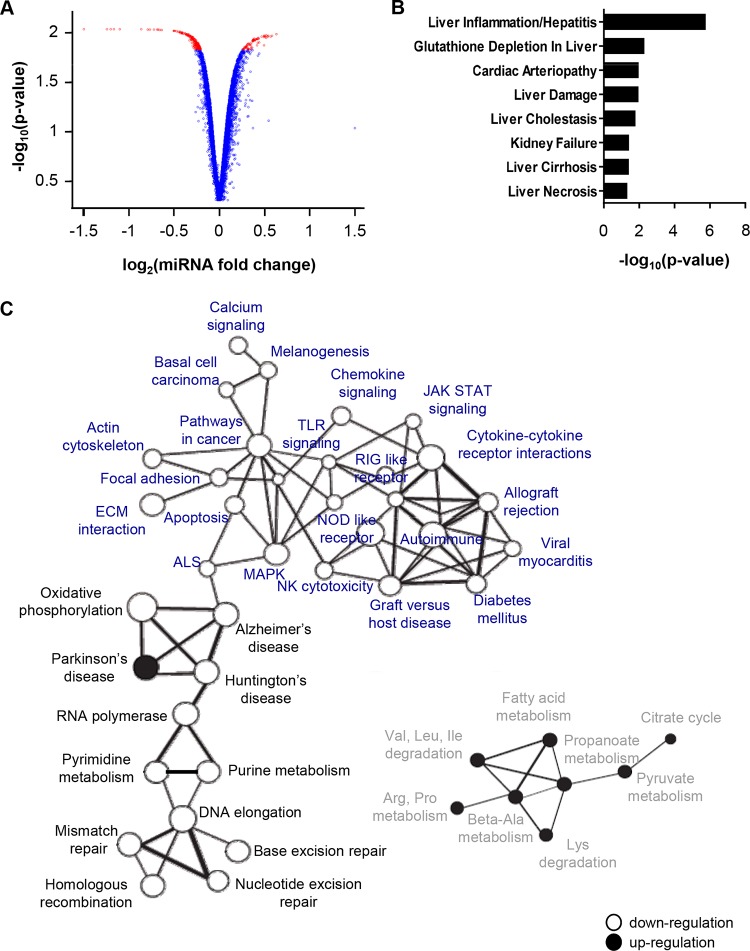
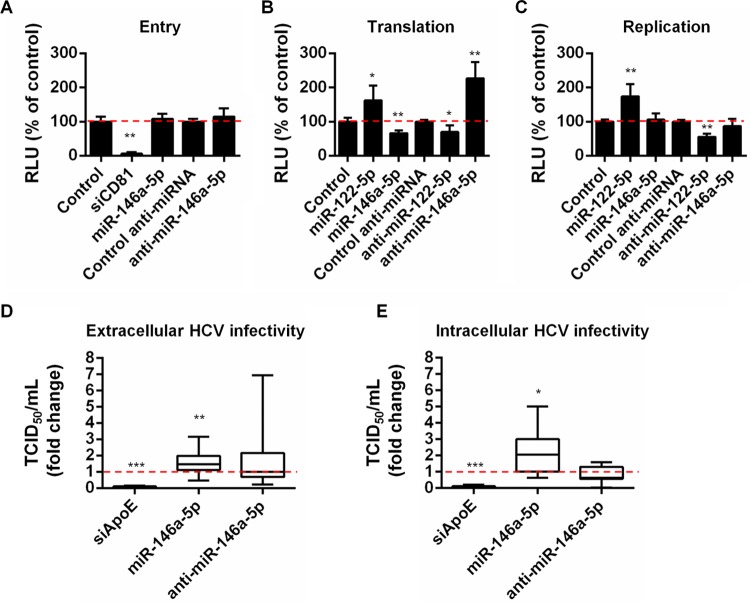
Hepatitis C virus (HCV)-induced chronic liver disease is a leading cause of hepatocellular carcinoma (HCC). However, the molecular mechanisms underlying HCC development following chronic HCV infection remain poorly understood. MicroRNAs (miRNAs) play an important role in homeostasis within the liver, and deregulation of miRNAs has been associated with liver disease, including HCC. While host miRNAs are essential for HCV replication, viral infection in turn appears to induce alterations of intrahepatic miRNA networks. Although the cross talk between HCV and liver cell miRNAs most likely contributes to liver disease pathogenesis, the functional involvement of miRNAs in HCV-driven hepatocyte injury and HCC remains elusive. Here we combined a hepatocyte-like cell-based model system, high-throughput small RNA sequencing, computational analysis, and functional studies to investigate HCV-miRNA interactions that may contribute to liver disease and HCC. Profiling analyses indicated that HCV infection differentially regulated the expression of 72 miRNAs by at least 2-fold, including miRNAs that were previously described to target genes associated with inflammation, fibrosis, and cancer development. Further investigation demonstrated that the miR-146a-5p level was consistently increased in HCV-infected hepatocyte-like cells and primary human hepatocytes, as well as in liver tissue from HCV-infected patients. Genome-wide microarray and computational analyses indicated that miR-146a-5p overexpression modulates pathways that are related to liver disease and HCC development. Furthermore, we showed that miR-146a-5p has a positive impact on late steps of the viral replication cycle, thereby increasing HCV infection. Collectively, our data indicate that the HCV-induced increase in miR-146a-5p expression both promotes viral infection and is relevant for pathogenesis of liver disease.

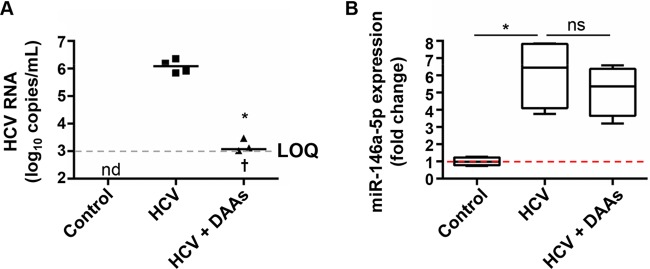
Importance: HCV is a leading cause of chronic liver disease and cancer. However, how HCV induces liver cancer remains poorly understood. There is accumulating evidence that a viral cure does not eliminate the risk for HCC development. Thus, there is an unmet medical need to develop novel approaches to predict and prevent virus-induced HCC. miRNA expression is known to be deregulated in liver disease and cancer. Furthermore, miRNAs are essential for HCV replication, and HCV infection alters miRNA expression. However, how miRNAs contribute to HCV-driven pathogenesis remains elusive. Here we show that HCV induces miRNAs that may contribute to liver injury and carcinogenesis. The miR-146a-5p level was consistently increased in different cell-based models of HCV infection and in HCV patient-derived liver tissue. Furthermore, miR-146a-5p increased HCV infection. Collectively, our data are relevant to understanding viral pathogenesis and may open perspectives for novel biomarkers and prevention of virus-induced liver disease and HCC.


Figures

FIG 1
FIG 1
Persistent HCV infection modulates host cell miRNA expression in hepatocyte-like Huh7.5.1 cells. (A and B) Huh7.5.1 cells were differentiated into hepatocyte-like cells by use of 1% DMSO (14–16), persistently infected using HCVcc, and subjected to molecular analyses at 7 dpi. (A) Immunodetection of HCV E2 protein in HCV Jc1-infected hepatocyte-like cells (HCV) and noninfected controls. Nuclei were counterstained with DAPI. Representative overlay images are shown. Bars, 50 μm. (B) Modulation of miRNA expression by HCV infection. Small RNAs (19 to 24 nt) from HCV Jc1E2FLAG-infected cells (HCV) or noninfected controls were subjected to RNA-Seq (see Materials and Methods). The scatterplot shows the 72 miRNAs with significant modulation upon HCV infection compared to control cells (red dots). miR-21-5p, miR-146a-5p, and miR-143-3p, which were enriched in HCV-infected cells, are highlighted in blue. (C) HCV increases the expression of miR-21-5p, miR-146a-5p, and miR-143-3p in hepatocyte-like cells. miRNA expression was analyzed by RT-qPCR assays of total RNA extracts from HCV-infected cells compared to noninfected controls. Results are for three independent experiments. (D) HCV increases the expression of miR-21-5p, miR-146a-5p, and miR-143-3p in PHH. miRNA expression was analyzed by RT-qPCR assay of total RNA extracts from HCV Jc1-infected PHH at 3 dpi compared to noninfected controls. Results are for five independent experiments. In panels C and D, the plots show sample lower quartiles (25th percentile; bottom of the box), medians (50th percentile; horizontal line in box), and upper quartiles (75th percentile; top of the box). The bottom and top whiskers indicate the 2.5 and 97.5 percentiles, respectively. (E) miR-146a-5p expression is enhanced in liver tissues from HCV-infected patients. Liver tissues from 20 HCV-infected patients (HCV) and 9 noninfected subjects (control) were analyzed for miR-146a-5p expression by RT-qPCR. Results for different biopsy specimens are shown as individual points. Median miRNA expression is shown as a black horizontal line. (F) HCV-induced upregulation of miR-146a-5p is mediated by NF-κB in hepatocyte-like cells. Cells were pretreated with the IKK inhibitor ACHP (6.25 μM) for 24 h and subjected or not subjected to HCV infection for 5 days. Nontreated cells (control) were analyzed in parallel. miR-146a-5p expression was assessed by RT-qPCR. The plots show mean fold changes ± standard errors of the means (SEM) for 4 independent experiments. In panels C, D, and E, statistical significance is indicated as follows: *, P < 0.05; **, P < 0.01; and ***, P < 0.0001 (two-tailed Mann-Whitney test). In panel F, statistical significance is indicated as follows: *, P < 0.01; and **, P < 0.001 (one-way ANOVA).
FIG 2
FIG 2
Overexpression of miR-146a-5p does not alter proliferation and cell cycle distribution in hepatocyte-like cells. Differentiated Huh7.5.1 cells were transfected with control siRNA, a miR-146a-5p mimic, or siSTAT3. (A) Cell proliferation was assessed 24, 48, 72, and 96 h after transfection by direct cell counting. The plots show sample lower quartiles (25th percentile; bottom of the box), medians (50th percentile; horizontal line in box), and upper quartiles (75th percentile; top of the box). The bottom and top whiskers indicate the 2.5 and 97.5 percentiles, respectively. Results are for three independent experiments. *, P < 0.05; **, P < 0.01; ns, not significant (Kruskal-Wallis H test). (B) Cell cycle distribution was assessed at the different time points by flow cytometry following propidium iodide staining. Representative cell cycle profiles from one of three independent experiments are shown. 2C, cells in G0/G1 phase, with diploid DNA content; 4C, cells in G2/M phase, with tetraploid DNA content. The population of miR-146a-5p-overexpressing cells displayed a profile comparable to that of control cells. In contrast, the numbers of cells in the S and G2/M phases were markedly decreased upon knockdown of STAT3 compared with controls.
FIG 3
FIG 3
miR-146a-5p modulates the expression of genes related to liver disease. (A) Modulation of mRNA expression by miR-146a-5p in hepatocyte-like cells. Hepatocyte-like cells were reverse transfected with a miR-146a-5p mimic or a nontargeting control siRNA (5 nM) 3 days prior to total RNA extraction and analysis of mRNA expression by microarray assay. Gene expression profiles are represented by a volcano plot, where the x axis represents the log2 fold change between miR-146a-5p-transfected cells and control cells and the y axis represents the −log10 P value obtained from the F-cross test for comparing miR-146a-5p-transfected cells to control cells. Red dots represent mRNAs whose values are considered to be statistically significant (P < 0.015; FCROS method). (B) Functional network analysis of genes with modified expression after miR-146a-5p overexpression in hepatocyte-like cells. The IPA toxicity algorithm was used to assess the enrichment of deregulated genes in specific toxicity pathways with altered expression in human disease. P values indicate the significance of enrichment of the input genes for each Tox Function pathway. (C) Coregulated gene networks in miR-146a-5p-overexpressing cells. Modulation of molecular pathways by miR-146a-5p was determined by using the KEGG database and GSEA (43). Significantly enriched gene networks involved in immune responses (blue), the cell cycle and DNA repair (black), and cell metabolism (gray) are shown. Gene sets downregulated by miR-146a-5p are depicted as open circles, while gene sets upregulated by the miRNA are represented by black circles. The thickness of each connecting line is proportional to the degree of overlapping genes between two different gene sets.
FIG 4
FIG 4
Eradication of HCV infection does not restore the HCV-mediated overexpression of miR-146a-5p. Persistently HCV (Jc1E2FLAG)-infected hepatocyte-like cells were treated or not with a combination of DAAs (5 nM DCV, 1 μM SOF, and 0.5 μM SMV). Noninfected cells were analyzed as controls. (A) After 4 weeks of DAA treatment followed by 2 weeks of washout, HCV RNA loads were assessed by RT-qPCR assay of cell supernatants from HCV-infected nontreated cells (HCV) or HCV-infected DAA-treated cells (HCV + DAAs). The limit of quantification (LOQ), indicated by a dashed line, was 103 copies/ml. Results for 4 biological replicates are shown. Median HCV loads are shown as black lines. The cross indicates one sample that was HCV RNA negative. (B) miR-146a-5p expression was analyzed by RT-qPCR assay of total RNA extracts from the same samples as well as noninfected control cells. The plots show sample lower quartiles (25th percentile; bottom of the box), medians (50th percentile; horizontal line in box), and upper quartiles (75th percentile; top of the box). The bottom and top whiskers indicate the 2.5 and 97.5 percentiles, respectively. The red dashed line indicates a fold change of 1. *, P < 0.05 (two-tailed Mann-Whitney test); nd, not determined; ns, not significant.
FIG 5
FIG 5
miR-146a-5p promotes HCV infection by enhancing production of infectious viral particles. (A) miR-146a-5p does not affect HCV entry. Huh7.5.1 cells were transfected with the indicated compounds and incubated with HCVpp for 72 h. HCVpp entry was assessed by determining the intracellular luciferase activity, which was expressed in relative light units (RLU). Results represent mean percentages ± SD for three independent experiments. (B) miR-146a-5p decreases HCV RNA translation. Huh7.5.1 cells were transfected with the indicated compounds and then, 48 h later, transfected with HCV RNA (JcR2a). HCV translation was assessed by determination of the luciferase activity 4 h later. Results are shown as mean percentages ± SD for three independent experiments. (C) miR-146a-5p does not modulate HCV replication. Huh7.5.1 cells were electroporated with assembly-deficient JFH1/ΔE1E2 RNA 48 h prior to transfection with the indicated compounds. HCV replication was assessed by determination of the luciferase activity 48 h later. Results are shown as mean percentages ± SD for four independent experiments. In panels A, B, and C, the dashed lines indicate an RLU level of 100% of the control level. (D and E) miR-146a promotes HCV assembly and egress. Huh7.5.1 cells were transfected with the indicated compounds 48 h prior to infection with HCVcc (Jc1). After 4 h, the viral inoculum was removed and cells were incubated with fresh medium for 48 h. Cells were lysed to determine the intracellular HCV RNA load and infectivity (TCID50/ml). Likewise, supernatants were used to determine the extracellular HCV RNA load and infectivity. The results represent extracellular (D) and intracellular (E) HCV infectivities as fold changes compared to control-transfected cells and are for nine independent experiments. The plots show sample lower quartiles (25th percentile; bottom of the box), medians (50th percentile; horizontal line in box), and upper quartiles (75th percentile; top of the box). The bottom and top whiskers indicate the 2.5 and 97.5 percentiles, respectively. The dashed lines indicate a fold change of 1. In panels A, B, and C, statistical significance is indicated as follows: *, P < 0.001; and **, P < 0.0001 (unpaired t test with Welch's correction). In panels D and E, statistical significance is indicated as follows: *, P < 0.05; **, P < 0.01; and ***, P < 0.0001 (two-tailed Mann-Whitney test).

References

    1. Chung RT, Baumert TF. 2014. Curing chronic hepatitis C—the arc of a medical triumph. N Engl J Med 370:1576–1578. doi:10.1056/NEJMp1400986. - DOI - PubMed
    1. van der Meer AJ, Veldt BJ, Feld JJ, Wedemeyer H, Dufour JF, Lammert F, Duarte-Rojo A, Heathcote EJ, Manns MP, Kuske L, Zeuzem S, Hofmann WP, de Knegt RJ, Hansen BE, Janssen HL. 2012. Association between sustained virological response and all-cause mortality among patients with chronic hepatitis C and advanced hepatic fibrosis. JAMA 308:2584–2593. doi:10.1001/jama.2012.144878. - DOI - PubMed
    1. Szabo G, Bala S. 2013. MicroRNAs in liver disease. Nat Rev Gastroenterol Hepatol 10:542–552. doi:10.1038/nrgastro.2013.87. - DOI - PMC - PubMed
    1. Bandiera S, Pfeffer S, Baumert TF, Zeisel MB. 2015. miR-122—a key factor and therapeutic target in liver disease. J Hepatol 62:448–457. doi:10.1016/j.jhep.2014.10.004. - DOI - PubMed
    1. Jopling CL, Yi M, Lancaster AM, Lemon SM, Sarnow P. 2005. Modulation of hepatitis C virus RNA abundance by a liver-specific microRNA. Science 309:1577–1581. doi:10.1126/science.1113329. - DOI - PubMed

Publication types

MeSH terms