. 2016 Apr 27:15:45-64.
doi: 10.4137/CIN.S31809. eCollection 2016.

Immunomediated Pan-cancer Regulation Networks are Dominant Fingerprints After Treatment of Cell Lines with Demethylation

Affiliations

Immunomediated Pan-cancer Regulation Networks are Dominant Fingerprints After Treatment of Cell Lines with Demethylation

Mariama El Baroudi et al. Cancer Inform. .

Abstract

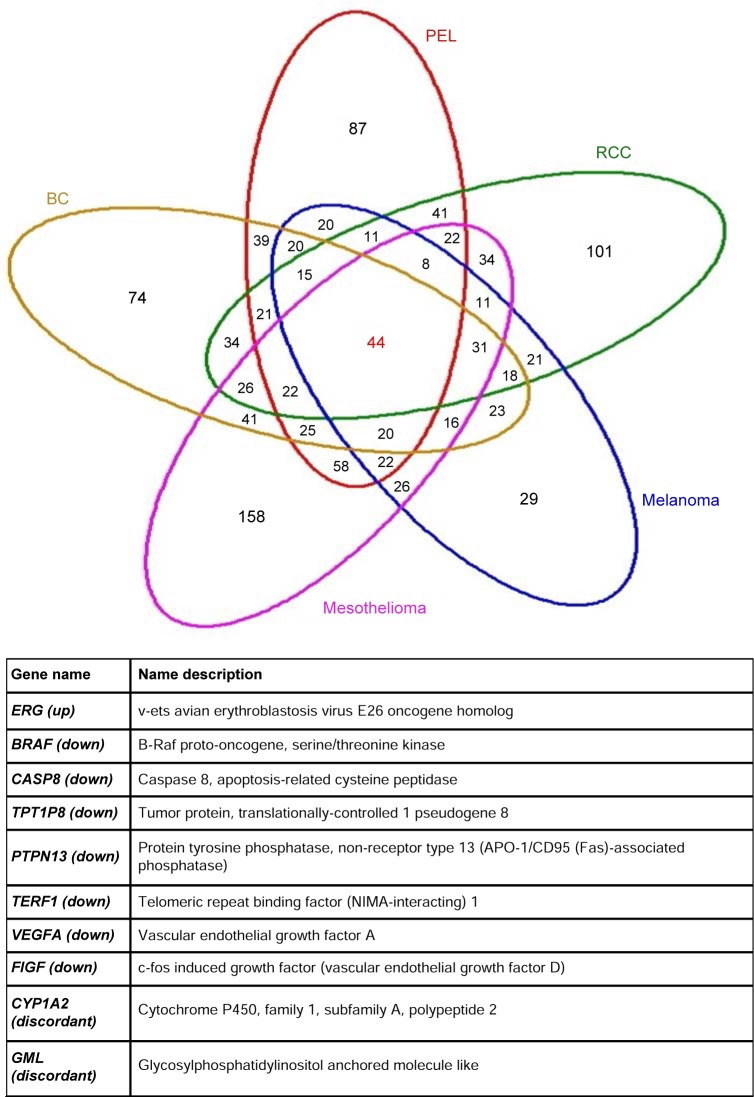
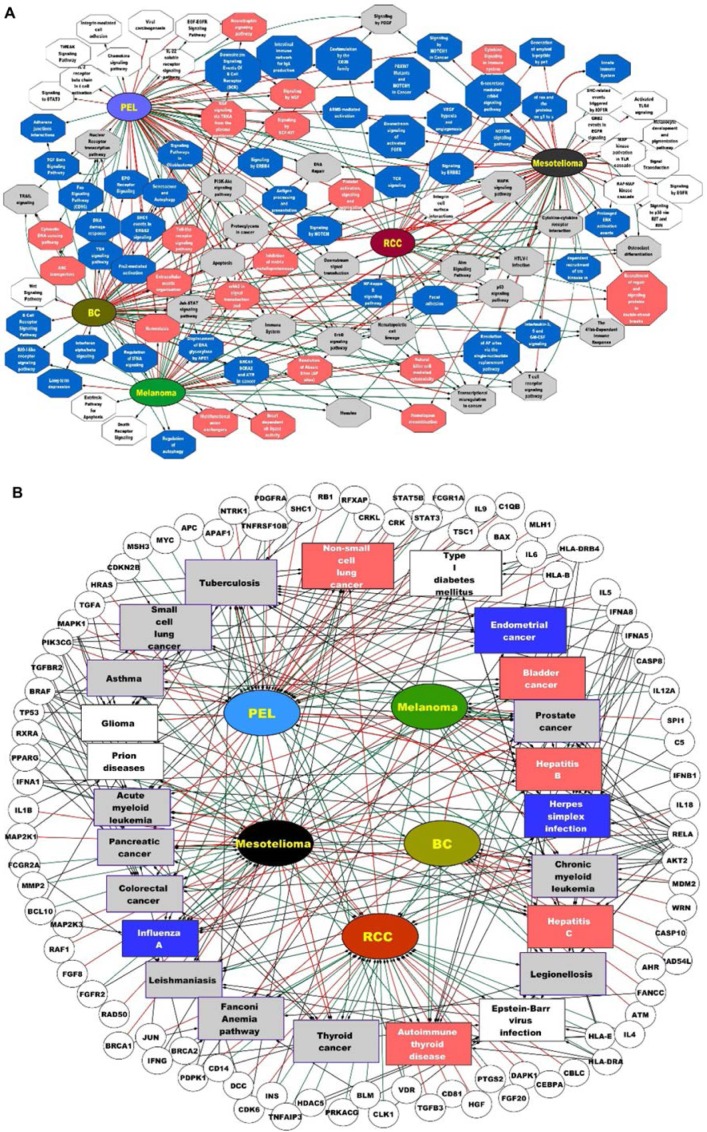
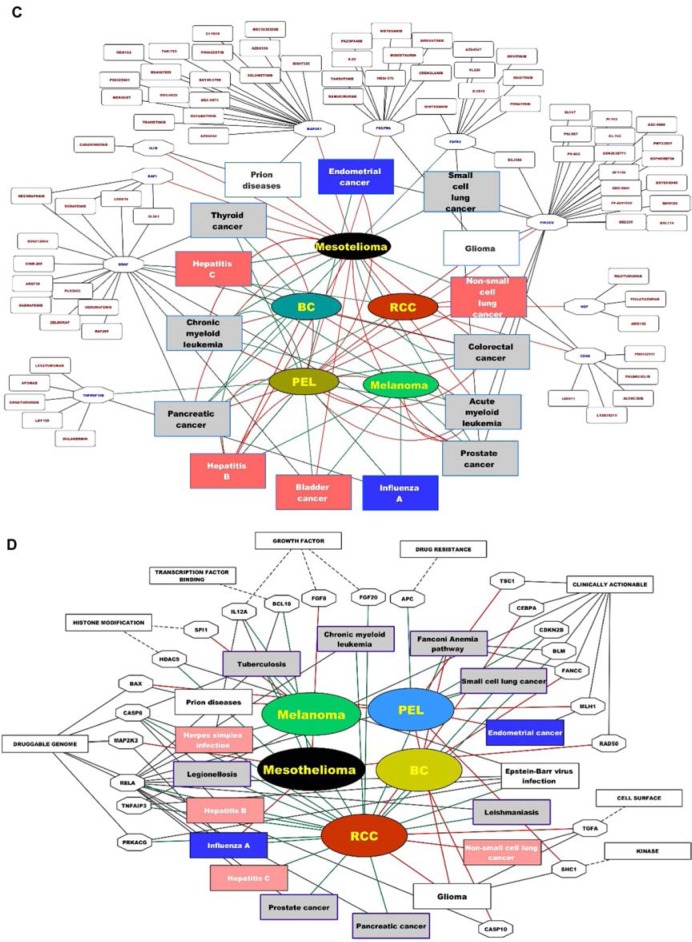
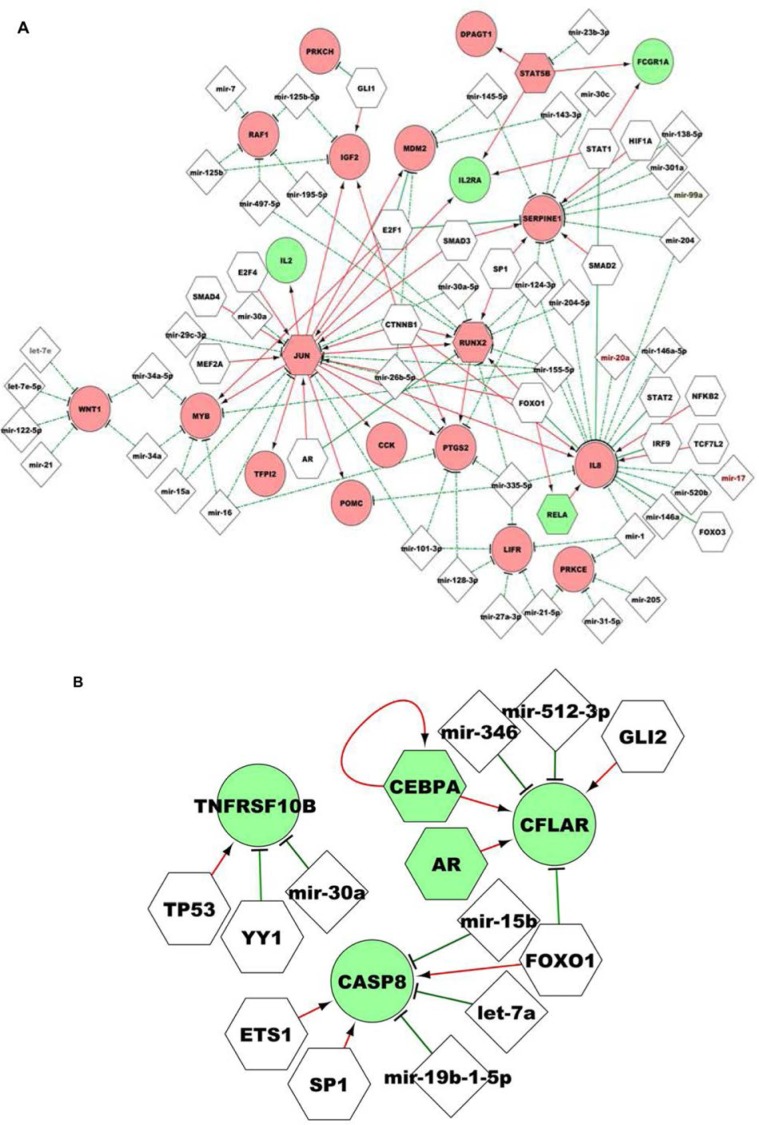
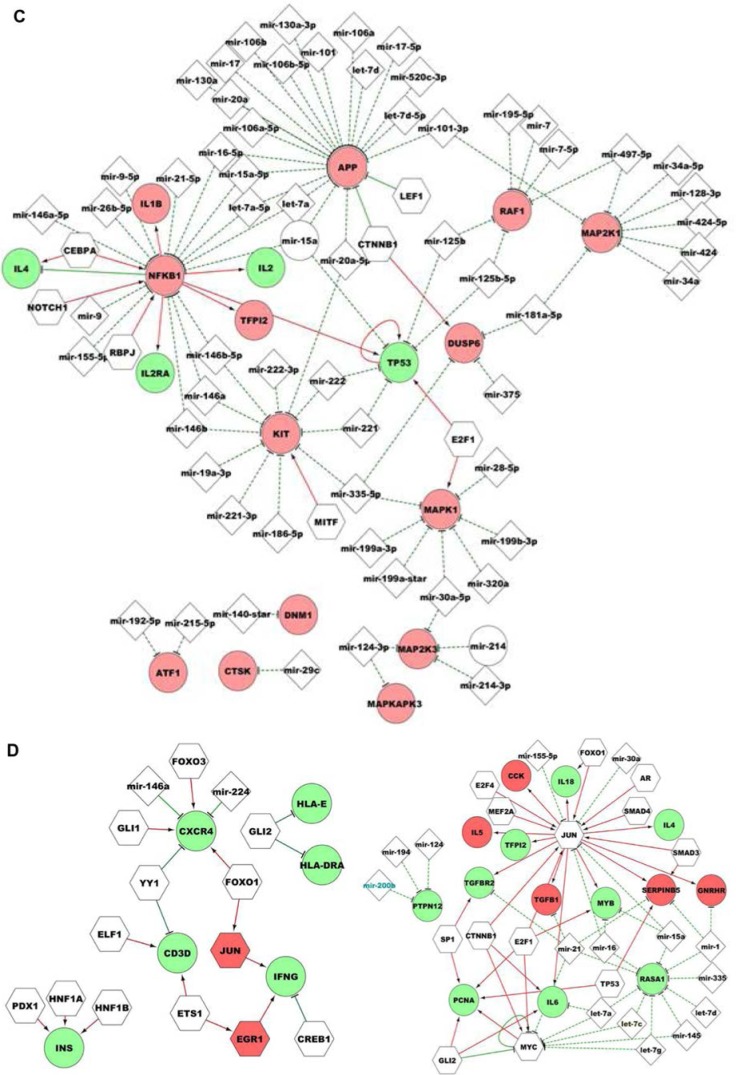
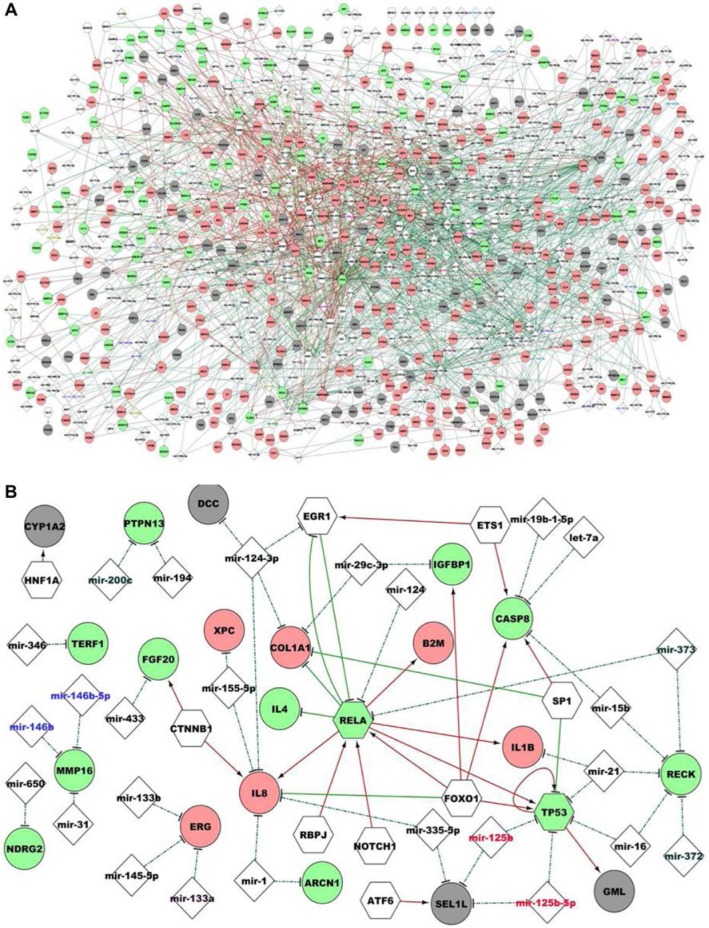
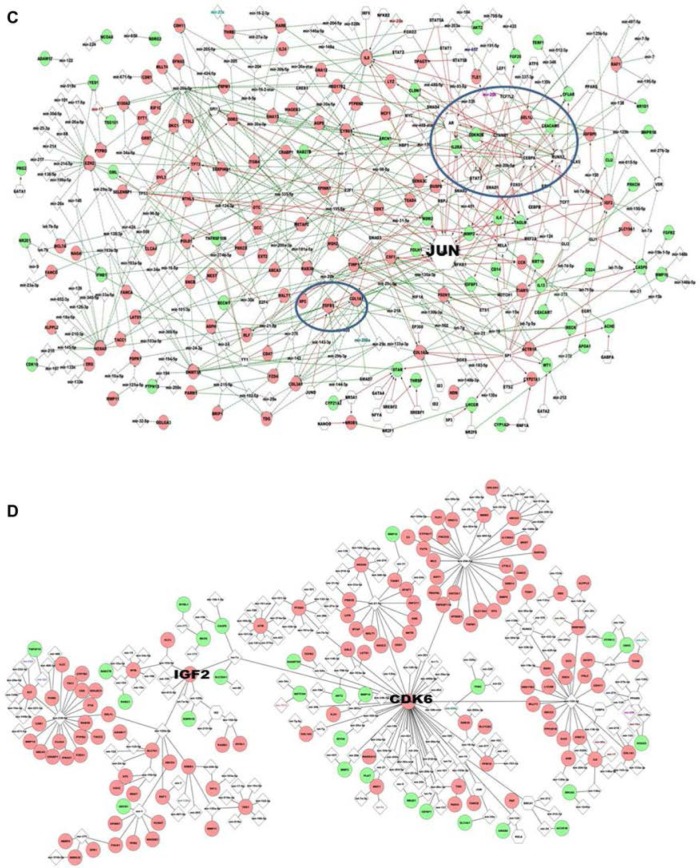
Pan-cancer studies are particularly relevant not only for addressing the complexity of the inherently observed heterogeneity but also for identifying clinically relevant features that may be common to the cancer types. Immune system regulations usually reveal synergistic modulation with other cancer mechanisms and in combination provide insights on possible advances in cancer immunotherapies. Network inference is a powerful approach to decipher pan-cancer systems dynamics. The methodology proposed in this study elucidates the impacts of epigenetic treatment on the drivers of complex pan-cancer regulation circuits involving cell lines of five cancer types. These patterns were observed from differential gene expression measurements following demethylation with 5-azacytidine. Networks were built to establish associations of phenotypes at molecular level with cancer hallmarks through both transcriptional and post-transcriptional regulation mechanisms. The most prominent feature that emerges from our integrative network maps, linking pathway landscapes to disease and drug-target associations, refers primarily to a mosaic of immune-system crosslinked influences. Therefore, characteristics initially evidenced in single cancer maps become motifs well summarized by network cores and fingerprints.

Keywords: demethylation; drug-target maps; gene networks; immunomediated regulation; pan-cancer.


Figures

Figure 1
Figure 1
Venn diagram of DEGs in the pan-cancer. Selected examples of DEGs located at the central Intersection (44 genes). Concordant down- and upregulation when the same sign occurs in the pan-cancer, otherwise regulation is discordant.
Figure 2
Figure 2
(A) Pathway landscape. The top enriched pathways (with the q-value ≤0.001) are reported for the pan-cancer. Node color indicates enrichment frequency, ie, shared pathways among down- or upregulated genes. Therefore, blue indicated two cancers sharing, red indicates three cancers sharing, and gray indicates more than three cancers sharing. Edge color represents pathways enriched among downregulated genes (green) and upregulated genes (red). The edge size indicates the DEG number enriching the pathway. (B) Pan-cancer KEGG-disease map. Node color indicates enrichment frequency, ie, shared diseases among down- or upregulated genes in the pan-cancer. Blue: shared between two cancers; Red: shared between three cancers; Gray: shared between more than three cancers. Edge color indicates regulation sign, up (red) and down (green). Black links indicate genes connecting directly to disease pathways. (C) Pan-cancer gene-drug map. Red or green edges stand for up- or downregulation in our pan-cancer, respectively. Black links target genes and drugs that refer to the source (http://www.mycancergenome.org/) integrated in DGIdb. Disease boxes show color according to previous annotations. (D) Pan-cancer druggable gene-disease map. Search categories available in DGIdb allow to find druggable DEGs that are associated with diseases, and without having a direct known drug (removing all genes appearing in the drug map). Solid edges stand for curated gene category interactions, and dashed edges stand for predicted interactions. Disease boxes show color according to previous annotations.
Figure 2
Figure 2
(A) Pathway landscape. The top enriched pathways (with the q-value ≤0.001) are reported for the pan-cancer. Node color indicates enrichment frequency, ie, shared pathways among down- or upregulated genes. Therefore, blue indicated two cancers sharing, red indicates three cancers sharing, and gray indicates more than three cancers sharing. Edge color represents pathways enriched among downregulated genes (green) and upregulated genes (red). The edge size indicates the DEG number enriching the pathway. (B) Pan-cancer KEGG-disease map. Node color indicates enrichment frequency, ie, shared diseases among down- or upregulated genes in the pan-cancer. Blue: shared between two cancers; Red: shared between three cancers; Gray: shared between more than three cancers. Edge color indicates regulation sign, up (red) and down (green). Black links indicate genes connecting directly to disease pathways. (C) Pan-cancer gene-drug map. Red or green edges stand for up- or downregulation in our pan-cancer, respectively. Black links target genes and drugs that refer to the source (http://www.mycancergenome.org/) integrated in DGIdb. Disease boxes show color according to previous annotations. (D) Pan-cancer druggable gene-disease map. Search categories available in DGIdb allow to find druggable DEGs that are associated with diseases, and without having a direct known drug (removing all genes appearing in the drug map). Solid edges stand for curated gene category interactions, and dashed edges stand for predicted interactions. Disease boxes show color according to previous annotations.
Figure 3
Figure 3
(A) BC and (B) Melanoma regulatory cores. (C) Mesothelioma, and (D) PEL (left panel) and RCC (right panel) regulatory cores. Symbols in use: node shape indicates epigenetically dysregulated genes (ellipse), TFs (hexagons), and miRNA (diamond); node color indicates DEG either up- (red) or down- (green) regulated. Node border color indicates the significantly enriched TFs (with P-value < 0.05), while the non-colored nodes correspond to TFs that regulate at least one target of the epigenetically modified genes. Then, the label color node reflects the presence of miRNA families.
Figure 3
Figure 3
(A) BC and (B) Melanoma regulatory cores. (C) Mesothelioma, and (D) PEL (left panel) and RCC (right panel) regulatory cores. Symbols in use: node shape indicates epigenetically dysregulated genes (ellipse), TFs (hexagons), and miRNA (diamond); node color indicates DEG either up- (red) or down- (green) regulated. Node border color indicates the significantly enriched TFs (with P-value < 0.05), while the non-colored nodes correspond to TFs that regulate at least one target of the epigenetically modified genes. Then, the label color node reflects the presence of miRNA families.
Figure 4
Figure 4
(A) Union of pan-cancer regulatory map. Panoramic view with symbols as before in other regulatory maps. (B) Common regulatory pan-cancer map. Intersection between individual regulatory networks. (C) Melanoma BeC. Red and green nodes for down- and upregulated genes, respectively, computed with Cytoscape plugin for Betweenness Centrality. JUN is the highest traffic hub, but a circled region is also relatively denser in crossings at some high-traffic nodes. (D) BC MST. Red and green nodes refer to down- and upregulated genes, respectively. MST computed from the R package igraph: http://cran.r-project.org/web/packages/igraph/. Other pan-cancer component networks are reported in SM. Two hubs are emphasized in yellow, IGF2 and CDK6.
Figure 4
Figure 4
(A) Union of pan-cancer regulatory map. Panoramic view with symbols as before in other regulatory maps. (B) Common regulatory pan-cancer map. Intersection between individual regulatory networks. (C) Melanoma BeC. Red and green nodes for down- and upregulated genes, respectively, computed with Cytoscape plugin for Betweenness Centrality. JUN is the highest traffic hub, but a circled region is also relatively denser in crossings at some high-traffic nodes. (D) BC MST. Red and green nodes refer to down- and upregulated genes, respectively. MST computed from the R package igraph: http://cran.r-project.org/web/packages/igraph/. Other pan-cancer component networks are reported in SM. Two hubs are emphasized in yellow, IGF2 and CDK6.

Similar articles

References

    1. Gajewski TF, Schreiber H, Fu YX. Innate and adaptive immune cells in the tumor microenvironment. Nat Immunol. 2013;14:1014–22. - PMC - PubMed
    1. Humphries F, Yang S, Wang B, Moynagh PN. RIP kinases: key decision makers in cell death and innate immunity. Cell Death Differ. 2015;22(2):225–36. - PMC - PubMed
    1. Ciriello G, Miller ML, Aksoy BA, Senbabaoglu Y, Schultz N, Sander C. Emerging landscape of oncogenic signatures across human cancers. Nat Genet. 2013;45(10):1127–33. - PMC - PubMed
    1. Kandoth C, McLellan MD, Vandin F, et al. Mutational landscape and signifi-cance across 12 major cancer types. Nature. 2013;502(7471):333–9. - PMC - PubMed
    1. Knaack SA, Siahpirani AF, Roy S. A pan-cancer modular regulatory network analysis to identify common and cancer-specific network components. Cancer Inform. 2014;13(suppl 5):69–84. - PMC - PubMed

LinkOut - more resources