General Anesthetic Conditions Induce Network Synchrony and Disrupt Sensory Processing in the Cortex
- PMID: 27147963
- PMCID: PMC4830828
- DOI: 10.3389/fncel.2016.00064
General Anesthetic Conditions Induce Network Synchrony and Disrupt Sensory Processing in the Cortex
Abstract
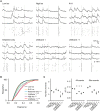
General anesthetics are commonly used in animal models to study how sensory signals are represented in the brain. Here, we used two-photon (2P) calcium activity imaging with cellular resolution to investigate how neuronal activity in layer 2/3 of the mouse barrel cortex is modified under the influence of different concentrations of chemically distinct general anesthetics. Our results show that a high isoflurane dose induces synchrony in local neuronal networks and these cortical activity patterns closely resemble those observed in EEG recordings under deep anesthesia. Moreover, ketamine and urethane also induced similar activity patterns. While investigating the effects of deep isoflurane anesthesia on whisker and auditory evoked responses in the barrel cortex, we found that dedicated spatial regions for sensory signal processing become disrupted. We propose that our isoflurane-2P imaging paradigm can serve as an attractive model system to dissect cellular and molecular mechanisms that induce the anesthetic state, and it might also provide important insight into sleep-like brain states and consciousness.
Keywords: anesthetics; cerebral cortex; genetically encoded calcium indicators; isoflurane; two-photon imaging.
Figures


Similar articles
-
Effects of urethane and isoflurane on the sensory evoked response and local blood flow in the early postnatal rat somatosensory cortex.Sci Rep. 2021 May 5;11(1):9567. doi: 10.1038/s41598-021-88461-8. Sci Rep. 2021. PMID: 33953244 Free PMC article.
-
Evoked response potential markers for anesthetic and behavioral states.Am J Physiol Regul Integr Comp Physiol. 2006 Jul;291(1):R189-96. doi: 10.1152/ajpregu.00409.2005. Epub 2006 Feb 2. Am J Physiol Regul Integr Comp Physiol. 2006. PMID: 16455771
-
General anesthesia selectively disrupts astrocyte calcium signaling in the awake mouse cortex.Proc Natl Acad Sci U S A. 2012 Nov 13;109(46):18974-9. doi: 10.1073/pnas.1209448109. Epub 2012 Oct 29. Proc Natl Acad Sci U S A. 2012. PMID: 23112168 Free PMC article.
-
[Anesthetic mechanisms revealed by functional brain imaging].Masui. 2011 May;60(5):566-73. Masui. 2011. PMID: 21626860 Review. Japanese.
-
Influence of anesthesia on cerebral blood flow, cerebral metabolic rate, and brain functional connectivity.Curr Opin Anaesthesiol. 2011 Oct;24(5):474-9. doi: 10.1097/ACO.0b013e32834a12a1. Curr Opin Anaesthesiol. 2011. PMID: 21772143 Review.
Cited by
-
Timescales of Intrinsic BOLD Signal Dynamics and Functional Connectivity in Pharmacologic and Neuropathologic States of Unconsciousness.J Neurosci. 2018 Feb 28;38(9):2304-2317. doi: 10.1523/JNEUROSCI.2545-17.2018. Epub 2018 Jan 31. J Neurosci. 2018. PMID: 29386261 Free PMC article.
-
Aberrant cortical activity, functional connectivity, and neural assembly architecture after photothrombotic stroke in mice.Elife. 2024 Apr 30;12:RP90080. doi: 10.7554/eLife.90080. Elife. 2024. PMID: 38687189 Free PMC article.
-
Spatially confined responses of mouse visual cortex to intracortical magnetic stimulation from micro-coils.J Neural Eng. 2020 Oct 23;17(5):056036. doi: 10.1088/1741-2552/abbd22. J Neural Eng. 2020. PMID: 32998116 Free PMC article.
-
Reduced excitatory neuron activity and interneuron-type-specific deficits in a mouse model of Alzheimer's disease.Commun Biol. 2022 Dec 2;5(1):1323. doi: 10.1038/s42003-022-04268-x. Commun Biol. 2022. PMID: 36460716 Free PMC article.
-
Propofol-induced Unresponsiveness Is Associated with a Brain Network Phase Transition.Anesthesiology. 2022 Mar 1;136(3):420-433. doi: 10.1097/ALN.0000000000004095. Anesthesiology. 2022. PMID: 35120195 Free PMC article.
References
-
- Bonhomme V., Boveroux P., Vanhaudenhuyse A., Hans P., Brichant J. F., Jaquet O., et al. . (2011). Linking sleep and general anesthesia mechanisms: this is no walkover. Acta Anaesthesiol. Belg. 62, 161–171. - PubMed
LinkOut - more resources
Full Text Sources
Other Literature Sources
Molecular Biology Databases

