. 2016 Apr 22:10:32.
doi: 10.3389/fncir.2016.00032. eCollection 2016.

Feed-Forward Propagation of Temporal and Rate Information between Cortical Populations during Coherent Activation in Engineered In Vitro Networks

Affiliations

Feed-Forward Propagation of Temporal and Rate Information between Cortical Populations during Coherent Activation in Engineered In Vitro Networks

Thomas B DeMarse et al. Front Neural Circuits. .

Abstract

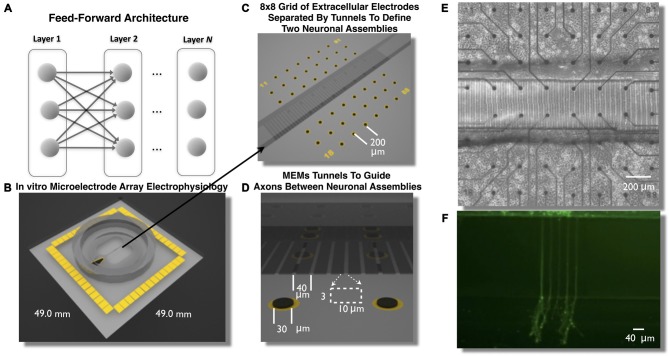
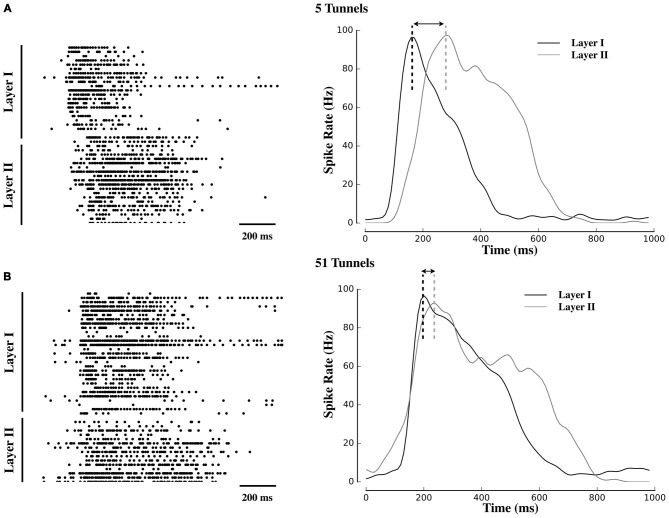
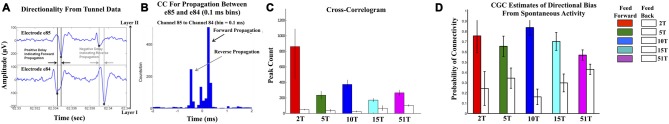
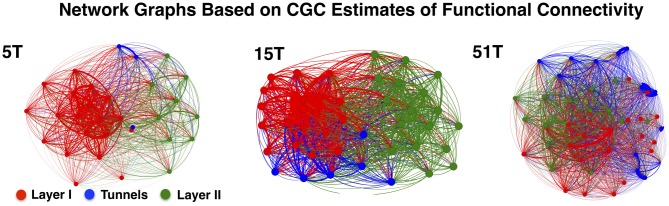
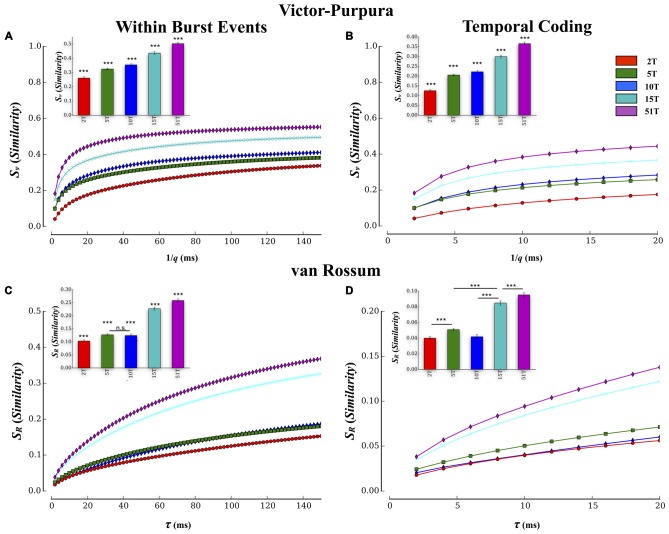
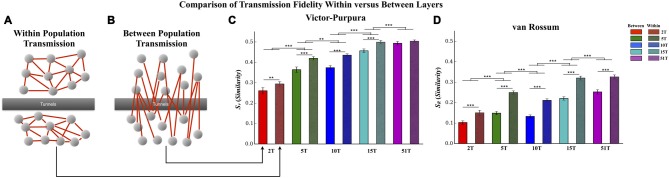
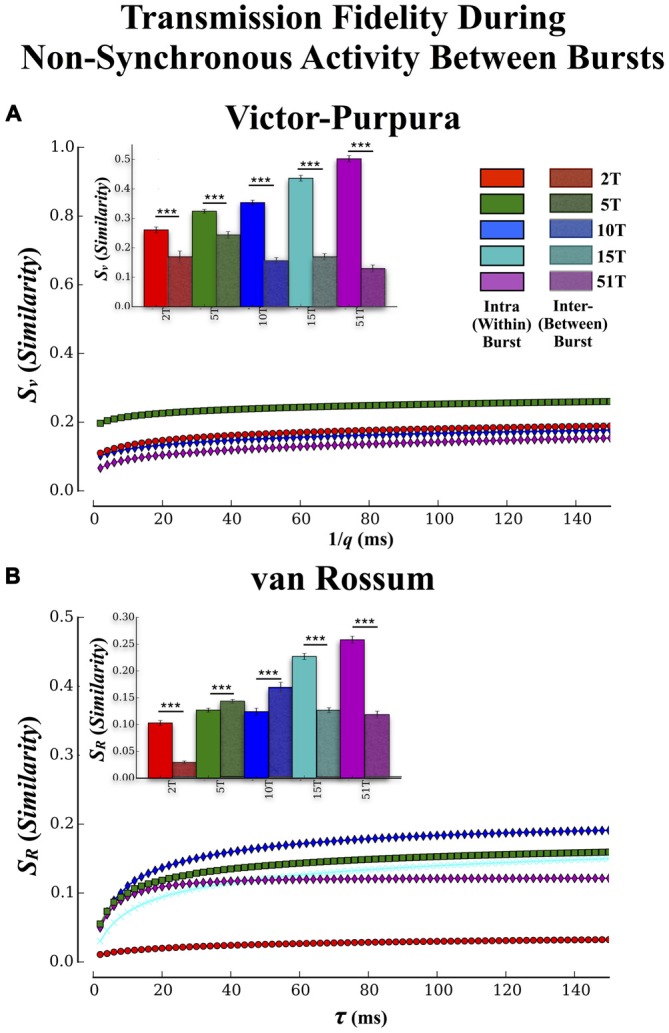
Transient propagation of information across neuronal assembles is thought to underlie many cognitive processes. However, the nature of the neural code that is embedded within these transmissions remains uncertain. Much of our understanding of how information is transmitted among these assemblies has been derived from computational models. While these models have been instrumental in understanding these processes they often make simplifying assumptions about the biophysical properties of neurons that may influence the nature and properties expressed. To address this issue we created an in vitro analog of a feed-forward network composed of two small populations (also referred to as assemblies or layers) of living dissociated rat cortical neurons. The populations were separated by, and communicated through, a microelectromechanical systems (MEMS) device containing a strip of microscale tunnels. Delayed culturing of one population in the first layer followed by the second a few days later induced the unidirectional growth of axons through the microtunnels resulting in a primarily feed-forward communication between these two small neural populations. In this study we systematically manipulated the number of tunnels that connected each layer and hence, the number of axons providing communication between those populations. We then assess the effect of reducing the number of tunnels has upon the properties of between-layer communication capacity and fidelity of neural transmission among spike trains transmitted across and within layers. We show evidence based on Victor-Purpura's and van Rossum's spike train similarity metrics supporting the presence of both rate and temporal information embedded within these transmissions whose fidelity increased during communication both between and within layers when the number of tunnels are increased. We also provide evidence reinforcing the role of synchronized activity upon transmission fidelity during the spontaneous synchronized network burst events that propagated between layers and highlight the potential applications of these MEMs devices as a tool for further investigation of structure and functional dynamics among neural populations.

Keywords: cortical networks; feed-forward networks; information transmission; multielectrode array; neural populations; neural transmission; neuronal assembly; synchrony.


Figures

Figure 1
Figure 1
Feed-Forward network architecture and in vitro microelectromechanical systems (MEMS) device for the study of neural transmission in living cortical networks. While there are many unique network topologies within the brain the feed-forward network, illustrated in (A), is commonly used as a generic model to study the properties of neural transmission of information. We created a living analog of a two-layer feed-forward network to address this issue using a polydimethylsiloxane (PDMS) MEMs device shown in (B,C). Each device was located over an array of 60 extracellular microelectrodes (C–E) to measure propagation of neural activity (action potentials) and assess the properties of neural transmission of information between neurons embedded within layers of living cortical neurons in vitro. Each layer of cortical neurons was separated by micro-scale tunnels (C–E) that permitted axonal growth between layers but prohibited soma from entering the tunnels detailed in (D). Through timed sequential plating neurons in Layer I extend neurites into Layer II (shown in F, calcien image after 3 days in vitro) we achieved directional feed-forward connectivity in a two layer feed-forward network. We then study the transmission fidelity of information encoded in spike trains during the propagation of network activity across each layer.
Figure 2
Figure 2
Delayed propagation of population bursts within decreasing number of tunnels. Raster plots and associated activity histograms during a propagating burst event from a single microelectrode array (MEA) culture in Group 5T (A) and Group 51T (B). Increasing the number of pathways decreased the delay (indicated with arrows) with which spontaneous bursts in Layer I were able to propagate into Layer II.
Figure 3
Figure 3
Confirmation of Feed-Forward functional connectivity between Layers I and II. (A,B) illustrate the computation of correlation metric (CC) in which the relative timing of spikes measured from electrode pairs (top and bottom of (A)). With an electrode separation of 200 μm and expected conduction velocities between 0.2 and 0.8 m/s (Patolsky et al., 2006), any significant peaks should appear at delays between 0.2 and 0.8 ms. In each CC spikes were accumulated in 0.1 ms bins in a window ±2 ms surrounding each spike in the reference train. (B) shows an example of the CC computed from the electrode pair 84 and 85 (column 8 and row 4) located along a tunnel in the 51T group. Forward propagation manifests as a peak in CC at positive time lags that is higher than any peaks in the reverse direction. Peaks and inferred direction were computed for each electrode-tunnel-pair in the 2T, 5T, 10T, 15T, and 51T groups and proportion of feed-forward vs. feedback connections calculated. (C) plots the results of that calculation in terms of normalized frequency of feed-forward (colored bars) vs. feedback connectivity for each group. Feed-forward connections were observed significantly more often than feedback in each group. We also computed the conditional Granger causality (CGC) metric on spike train data. (D) The results of our CGC analysis of spontaneous were consistent with those from CC with the majority of connectivity extending from neurons in Layer I into Layer II through the tunnels with low levels of feed-back.
Figure 4
Figure 4
Network graphs depicting functional connectivity based on CGC causal strength. Network graphs of three representative cultures from Groups 5T, 15T, and 51T. Each node denotes an electrode and each is colored according to the electrodes original location (Red denotes electrodes in Layer I, Green in Layer II while Blue for Tunnel data). The network layout was computed using a spring-mass (Force-directed) mapping to illustrate the difference in the functional connectivity between the coupled networks in each group. The numbers of tunnels between layers play a vital role in the modularity of the network (i.e., the number of connections a node in a single layer has with other nodes within across the layers) producing unique clusters representing each layer. These clusters begin to merge as the number of tunnels increase permitting greater connectivity and coupling between layers.
Figure 5
Figure 5
Estimates of transmission fidelity based on the Victor-Purpura and Van Rossum’s metric. Similarity estimates among spike trains provided by the Victor-Purpura and van Rossum’s metric were averaged over electrode pairs for each MEA culture producing a composite score at each level of the metric’s timescale parameter value (1/q and τR). Associated group means are shown as bar plots (inset). Increasing the number of tunnels resulted in a greater transmission fidelity between layers based on similarity estimates using Victor’s (A,B) and van Rossum’s metric (C,D). Increased fidelity was apparent at both rate (1/q > 80 ms and τR > 80 ms) and temporal scales (1/q < 20 ms and τR < 20 ms) of each measure. These estimates were conducted during periods in which bursting was actively propagating and temporally overlapped from Layer I and II. Similar results were also observed if we computed these metrics to include the entire duration of each event (i.e., start of burst in Layer I to end of burst in Layer II; ***p < 0.001).
Figure 6
Figure 6
Comparison of transmission fidelity within vs. between layers. Unlike transmission between layers where activity among one population of neurons must cross the tunnels to reach the second layer (illustrated in B), transmission within each layer (illustrated in A) would be unimpeded tunnels, should represent intrinsic wiring of the network, and might therefore produce the highest possible fidelity estimates during transmission. In fact in the majority of cases transmission fidelity was higher during measurements of within layer communication compared to communication between layers based fidelity estimates using the Victor-Purpura (C) and von Rossum metrics (D). However, we also found that increasing the number of tunnels led to an overall increase in fidelity even among the communication within each layer. This latter effect is surprising in that within layer connectivity should have been the same across the groups (Error bars represent 95% confidence intervals; **p < 0.01, ***p < 0.001).
Figure 7
Figure 7
Transmission fidelity during synchronous population bursting vs. asynchronous single unit activity outside bursts. The role synchrony may play during transmission of information among neural populations is still a matter of debate. Almost half of all activity we observed in these cultures occurred during the intervals between population wide bursts of activity. If synchronized bursting promotes information transmission then fidelity should be much higher during transmission within the bursts compared to transmission during the intervals between the bursts. (A,B) show the results of our fidelity estimates based on Victor’s and van Rossums metric, respectively for activity that occurred between bursting compared to within bursting (repeated from Figures 5A,B). Transmission fidelity was significantly degraded when it occurred in the absence of synchronous firing outside of bursts relative to inside burst events (Error bars represent 95% confidence intervals; ***p < 0.001).

Similar articles

Cited by

References

    1. Abeles M., Bergman H., Margalit E., Vaadia E. (1993). Spatiotemporal firing patterns in the frontal cortex of behaving monkeys. J. Neurophysiol. 70, 1629–1638. - PubMed
    1. Aertsen A., Diesmann M., Gewaltig M. O. (1996). Propagation of synchronous spiking activity in feedforward neural networks. J. Physiol. Paris 90, 243–247. 10.1016/s0928-4257(97)81432-5 - DOI - PubMed
    1. Ainsworth M., Lee S., Cunningham M. O., Traub R. D., Kopell N. J., Whittington M. A. (2012). Rates and rhythms: a synergistic view of frequency and temporal coding in neuronal networks. Neuron 75, 572–583. 10.1016/j.neuron.2012.08.004 - DOI - PubMed
    1. Aronov D., Reich D. S., Mechler F., Victor J. D. (2003). Neural coding of spatial phase in V1 of the macaque monkey. J. Neurophysiol. 89, 3304–3327. 10.1152/jn.00826.2002 - DOI - PubMed
    1. Axmacher N., Mormann F., Fernández G., Elger C. E., Fell J. (2006). Memory formation by neuronal synchronization. Brain Res. Rev. 52, 170–182. 10.1016/j.brainresrev.2006.01.007 - DOI - PubMed

Publication types