

Differing Patterns of Altered Slow-5 Oscillations in Healthy Aging and Ischemic Stroke
- PMID: 27148013
- PMCID: PMC4829615
- DOI: 10.3389/fnhum.2016.00156
Differing Patterns of Altered Slow-5 Oscillations in Healthy Aging and Ischemic Stroke
Abstract
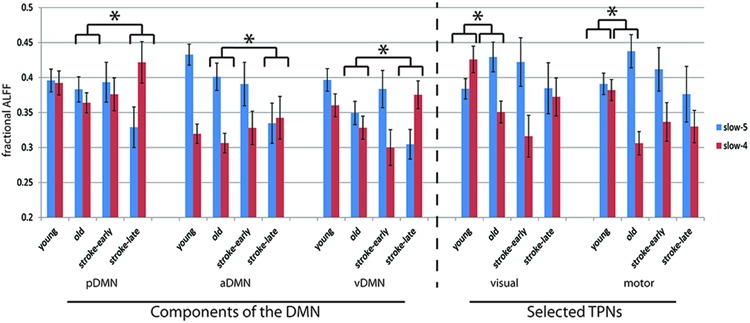
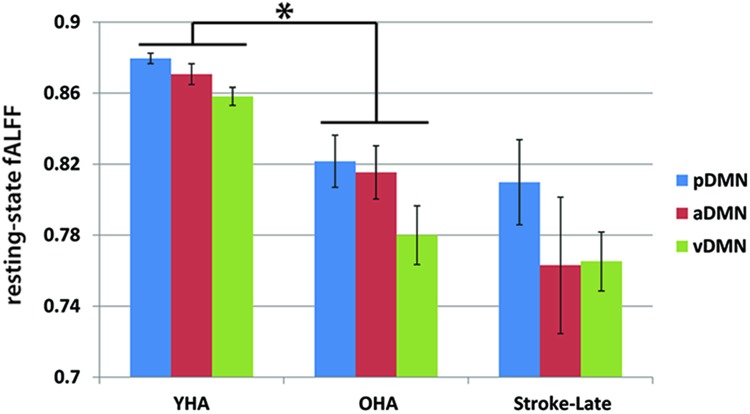
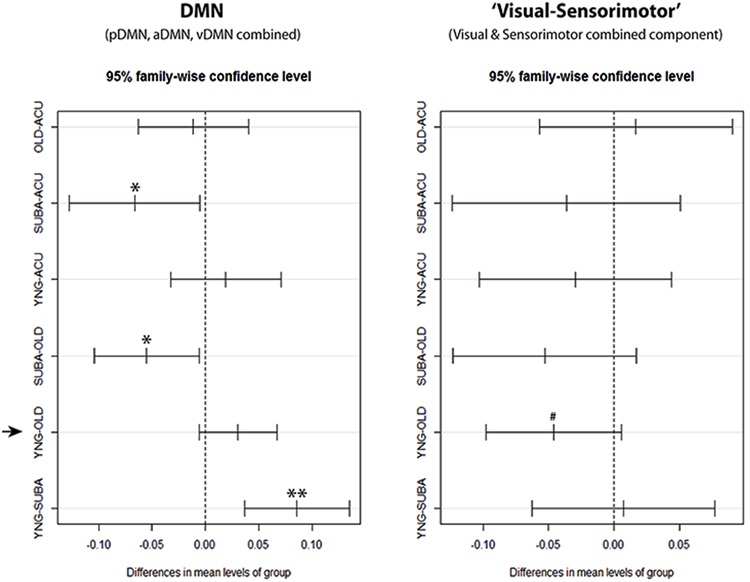
The 'default-mode' network (DMN) has been investigated in the presence of various disorders, such as Alzheimer's disease and Autism spectrum disorders. More recently, this investigation has expanded to include patients with ischemic injury. Here, we characterized the effects of ischemic injury in terms of its spectral distribution of resting-state low-frequency oscillations and further investigated whether those specific disruptions were unique to the DMN, or rather more general, affecting the global cortical system. With 43 young healthy adults, 42 older healthy adults, 14 stroke patients in their early stage (<7 days after stroke onset), and 16 stroke patients in their later stage (between 1 to 6 months after stroke onset), this study showed that patterns of cortical system disruption may differ between healthy aging and following the event of an ischemic stroke. The stroke group in the later stage demonstrated a global reduction in the amplitude of the slow-5 oscillations (0.01-0.027 Hz) in the DMN as well as in the primary visual and sensorimotor networks, two 'task-positive' networks. In comparison to the young healthy group, the older healthy subjects presented a decrease in the amplitude of the slow-5 oscillations specific to the components of the DMN, while exhibiting an increase in oscillation power in the task-positive networks. These two processes of a decrease DMN and an increase in 'task-positive' slow-5 oscillations may potentially be related, with a deficit in DMN inhibition, leading to an elevation of oscillations in non-DMN systems. These findings also suggest that disruptions of the slow-5 oscillations in healthy aging may be more specific to the DMN while the disruptions of those oscillations following a stroke through remote (diaschisis) effects may be more widespread, highlighting a non-specificity of disruption on the DMN in stroke population. The mechanisms underlying those differing modes of network disruption need to be further explored to better inform our understanding of brain function in healthy individuals and following injury.
Keywords: aging; fALFF; low-frequency oscillations; rs-fMRI; slow-5 oscillations; stroke.
Figures
Similar articles
-
Implication of the Slow-5 Oscillations in the Disruption of the Default-Mode Network in Healthy Aging and Stroke.Brain Connect. 2016 Jul;6(6):482-95. doi: 10.1089/brain.2015.0375. Brain Connect. 2016. PMID: 27130180 Free PMC article.
-
Recovery of slow-5 oscillations in a longitudinal study of ischemic stroke patients.Neuroimage Clin. 2016 Mar 17;11:398-407. doi: 10.1016/j.nicl.2016.03.008. eCollection 2016. Neuroimage Clin. 2016. PMID: 27077023 Free PMC article.
-
Frequency-Dependent Altered Functional Connections of Default Mode Network in Alzheimer's Disease.Front Aging Neurosci. 2017 Aug 3;9:259. doi: 10.3389/fnagi.2017.00259. eCollection 2017. Front Aging Neurosci. 2017. PMID: 28824420 Free PMC article.
-
Imaging the default mode network in aging and dementia.Biochim Biophys Acta. 2012 Mar;1822(3):431-41. doi: 10.1016/j.bbadis.2011.07.008. Epub 2011 Jul 23. Biochim Biophys Acta. 2012. PMID: 21807094 Review.
-
A Review of Default Mode Network Connectivity and Its Association With Social Cognition in Adolescents With Autism Spectrum Disorder and Early-Onset Psychosis.Front Psychiatry. 2020 Jun 25;11:614. doi: 10.3389/fpsyt.2020.00614. eCollection 2020. Front Psychiatry. 2020. PMID: 32670121 Free PMC article. Review.
Cited by
-
Power spectrum of spontaneous cerebral homodynamic oscillation shows a distinct pattern in autism spectrum disorder.Biomed Opt Express. 2019 Feb 22;10(3):1383-1392. doi: 10.1364/BOE.10.001383. eCollection 2019 Mar 1. Biomed Opt Express. 2019. PMID: 30891353 Free PMC article.
-
Spectral signatures of mirror movements in the sensori-motor connectivity in kallmann syndrome.Hum Brain Mapp. 2018 Jan;39(1):42-53. doi: 10.1002/hbm.23806. Epub 2017 Sep 30. Hum Brain Mapp. 2018. PMID: 28963812 Free PMC article.
-
Fractional amplitude of low-frequency fluctuations (fALFF) in post-stroke depression.Neuroimage Clin. 2017 Jul 18;16:116-124. doi: 10.1016/j.nicl.2017.07.014. eCollection 2017. Neuroimage Clin. 2017. PMID: 28794972 Free PMC article.
-
Dynamic Network Analysis Reveals Altered Temporal Variability in Brain Regions after Stroke: A Longitudinal Resting-State fMRI Study.Neural Plast. 2018 Apr 5;2018:9394156. doi: 10.1155/2018/9394156. eCollection 2018. Neural Plast. 2018. PMID: 29849574 Free PMC article.
-
Predicting language recovery in post-stroke aphasia using behavior and functional MRI.Sci Rep. 2021 Apr 19;11(1):8419. doi: 10.1038/s41598-021-88022-z. Sci Rep. 2021. PMID: 33875733 Free PMC article.
References
Grants and funding
LinkOut - more resources
Full Text Sources
Other Literature Sources