. 2016 Apr 18:8:82.
doi: 10.3389/fnagi.2016.00082. eCollection 2016.

Glucose Tightly Controls Morphological and Functional Properties of Astrocytes

Affiliations

Glucose Tightly Controls Morphological and Functional Properties of Astrocytes

Chun-Yao Lee et al. Front Aging Neurosci. .

Abstract

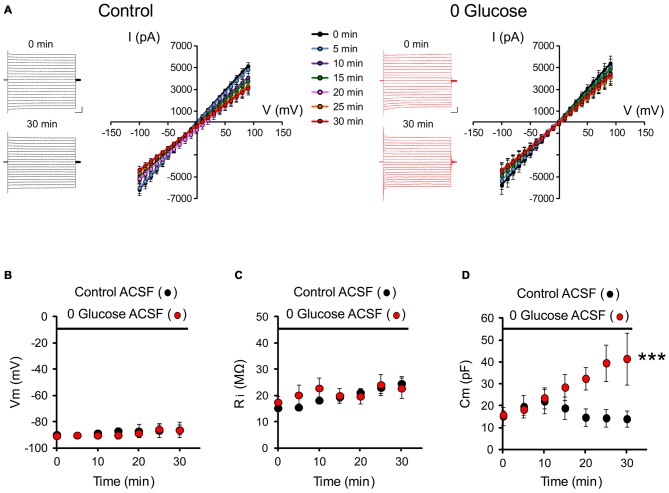
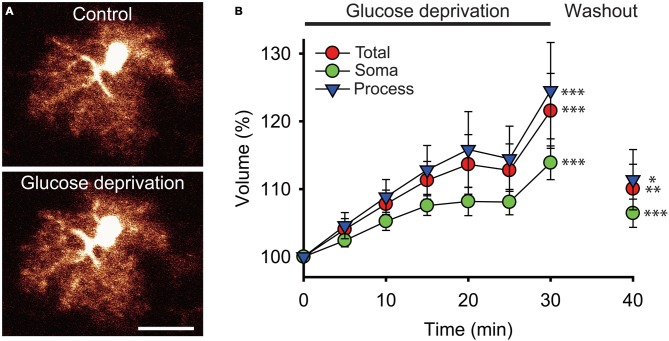
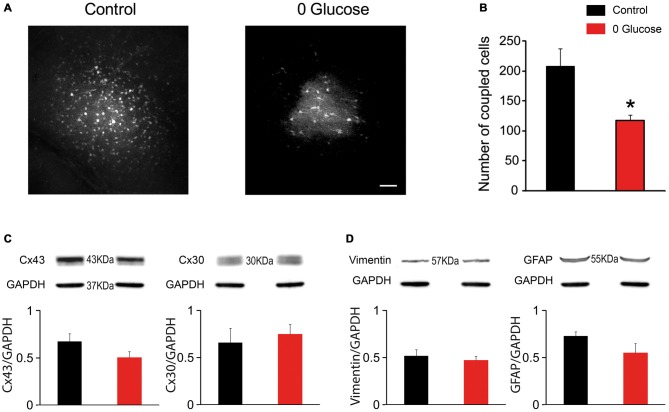
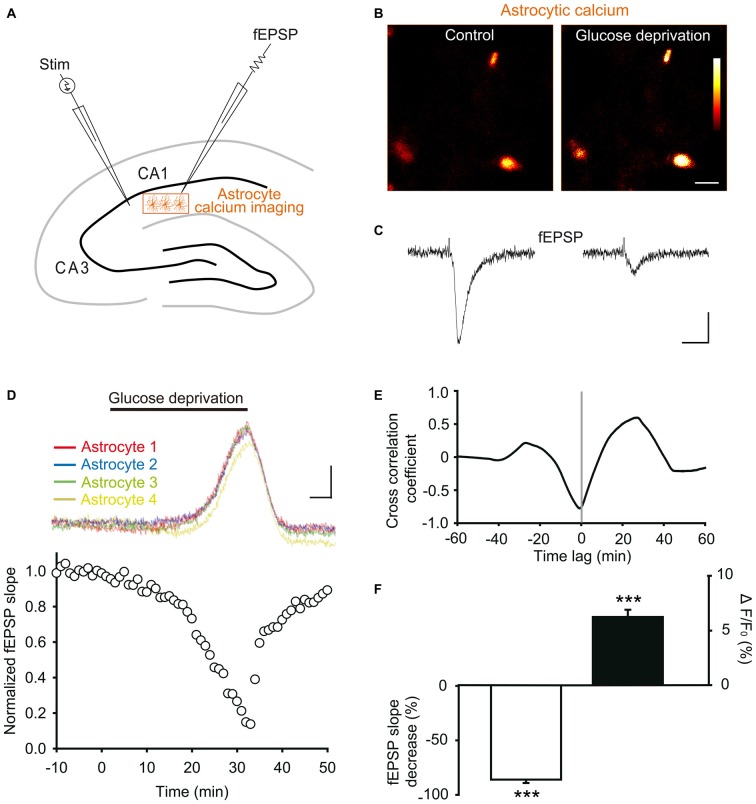
The main energy source powering the brain is glucose. Strong energy needs of our nervous system are fulfilled by conveying this essential metabolite through blood via an extensive vascular network. Glucose then reaches brain tissues by cell uptake, diffusion and metabolization, processes primarily undertaken by astrocytes. Deprivation of glucose can however occur in various circumstances. In particular, ageing is associated with cognitive disturbances that are partly attributable to metabolic deficiency leading to brain glycopenia. Despite the crucial role of glucose and its metabolites in sustaining neuronal activity, little is known about its moment-to-moment contribution to astroglial physiology. We thus here investigated the early structural and functional alterations induced in astrocytes by a transient metabolic challenge consisting in glucose deprivation. Electrophysiological recordings of hippocampal astroglial cells of the stratum radiatum in situ revealed that shortage of glucose specifically increases astrocyte membrane capacitance, whilst it has no impact on other passive membrane properties. Consistent with this change, morphometric analysis unraveled a prompt increase in astrocyte volume upon glucose deprivation. Furthermore, characteristic functional properties of astrocytes are also affected by transient glucose deficiency. We indeed found that glucoprivation decreases their gap junction-mediated coupling, while it progressively and reversibly increases their intracellular calcium levels during the slow depression of synaptic transmission occurring simultaneously, as assessed by dual electrophysiological and calcium imaging recordings. Together, these data indicate that astrocytes rapidly respond to metabolic dysfunctions, and are therefore central to the neuroglial dialog at play in brain adaptation to glycopenia.

Keywords: astrocytes; calcium; connexins; energy deprivation; glucose; hippocampus; neuroglial interactions; volume.


Figures

Figure 1
Figure 1
Glucose deprivation alters astrocyte membrane capacitance. (A) Representative traces of current-voltage relationships (IV curves) are illustrated before (0 min) and after 30 min of perfusion (30 min) with control (black traces) or 0 glucose artificial cerebrospinal fluid (ACSF; red traces). Scale bar, 2 nA, 50 ms. Mean current-voltage relationships (IV curves) recorded over 30 min are mostly unaltered by shortage of glucose (n = 8 cells, 8 slices, 4 mice) compared to control conditions (n = 7 cells, 7 slices, 5 mice, p > 0.05). (B–D) Both input resistance (Ri) and membrane potential (Vm) were indeed found to be unchanged (n = 8 cells, 8 slices, 4 mice) as compared to the control group perfused with glucose containing ACSF (n = 7 cells, 7 slices, 5 mice, p < 0.05). The only specific change in the astrocyte membrane properties during the course of glucose deprivation regards cell capacitance, which markedly increased in astrocytes exposed to glucose free (0 glucose, n = 8 cells, 8 slices, 4 mice) ACSF and not in control astrocytes exposed to regular glucose containing ACSF (n = 7 cells, 7 slices, 5 mice, p < 0.01). Asterisks indicate statistical significance (***p < 0.01).
Figure 2
Figure 2
Glucose deprivation increases astroglial volume. (A) Sample confocal images of an enhanced green fluorescent protein (eGFP) labeled hippocampal astrocyte from a glial fibrillary acidic protein (GFAP)-eGFP mouse illustrated before (Control) and after 30 min of exogenous glucose deprivation. Scale bar, 10 μm. (B) Time-dependent changes in astrocytic total (red circles), soma (green circles) and processes (blue triangles) volumes were quantified using 3D confocal morphometry analysis in each individual cell every 5 min during exogenous glucose deprivation and after 10 min of washout. Volume changes were normalized to values measured at t = 0 and expressed relative to this baseline as an increase in percentage. Glucose deprivation increased significantly all astrocytic volumes, and this effect was partially reversible after 10 min of glucose re-introduction (n = 22 cells, 10 slices, 4 mice). Asterisks indicate statistical significance (*p < 0.05, **p < 0.01, ***p < 0.001).
Figure 3
Figure 3
Glucose deficiency impairs astrocyte gap junctional coupling. (A) Sample images of gap junction-mediated biocytin coupling in CA1 stratum radiatum astrocytes from slices perfused with 30 min with control or 0 glucose ACSF. Scale bar, 50 μm. (B) Gap-junction coupling is significantly reduced following 30 min glucose deprivation, as quantified by counting the number of coupled cells following biocytin injection of a single astrocyte through a patch pipette in slices perfused with control (n = 5 slices, 3 mice) and 0 glucose ACSF (n = 5 slices, 3 mice, p < 0.05). (C–D) Western blot analysis of Cx43 and Cx30 (C), GFAP and vimentin (D) in hippocampal slices exposed to control (n = 3 mice) and glucose-free ACSF for 30 min (n = 3 mice), showing no alteration in total protein levels. Asterisks indicate statistical significance (*p < 0.05).
Figure 4
Figure 4
Glucose deprivation increases intracellular calcium levels in astrocytes. (A) Schematic depicting in a hippocampal slice dual recordings of field excitatory postsynaptic potentials (fEPSPs) evoked by Schaffer collaterals stimulation (Stim) and astroglial calcium levels. (B–C) Sample fluorescence images recorded in the orange zone shown in (A), illustrating calcium levels of stratum radiatum astrocytes detected by Fluo-4 imaging (B), and corresponding fEPSPs traces simultaneously recorded (C) before (Control) and after 30 min of glucose deprivation. Color bar: 0–255 (arbitrary fluorescence units, 8 bits resolution). Scale bars: 10 μm (B) and 0.2 mV, 20 ms (C). (D) Quantification of simultaneous relative changes in astroglial calcium levels (ΔF/F0 in 4 color coded astrocytes, upper panel) and fEPSP slope (white circles, lower panel) induced by glucose deprivation in a representative experiment. Scale bar (upper panel), 2%, 5 min. (E) Cross correlation analysis between the time series of fEPSP and astroglial calcium signals illustrated in (D). The high amplitude of the peak cross correlation coefficient (−0.78 at a time lag of −40 s) indicates a strong correlation between the two signals, where changes in fEPSP precede variations in astroglial calcium levels. (F) Quantification of mean peak relative changes in fEPSP slope and astroglial calcium levels (ΔF/F0) induced by the 30 min glucose deprivation (n = 5 cells, 5 slices, 3 mice). Asterisks indicate statistical significance (***p < 0.001).

References

    1. Abdelhafiz A. H., Rodriguez-Manas L., Morley J. E., Sinclair A. J. (2015). Hypoglycemia in older people - a less well recognized risk factor for frailty. Aging Dis. 6, 156–167. 10.14336/ad.2014.0330 - DOI - PMC - PubMed
    1. Allaman I., Belanger M., Magistretti P. J. (2011). Astrocyte-neuron metabolic relationships: for better and for worse. Trends Neurosci. 34, 76–87. 10.1016/j.tins.2010.12.001 - DOI - PubMed
    1. Anderova M., Benesova J., Mikesova M., Dzamba D., Honsa P., Kriska J., et al. . (2014). Altered astrocytic swelling in the cortex of alpha-syntrophin-negative GFAP/EGFP mice. PLoS One 9:e113444. 10.1371/journal.pone.0113444 - DOI - PMC - PubMed
    1. Andrew R. D., Lobinowich M. E., Osehobo E. P. (1997). Evidence against volume regulation by cortical brain cells during acute osmotic stress. Exp. Neurol. 143, 300–312. 10.1006/exnr.1996.6375 - DOI - PubMed
    1. Arluison M., Quignon M., Nguyen P., Thorens B., Leloup C., Penicaud L. (2004). Distribution and anatomical localization of the glucose transporter 2 (GLUT2) in the adult rat brain—an immunohistochemical study. J. Chem. Neuroanat. 28, 117–136. 10.1016/j.jchemneu.2004.05.009 - DOI - PubMed

LinkOut - more resources