

Repeated Sprint Ability in Young Basketball Players: Multi-direction vs. One-Change of Direction (Part 1)
- PMID: 27148072
- PMCID: PMC4840326
- DOI: 10.3389/fphys.2016.00133
Repeated Sprint Ability in Young Basketball Players: Multi-direction vs. One-Change of Direction (Part 1)
Abstract
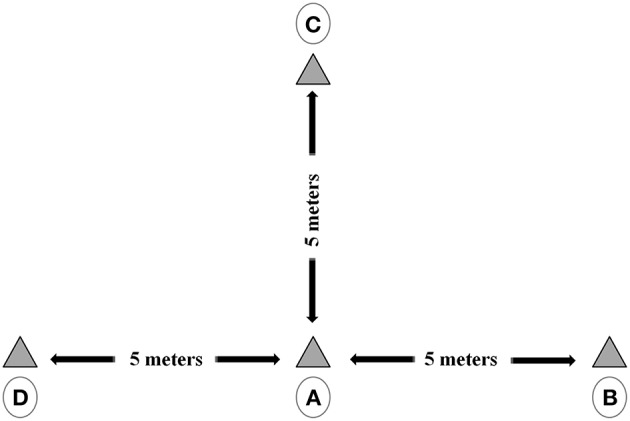
The aim of the present study was to examine the reliability of a novel multi-direction repeated sprint ability (RSA) test [RSM; 10 × (6 × 5-m)] compared with a RSA with one change of direction [10 × (2 × 15-m)], and the relationship of the RSM and RSA with Yo-Yo intermittent recovery test level 1 (Yo-Yo IR1) and jump performances [squat jump (SJ) and counter-movement-jump (CMJ)]. Thirty-six (male, n = 14, female n = 22) young basketball players (age 16.0 ± 0.9 yrs) performed the RSM, RSA, Yo-Yo IR1, SJ, and CMJ, and were re-tested only for RSM and RSA after 1 week. The absolute error of reliability (standard error of the measurement) was lower than 0.212 and 0.617-s for the time variables of the RSA and RSM test, respectively. Performance in the RSA and RSM test significantly correlated with CMJ and SJ. The best time, worst time, and total time of the RSA and RSM test were negatively correlated with Yo-Yo IR1 distance. Based on these findings, consistent with previously published studies, it was concluded that the novel RSM test was valid and reliable.
Keywords: athletic performance; physical endurance; physical fitness; shuttle running; team sport.
Figures


Similar articles
-
Multi Directional Repeated Sprint Is a Valid and Reliable Test for Assessment of Junior Handball Players.Front Physiol. 2018 Apr 4;9:317. doi: 10.3389/fphys.2018.00317. eCollection 2018. Front Physiol. 2018. PMID: 29670536 Free PMC article.
-
Repeated sprint ability in young basketball players: one vs. two changes of direction (Part 1).J Sports Sci. 2015;33(14):1480-92. doi: 10.1080/02640414.2014.992936. Epub 2014 Dec 22. J Sports Sci. 2015. PMID: 25530125
-
Repeated sprint ability in young basketball players: one vs. two changes of direction (Part 2).J Sports Sci. 2015;33(15):1553-63. doi: 10.1080/02640414.2014.996182. Epub 2015 Jan 9. J Sports Sci. 2015. PMID: 25574803
-
Linear and Change of Direction Repeated Sprint Ability Tests: A Systematic Review.J Strength Cond Res. 2023 Aug 1;37(8):1703-1717. doi: 10.1519/JSC.0000000000004447. J Strength Cond Res. 2023. PMID: 37494122
-
Physical fitness assessment in wheelchair basketball: A mini-review.Front Sports Act Living. 2022 Dec 9;4:1035570. doi: 10.3389/fspor.2022.1035570. eCollection 2022. Front Sports Act Living. 2022. PMID: 36570493 Free PMC article. Review.
Cited by
-
Training load responses to football game profile-based training (GPBT) formats: effects of locomotive demands manipulation.Biol Sport. 2022 Jan;39(1):145-155. doi: 10.5114/biolsport.2021.102919. Epub 2021 Mar 9. Biol Sport. 2022. PMID: 35173373 Free PMC article.
-
Repeated Sprint Ability in Elite Basketball Players: The Effects of 10 × 30 m Vs. 20 × 15 m Exercise Protocols on Physiological Variables and Sprint Performance.J Hum Kinet. 2021 Jan 30;77:181-189. doi: 10.2478/hukin-2020-0048. eCollection 2021 Jan. J Hum Kinet. 2021. PMID: 34168703 Free PMC article.
-
Strength and Speed Profiles Based on Age and Sex Differences in Young Basketball Players.Int J Environ Res Public Health. 2021 Jan 13;18(2):643. doi: 10.3390/ijerph18020643. Int J Environ Res Public Health. 2021. PMID: 33451144 Free PMC article.
-
A Review of Countermovement and Squat Jump Testing Methods in the Context of Public Health Examination in Adolescence: Reliability and Feasibility of Current Testing Procedures.Front Physiol. 2019 Nov 7;10:1384. doi: 10.3389/fphys.2019.01384. eCollection 2019. Front Physiol. 2019. PMID: 31787902 Free PMC article. Review.
-
The Effect of Heart Rate on Jump-Shot Accuracy of Adolescent Basketball Players.Front Physiol. 2018 Aug 3;9:1065. doi: 10.3389/fphys.2018.01065. eCollection 2018. Front Physiol. 2018. PMID: 30123140 Free PMC article.
References
-
- Attene G., Iuliano E., Di Cagno A., Calcagno G., Moalla W., Aquino G., et al. . (2015a). Improving neuromuscular performance in young basketball players: plyometric vs. technique training. J. Sports Med. Phys. Fitness. 55, 1–8. - PubMed
-
- Attene G., Pizzolato F., Calcagno G., Ibba G., Pinna M., Salernitano G., et al. . (2014). Sprint vs. intermittent training in young female basketball players. J. Sports Med. Phys. Fitness. 54, 154–161. - PubMed
LinkOut - more resources
Full Text Sources
Other Literature Sources