. 2016 Apr 20:7:459.
doi: 10.3389/fmicb.2016.00459. eCollection 2016.

Characterization of the Gut Microbiome Using 16S or Shotgun Metagenomics

Affiliations

Characterization of the Gut Microbiome Using 16S or Shotgun Metagenomics

Juan Jovel et al. Front Microbiol. .

Abstract

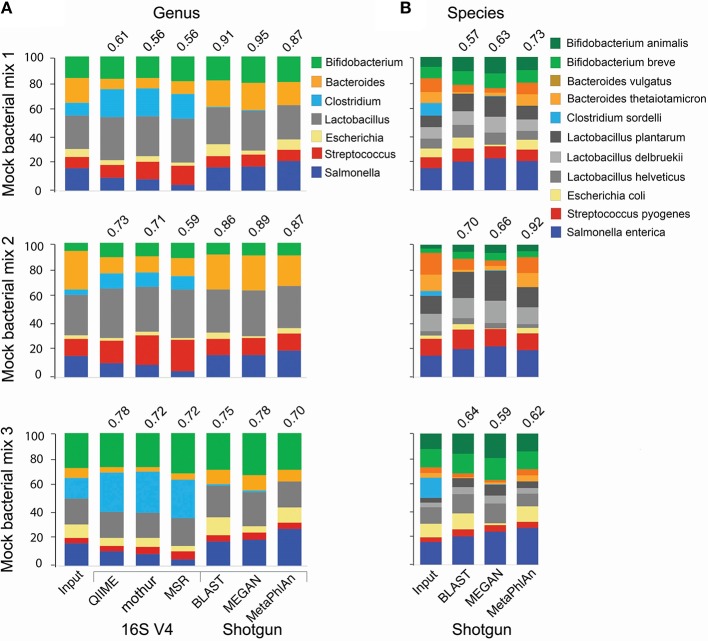
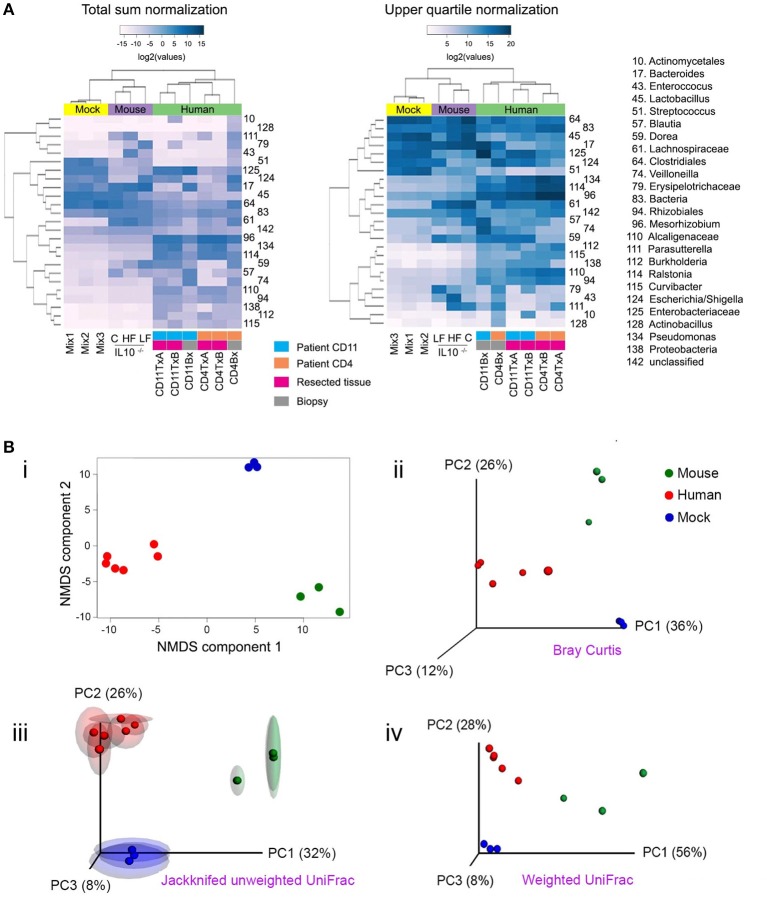
The advent of next generation sequencing (NGS) has enabled investigations of the gut microbiome with unprecedented resolution and throughput. This has stimulated the development of sophisticated bioinformatics tools to analyze the massive amounts of data generated. Researchers therefore need a clear understanding of the key concepts required for the design, execution and interpretation of NGS experiments on microbiomes. We conducted a literature review and used our own data to determine which approaches work best. The two main approaches for analyzing the microbiome, 16S ribosomal RNA (rRNA) gene amplicons and shotgun metagenomics, are illustrated with analyses of libraries designed to highlight their strengths and weaknesses. Several methods for taxonomic classification of bacterial sequences are discussed. We present simulations to assess the number of sequences that are required to perform reliable appraisals of bacterial community structure. To the extent that fluctuations in the diversity of gut bacterial populations correlate with health and disease, we emphasize various techniques for the analysis of bacterial communities within samples (α-diversity) and between samples (β-diversity). Finally, we demonstrate techniques to infer the metabolic capabilities of a bacteria community from these 16S and shotgun data.

Keywords: 16S rRNA gene sequencing; bioinformatics; diversity analysis; functional profiling; gut microbiome; shotgun metagenomics; taxonomic classification.


Figures

Figure 1
Figure 1
Comparison of taxonomic analyses of a low complexity artificial microbial population using 16S amplicon or shotgun metagenomic approaches. Eleven bacterial species (representing 7 genera) were cultured under standard laboratory conditions. DNA was extracted using the FastDNA spin kit for feces (MPBio). 16S amplicon and shotgun metagenomics libraries were constructed using the NEXTflex 16S V4 Amplicon-Seq (BioO Scientific) and the Nextera XT (Illumina) kits, respectively. Libraries were paired-end sequenced on a MiSeq sequencer using a 500-cycle kit. For 16S libraries, sequences were trimmed with the “split_fastq_libraries.py” script from QIIME. Default parameters were used, with the exception that the quality threshold for trimming was raised to 30. PCR primer sequences were trimmed with in-house Perl scripts. Shotgun metagenomics libraries were trimmed with the fastqMcf tool, and a quality threshold of 15. The relative abundance of each species was determined with the software indicated at the bottom of the bar graph, using default parameters, at the genus (A) or species (B) levels. The Pearson correlation coefficient between the expected (Input) relative abundance and the classification performed by each program is indicated on top of the bar graph.
Figure 2
Figure 2
Precision of taxonomy assignments is affected by highly similar sequences in different taxa. (A) For the 16S libraries described in Figure 1, sequences were clustered into operational taxonomic units (OTUs) using a 97% similarity threshold and taxonomy assignments were performed with the RDP classifier. Sequences from OTUs classified as Bifidobacterium (n = 3), Agrobacterium (n = 3), Streptococcus (n = 3), Lactobacillus (n = 3), Bacteroides (n = 3), Peptostreptococcaceae (n = 4), or Enterobacteriaceae (n = 9) were randomly extracted and aligned to the Greengenes database to extract the closest relative (best hit). In addition, we included Greengenes 16S rRNA gene sequences (in green) from Clostridium difficile and C. botulinum as reference for Peptostreptococcaceae and Citrobacter freundii and Enterobacter cloacae as reference for Enterobacteriaceae. The V4 region of the 16S rRNA gene was cropped from the Greengenes sequences to construct a phylogenetic tree with MEGA-6, using UPGMA hierarchical clustering and 10,000 bootstraps. (B) Sequences from our bacterial populations in Figure 1 were aligned against the NCBI nt and human microbiome project (HMP) databases to identify the most similar reference genome. For each bacterium, a simulated library was created by segmenting the reference genome sequence into 500 nt stretches (250 nt paired ends in a head-to-tail orientation), iterating the process to generate ~1.5 million sequences. This simulated library was aligned back to the reference genome and the taxonomy resolved with MEGAN5. As examples, we show the reads classification of Bifidobacterium breve, Bacteroides thetaiotamicron, and Escherichia coli, which accumulated a large proportion of reads that could be resolved at the species, genus or family levels, respectively. Color-matched bars on the right show the proportion of reads accumulated at each level for these particular examples. S, species; G, genus; F, family; O, order; C, class; P, phylum.
Figure 3
Figure 3
Number of sequences required for taxonomic classification of samples with varying diversity. A series of samples were chosen to assess the effect of library complexity on the accuracy of taxonomy assignments and estimation of diversity of bacterial populations. Kefir represents the lowest point in the bacterial diversity spectrum, followed by a patient affected by Crohn's disease (CD), another one recovered from C. difficile infection (C. diff), a healthy individual (Hthy1) and three artificial mixes of bacteria (Mix7-9). (A,B) Libraries were randomly sampled at depths of 500, 1000, 5000, 10,000, 50,000 and 100,000 reads. End1 16S rRNA gene sequences were classified with QIIME using the closed reference method to cluster OTUs and a similarity threshold of 97%. Paired-end shotgun metagenomics sequences were aligned with LAST and taxonomically classified with MEGAN5. Each random sampling was repeated 20 times. As an example, the relative abundance of taxa for one of these samplings at a depth of 1000 or 50,000 sequences is presented for 16S and shotgun metagenomics libraries. A white asterisk indicates a group of bacterial sequences identified as Citrobacter in the shotgun panel and Klebsiella in the 16S panel. Bifidobacterium is indicated with a white plus sign. Propionibacterium is indicated with a white circle. (C,D) For each taxa detected and for each random sample, the proportion error was calculated as the difference between the proportion that each taxon represented in the whole library (i.e., with the maximum number of reads) and in the random sample. This difference was weighted by the proportion that each taxon represented in the whole library. We present the arithmetic mean of all weighted differences for each of the 20 random samples.
Figure 4
Figure 4
Popular techniques for inspection and quantification of beta diversity. (A) Heatmap of normalized counts for the 50 most abundant taxa. On top of the heatmap, group of samples are color-coded. Lilac (Mouse): mutant IL-10−∕− mice that were fed with either high fat (HF), conventional chow (C) or low fat (LF) diet. Yellow (Mock): the three mock bacteria populations described in Figure 1. Light green (Human): samples from two patients suffering Crohn's disease (CD4 and CD11), including resections samples from the terminal ileum at the time of surgery (run in duplicate [A,B]) and biopsies taken 6 months after surgery. (B) Non-metrical multidimensional scaling (NMDS) and Principal Coordinates Analysis (PCoA). Upper panel: Bray-Curtis dissimilarities were ordinated and plotted by either NMDS (i) or PCoA (ii). Lower panel: Unweighted (iii) or weighted (iv) UniFrac distances were analyzed and plotted by PCoA. For unweighted distances, jackknife resampling was performed and the spheres represent the average of such process while semitransparent ellipsoids represent the variance between repeats. Mix1-3 are described in the legend for Figure 1; IL10−∕−C: IL10 deficient mice fed with conventional chow diet; IL10−∕−HF: as previous one, but fed with high fat diet; IL10−∕−LF: as previous one but fed with low fat diet; CD11TxA: Patient 11 affected with Crohn's disease, tissue sample from ileocolic resection, repeat (A); CD11TxB: as previous one, repeat (B). CD11Bx: Biopsy from patient 11 colon, 6 months after resection. CD4TxA: Patient 4 affected with Crohn's disease, tissue sample from ileocolic resection, repeat (A); CD4TxB: as previous one, repeat (B). CD4Bx: Biopsy from patient 4 colon, 6 months after resection.
Figure 5
Figure 5
Inference of gut bacterial microbiome functional content from 16S or shotgun metagenomics libraries. Samples from three healthy individuals (Hthy1-3), the CD and the C. diff samples described in Figure 3, and the three mice samples described in Figure 4 were used here to illustrate metabolic inference of the gut bacteria microbiome from 16S or shotgun metagenomic libraries. High quality sequences were procured as described in Figure 1. (A) Twenty-three KEGG reference pathways known to be present in bacteria are depicted for both types of libraries. (B) Two KEGG pathways are illustrated at the gene (KEGG orthology, KO, groups) level. On top of each heatmap pair, the Pearson correlation coefficient for relative abundance of KOs derived with each method is presented. Inference of the functional content of the 16S metagenome was performed with PICRUSt, while gene content of shotgun metagenomic libraries was determined with MEGAN5. PICRUSt outputs results in number of bacteria cells that encode a gene (KO) while MEGAN5 outputs counts of sequences that mapped to a KO representative sequence. To make results from both methods comparable, counts were normalized by total sum. In both cases, the results represent the abundance of each KO as a fraction of the abundance of all detected KOs in each library. In order to achieve full representation of all values included in each normalized count table, colors in each heatmap were stretched between the minimum and maximum values. Therefore, the intensity (value) of each cell is not comparable between methods (16S of shotgun). Instead the Pearson correlation coefficient is shown as an estimator of the concordance of results provided by both approaches.

Similar articles

Cited by

References

    1. Abubucker S., Segata N., Goll J., Schubert A. M., Izard J., Cantarel B. L., et al. . (2012). Metabolic reconstruction for metagenomic data and its application to the human microbiome. PLoS Comput. Biol. 8:e1002358. 10.1371/journal.pcbi.1002358 - DOI - PMC - PubMed
    1. Aho A., Hopcroft J., Ullman J. (1973). On finding lowest common ancestors in trees, in Proc. 5th ACM Symp. Theory of Computing (STOC), (New York, NY: ACM; ), 253–265.
    1. Antharam V. C., Li E. C., Ishmael A., Sharma A., Mai V., Rand K. H., et al. . (2013). Intestinal dysbiosis and depletion of butyrogenic bacteria in Clostridium difficile infection and nosocomial diarrhea. J. Clin. Microbiol. 51, 2884–2892. 10.1128/JCM.00845-13 - DOI - PMC - PubMed
    1. Aronesty E. (2011). Command-Line Tools for Processing Biological Sequencing Data ea-utils. Expression Analysis. Durham, NC: Available online at: http://code.google.com/p/ea-utils
    1. Arslan N. (2014). Obesity, fatty liver disease and intestinal microbiota. World J. Gastroenterol. 20, 16452–16463. 10.3748/wjg.v20.i44.16452 - DOI - PMC - PubMed