

Individuality, Stability, and Variability of the Plaque Microbiome
- PMID: 27148241
- PMCID: PMC4840391
- DOI: 10.3389/fmicb.2016.00564
Individuality, Stability, and Variability of the Plaque Microbiome
Abstract
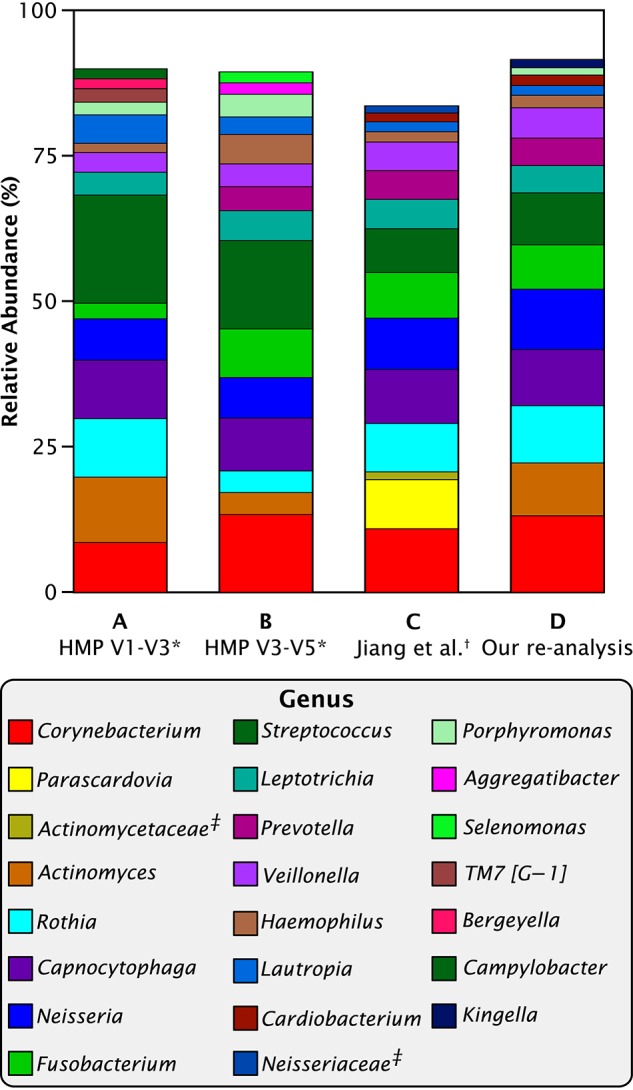
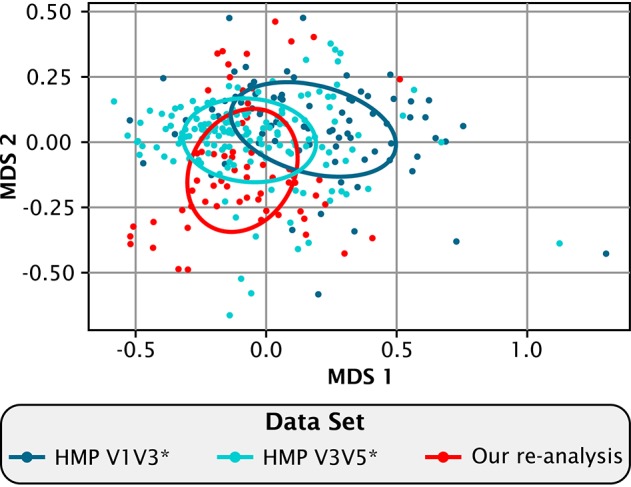
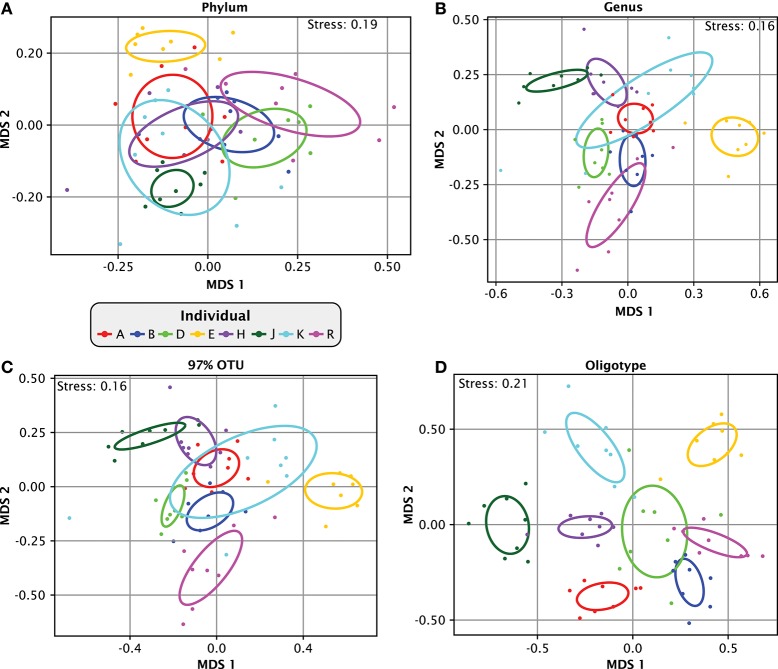
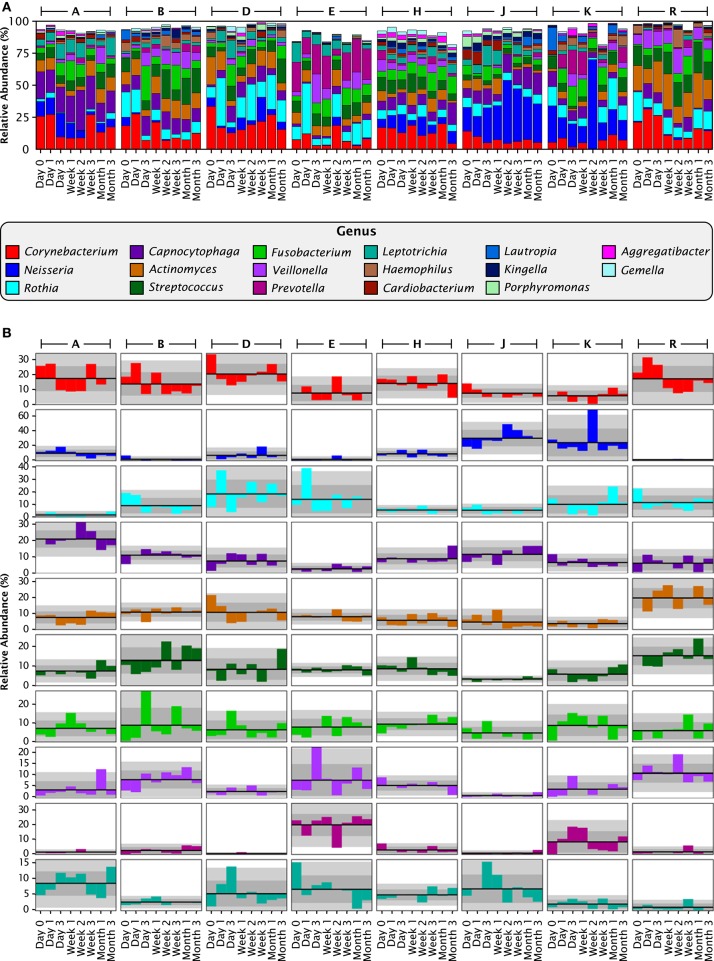
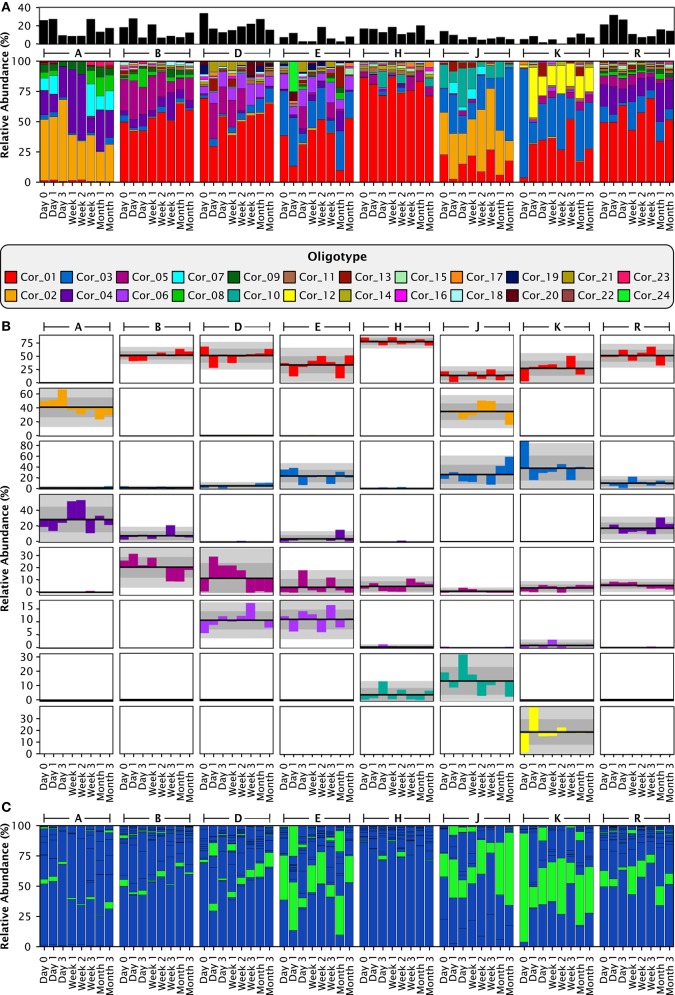
Dental plaque is a bacterial biofilm composed of a characteristic set of organisms. Relatively little information from cultivation-independent, high-throughput analyses has been published on the temporal dynamics of the dental plaque microbiome. We used Minimum Entropy Decomposition, an information theory-based approach similar to oligotyping that provides single-nucleotide resolution, to analyze a previously published time series data set and investigate the dynamics of the plaque microbiome at various analytic and taxonomic levels. At both the genus and 97% Operational Taxonomic Unit (OTU) levels of resolution, the range of variation within each individual overlapped that of other individuals in the data set. When analyzed at the oligotype level, however, the overlap largely disappeared, showing that single-nucleotide resolution enables differentiation of individuals from one another without ambiguity. The overwhelming majority of the plaque community in all samples was made up of bacteria from a moderate number of plaque-typical genera, indicating that the overall community framework is shared among individuals. Each of these genera fluctuated in abundance around a stable mean that varied between individuals, with some genera having higher inter-individual variability than others. Thus, at the genus level, differences between individuals lay not in the identity of the major genera but in consistently differing proportions of these genera from mouth to mouth. However, at the oligotype level, we detected oligotype "fingerprints," a highly individual-specific set of persistently abundant oligotypes fluctuating around a stable mean over time. For example, within the genus Corynebacterium, more than a dozen oligotypes were detectable in each individual, of which a different subset reached high abundance in any given person. This pattern suggests that each mouth contains a subtly different community of organisms. We also compared the Chinese plaque community characterized here to previously characterized Western plaque communities, as represented by analyses of data emerging from the Human Microbiome Project, and found no major differences between Chinese and Western supragingival plaque. In conclusion, we found the plaque microbiome to be highly individualized at the oligotype level and characterized by stability of community membership, with variability in the relative abundance of community members between individuals and over time.
Keywords: 16S rRNA; community dynamics; community ecology; human microbiome; oral microbiota.
Figures
Similar articles
-
Dynamics of tongue microbial communities with single-nucleotide resolution using oligotyping.Front Microbiol. 2014 Nov 7;5:568. doi: 10.3389/fmicb.2014.00568. eCollection 2014. Front Microbiol. 2014. PMID: 25426106 Free PMC article.
-
Oligotyping analysis of the human oral microbiome.Proc Natl Acad Sci U S A. 2014 Jul 15;111(28):E2875-84. doi: 10.1073/pnas.1409644111. Epub 2014 Jun 25. Proc Natl Acad Sci U S A. 2014. PMID: 24965363 Free PMC article.
-
The impact of various time intervals on the supragingival plaque dynamic core microbiome.PLoS One. 2015 May 5;10(5):e0124631. doi: 10.1371/journal.pone.0124631. eCollection 2015. PLoS One. 2015. PMID: 25942317 Free PMC article.
-
Inter-Individual Differences in the Oral Bacteriome Are Greater than Intra-Day Fluctuations in Individuals.PLoS One. 2015 Jun 29;10(6):e0131607. doi: 10.1371/journal.pone.0131607. eCollection 2015. PLoS One. 2015. PMID: 26121551 Free PMC article.
-
Personalized microbiome dynamics - Cytometric fingerprints for routine diagnostics.Mol Aspects Med. 2018 Feb;59:123-134. doi: 10.1016/j.mam.2017.06.005. Epub 2017 Jul 8. Mol Aspects Med. 2018. PMID: 28669592 Review.
Cited by
-
Structure and co-occurrence patterns of bacterial communities associated with white faeces disease outbreaks in Pacific white-leg shrimp Penaeus vannamei aquaculture.Sci Rep. 2020 Jul 20;10(1):11980. doi: 10.1038/s41598-020-68891-6. Sci Rep. 2020. PMID: 32686764 Free PMC article.
-
The impact of skin care products on skin chemistry and microbiome dynamics.BMC Biol. 2019 Jun 12;17(1):47. doi: 10.1186/s12915-019-0660-6. BMC Biol. 2019. PMID: 31189482 Free PMC article.
-
The Impact of Maltitol-Sweetened Chewing Gum on the Dental Plaque Biofilm Microbiota Composition.Front Microbiol. 2018 Mar 6;9:381. doi: 10.3389/fmicb.2018.00381. eCollection 2018. Front Microbiol. 2018. PMID: 29559963 Free PMC article.
-
Defining the resilience of the human salivary microbiota by a 520-day longitudinal study in a confined environment: the Mars500 mission.Microbiome. 2021 Jun 30;9(1):152. doi: 10.1186/s40168-021-01070-5. Microbiome. 2021. PMID: 34193273 Free PMC article.
-
Consumer Safety Considerations of Skin and Oral Microbiome Perturbation.Clin Microbiol Rev. 2019 Jul 31;32(4):e00051-19. doi: 10.1128/CMR.00051-19. Print 2019 Sep 18. Clin Microbiol Rev. 2019. PMID: 31366612 Free PMC article. Review.
References
Grants and funding
LinkOut - more resources
Full Text Sources
Other Literature Sources