. 2016 May 5;7(5):e2215.
doi: 10.1038/cddis.2016.113.

Clusterin facilitates apoptotic cell clearance and prevents apoptotic cell-induced autoimmune responses

Affiliations

Clusterin facilitates apoptotic cell clearance and prevents apoptotic cell-induced autoimmune responses

P Cunin et al. Cell Death Dis. .

Abstract

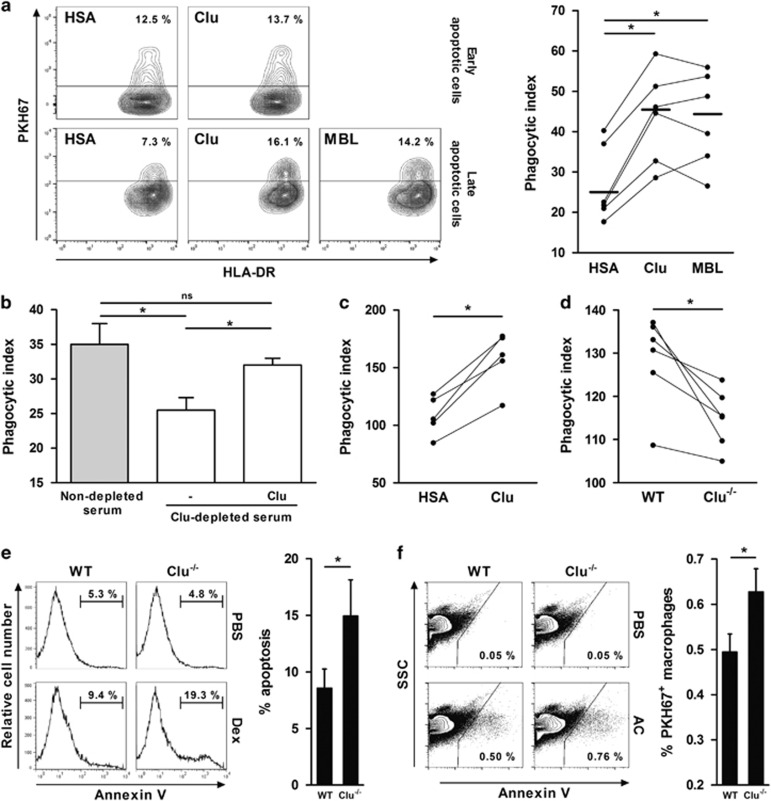
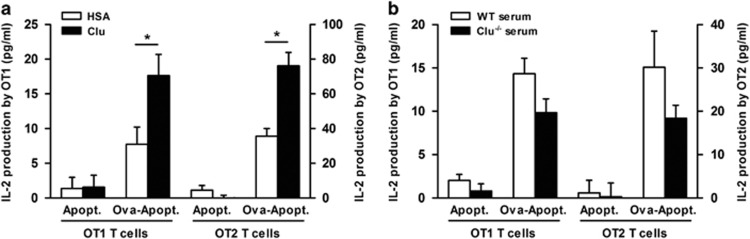
Clusterin (Clu), an extracellular chaperone, exhibits characteristics of soluble innate immunity receptors, as assessed by its ability to bind some bacteria strains. In this study, we report that Clu also binds specifically to late apoptotic cells but not to live, early apoptotic, or necrotic cells. Histones, which accumulate on blebs during the apoptotic process, represent privileged Clu-binding motifs at the surface of late apoptotic cells. As a consequence, Clu potentiates, both in vitro and in vivo, the phagocytosis of late apoptotic cells by macrophages. Moreover, the increased phagocytosis of late apoptotic cells induced by Clu favors the presentation and cross-presentation of apoptotic cell-associated antigens. Finally, we observed that, in a model of apoptotic cell-induced autoimmunity, and relative to control mice, Clu(-/-) mice develop symptoms of autoimmunity, including the generation of anti-dsDNA antibodies, deposition of immunoglobulins and complement components within kidneys, and splenomegaly. These results identify Clu as a new molecule partner involved in apoptotic cell efferocytosis and suggest a protective role for Clu in inflammation and autoimmune diseases.


Figures

Figure 1
Figure 1
Clu binds to late apoptotic cells. (a) Left panel, analysis of spontaneous apoptosis of human neutrophils after culture in 1% FCS culture medium and staining with PI and APC-labeled Ann V. Flow cytometry analysis allowed to identify four populations corresponding to viable (Ann V PI; R1), early apoptotic (Ann V+ PI; R2), late apoptotic (Ann V+ PI+; R3), and necrotic cells (Ann V+/− PIhigh; R4), respectively. Middle panels, dying neutrophils were incubated or not with 1 μM OG-Clu; the binding of Clu to R1–R4 populations was evaluated by flow cytometry. Right panel, binding of OG-Clu to heat-induced necrotic neutrophils. Results are representative of five independent experiments. (b) Neutrophils, at different apoptosis stages (R1–R4), were incubated with 1 μM OG-HSA, OG-Clu, OG-rClu, or OG-C1q. Binding was analyzed by flow cytometry. Results are expressed in MFI values, mean±S.E.M., n=5. (c) Late apoptotic neutrophils were incubated with increasing concentration of human serum and stained with an anti-Clu or isotype-matched mAb. Bound Abs were detected by flow cytometry using a FITC-labeled anti-mouse Ig Ab. Results are expressed in MFI values, mean±S.E.M., n=4. (d) Binding of OG-Clu to late apoptotic Jurkat T cells. The apoptosis was induced with 20 μg/ml etoposide or 20 ng/ml anti-FAS mAb. Results are expressed in MFI values, mean±S.E.M., n=4
Figure 2
Figure 2
Clu-binding elements are localized on blebs. (a) Late apoptotic neutrophils were incubated with increasing concentrations of OG-Clu or OG-HSA; the binding was analyzed by flow cytometry. Results are expressed in MFI values, mean±S.E.M., n=5. (b) Late apoptotic neutrophils were incubated with the indicated concentrations of unlabeled Clu or HSA before addition of 1 μM OG-Clu; the binding of OG-Clu was analyzed by flow cytometry. Results are expressed as the percentages of inhibition, mean±S.E.M., n=5. (c) Differential interference contrast (DIC; left panel) and confocal fluorescence (right panel) microscopic images of late apoptotic neutrophils incubated with OG-Clu. Images are representative of two independent experiments. White arrows, blebs; original magnification, × 630. (d) Neutrophils were incubated or not with 50 μg/ml Y-27632, prior to apoptosis induction. The binding of OG-Clu was evaluated by flow cytometry. Histograms are representative of three independent experiments
Figure 3
Figure 3
Clu binds to histones expressed on late apoptotic cells. (a) Late apoptotic Jurkat T cells were treated with 500 μg/ml DNase prior to incubation with 1 μM OG-Clu. DNase efficiency was assessed by PI staining. Dot plots are representative of four independent experiments. (b) Binding of OG-Clu to apoptotic Jurkat T cells treated with 500 μg/ml DNase, 100 μg/ml pronase, or 100 μg/ml glycosidase. As controls of DNase, pronase, and glycosidase efficiency, binding of PI, anti-dsDNA mAb, anti-CD45RA mAb, and FITC-labeled WGA was analyzed. Results are expressed as a percentage of variation of the binding of Clu, PI, anti-dsDNA mAb, anti-CD45RA mAb, and WGA on treated compared with non-treated cells, mean±S.E.M., n=4. (c) H1, H2A, H2B, H3, and H4 histone subunits and genomic human DNA were immobilized on a 96-well plate. Binding of biotinylated-HSA, -Clu, -CRP, and -SAP to histone subunits and DNA was determined by enzyme-linked immunosorbent assay. Results are expressed in OD values, mean±S.E.M.; n=5. *P<0.05 compared to none (Mann-Whitney test). (d) Apoptotic neutrophils were labeled with anti-H2/H3/H4 or isotype control mAbs, before incubation with a FITC-labeled anti-mouse IgG Ab. Live (R1), early apoptotic (R2), late apoptotic (R3), and necrotic neutrophils (R4) were discriminated by flow cytometry using Ann V and PI staining. Results are representative of one out four experiments. (e) Apoptotic neutrophils were incubated with OG-Clu in the presence of anti-H4 (upper panels) or anti-H2/H3/H4 mAbs (lower panels) prior to incubation with a PE-labeled anti-mouse IgG Ab. Presence of OG-Clu and histones on cell surface was assessed by confocal microscopy. DNA was stained with DAPI. Original magnification, × 630. Images are representative of one of the four experiments
Figure 4
Figure 4
Clu increases apoptotic cells clearance in vitro and in vivo. (a) Mϕ were fed for 30 min with PKH67-labeled early (upper panels) or late apoptotic neutrophils (lower panels) (1 : 10 ratio) previously opsonized or not with 1 μM Clu, MBL, or HSA before incubation with APC-labeled anti-HLA DR mAb. Fluorescence was analyzed by flow cytometry. Left, contour plots are representative of two (upper panels) or six (lower panels) independent experiments; values correspond to the percentage of Mϕ having engulfed dying cells. Right, results of phagocytosis assays using late apoptotic cells are expressed as a phagocytic index (see Materials and Methods); individual determinations are plotted, means are represented by horizontal bars. *P≤0.05. (b) Mϕ were fed with PKH67-labeled late apoptotic neutrophils previously incubated in the presence of 30% (v:v) human AB+ serum, depleted or not in Clu, and supplemented or not with 1 μM Clu. Results are shown as a phagocytic index, mean±S.E.M.; n=4. *P≤0.05; NS, not significant. (c) BMDM were fed with PKH67-labeled late apoptotic murine thymocytes (1 : 5 ratio) previously opsonized with 1 μM Clu or HSA before incubation with PE-labeled anti-F4/80 mAb. Fluorescence was analyzed by flow cytometry. (d) PKH67-labeled late apoptotic thymocytes were incubated with 1% serum from WT or Clu−/− mice. The phagocytosis assay was performed as previously described. (e) Clu−/− and WT mice (n=5) were injected intraperitoneally with Dex or with PBS. After 24 h, the frequency of Ann V+ apoptotic cells in the thymus was determined by flow cytometry. Left, representative histograms are shown. Values correspond to the percentage of apoptotic cells. Right, results are expressed as the percentage of apoptotic cells, mean±S.E.M., n=4; *P≤0.05. (f) PKH67-labeled late apoptotic thymocytes (1 × 10⁸) or PBS were injected intravenously in WT and Clu−/− mice. The frequency of PKH67-positive events within splenocytes 2 h after injection was evaluated by flow cytometry. Left, representative dot plots are shown. Values correspond to the percentage of PKH67-positive cells. Right, results are shown as the percentage of the PKH67-positive cells, mean±S.E.M., n=4; *P≤0.05
Figure 5
Figure 5
Clu enhances the presentation of apoptotic cell-associated antigen. Thymocytes from Swiss mice were pulsed or not with 35 μM Ova and induced to die by serum deprivation. Apoptotic thymocytes pulsed with Ova (Ova-Apopt) or not (Apopt) were incubated for 30 min (a) with Clu or albumin or (b) with 10% serum from WT or Clu−/− mice before culture with BMDCs and OT1 or OT2 cells. IL-2 was quantified in the 24-h supernatants by enzyme-linked immunosorbent assay. Results are expressed in pg/ml, mean±S.E.M.; n=6; *P≤0.05
Figure 6
Figure 6
Clu-deficient mice develop autoimmune symptoms in response to apoptotic cells. Aged-matched Clu−/− and WT mice were injected with apoptotic cells once a week for 5 weeks. Two weeks after the first injection of apoptotic cells, 4–6 mice per group were killed bimonthly. (a) Circulating IgG anti-dsDNA antibody levels were quantified. Results are expressed in kU/ml, mean±S.E.M., n=4 to 10; *P≤0.05. Insert, IgG anti-dsDNA antibody titers were quantified by enzyme-linked immunosorbent assay in the serum of PBS-injected Clu−/− and WT mice. (b) Ten weeks after the first injection of apoptotic cells, kidney sections from Clu−/− and WT mice were stained with FITC-labeled anti-mouse IgG (left pictures) or unlabeled anti-C4 revealed with a FITC-labeled anti-rat IgG antibodies (right pictures). Glomeruli were stained with DAPI (circles). Results are representative of four mice. (c) Spleens of WT and Clu−/− mice were weighed 10 weeks after the first injection of apoptotic cells or PBS. Results are expressed in mg, mean±S.E.M., n=4; *P≤0.05. (d) The expression of the mRNA encoding SAP was analyzed by quantitative PCR in the livers from Clu−/− and WT mice 10 weeks after the first injection of apoptotic cells or PBS. Results are expressed as a relative expression with GAPDH used as a calibrator, mean;±S.E.M., n=5; *P<0.05
Figure 7
Figure 7
Memory T cells from apoptotic cell-injected Clu-deficient mice exhibit an activated phenotype. Clu−/− and WT mice were injected with apoptotic cells once a week for 5 weeks. Two weeks after the first apoptotic cell injection, 4–6 mice per group were killed bimonthly. The phenotype and function of memory T cells was analyzed 10 weeks after the first injection in Clu−/− and WT mice. (a) Lymph node cells were stained with PeCy5-labeled anti-CD3, APCeFluor 780-labeled anti-CD4 or -CD8, FITC-labeled anti-CD62L, and PE-labeled anti-CD44 mAbs. Density plots represent cells gated on the CD3+ CD4+ (left) and CD3+ CD8+ (right) populations. Flow cytometric analysis identified CD44 CD62Lhigh naive T cells, CD44+ CD62Lhigh central memory T cells, and CD44+ CD62Llow effector memory T cells. Values correspond to the percentage of each subset. (b) CD62Llow/CD62Lhigh cell ratio among CD3+ CD4+ CD44+ (left histograms) and CD3+ CD8+ CD44+ (right histograms) cells in the lymph nodes of WT and Clu−/− mice. (c and d) Lymph node cells from Clu−/− and WT mice were stimulated in vitro with PMA plus ionomycin in the presence of brefeldin A, before staining with PeCy5-labeled anti-CD3, FITC-labeled anti-CD4, APCeFluor 780-labeled anti-CD8, PE-labeled anti-IL-2, and APC-labeled anti-IFNγ mAbs. Percentages of IL-2- (c) and IFNγ-secreting cells (d) among CD3+ CD4+ (left histograms) and CD3+ CD8+ (right histograms) are shown. (b-d). Mean±S.E.M., n=4 to 6; *P≤0.05

References

    1. Trougakos IP, Gonos ES. Clusterin/apolipoprotein J in human aging and cancer. Int J Biochem Cell Biol 2002; 34: 1430–1448. - PubMed
    1. Jenne DE, Lowin B, Peitsch MC, Bottcher A, Schmitz G, Tschopp J. Clusterin (complement lysis inhibitor) forms a high density lipoprotein complex with apolipoprotein A-I in human plasma. J Biol Chem 1991; 266: 11030–11036. - PubMed
    1. Hogasen K, Mollnes TE, Tschopp J, Harboe M. Quantitation of vitronectin and clusterin. Pitfalls and solutions in enzyme immunoassays for adhesive proteins. J Immunol Methods 1993; 160: 107–115. - PubMed
    1. Morrissey C, Lakins J, Moquin A, Hussain M, Tenniswood M. An antigen capture assay for the measurement of serum clusterin concentrations. J Biochem Biophys Methods 2001; 48: 13–21. - PubMed
    1. Wyatt AR, Yerbury JJ, Berghofer P, Greguric I, Katsifis A, Dobson CM et al. Clusterin facilitates in vivo clearance of extracellular misfolded proteins. Cell Mol Life Sci 2011; 68: 3919–3931. - PMC - PubMed

Publication types

MeSH terms