

Age differences in loneliness from late adolescence to oldest old age
- PMID: 27148782
- PMCID: PMC8015413
- DOI: 10.1037/dev0000117
Age differences in loneliness from late adolescence to oldest old age
Abstract
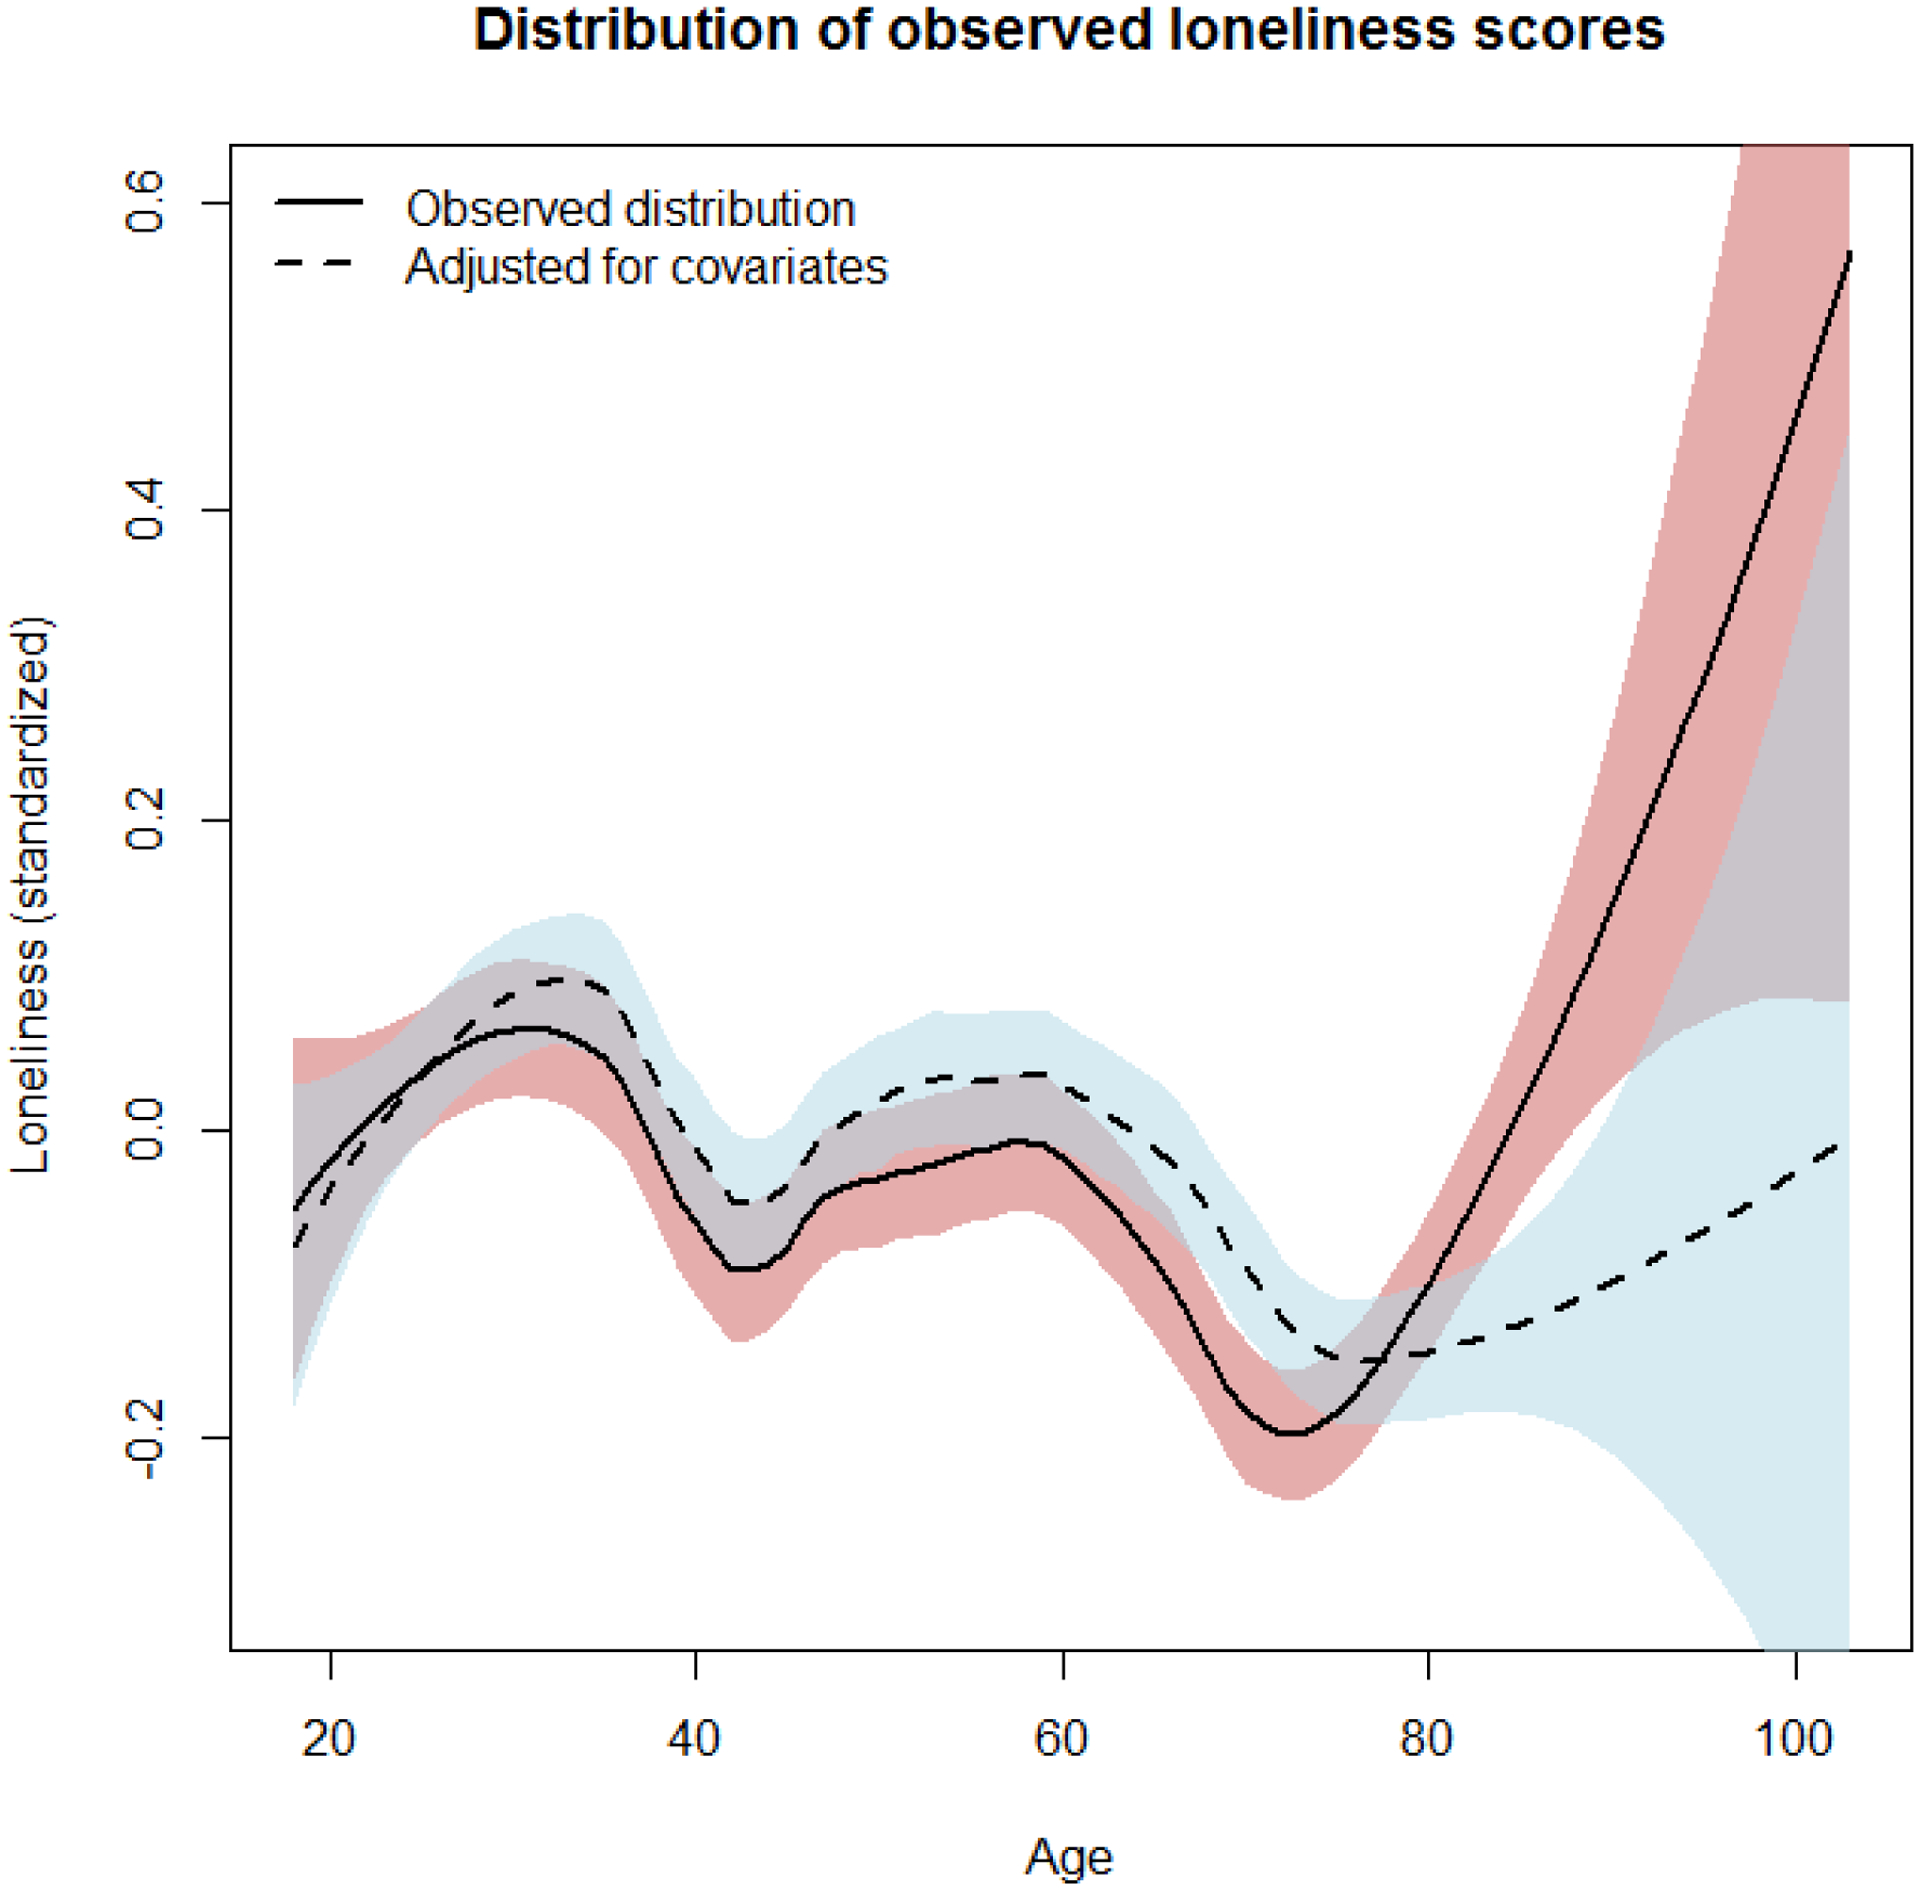
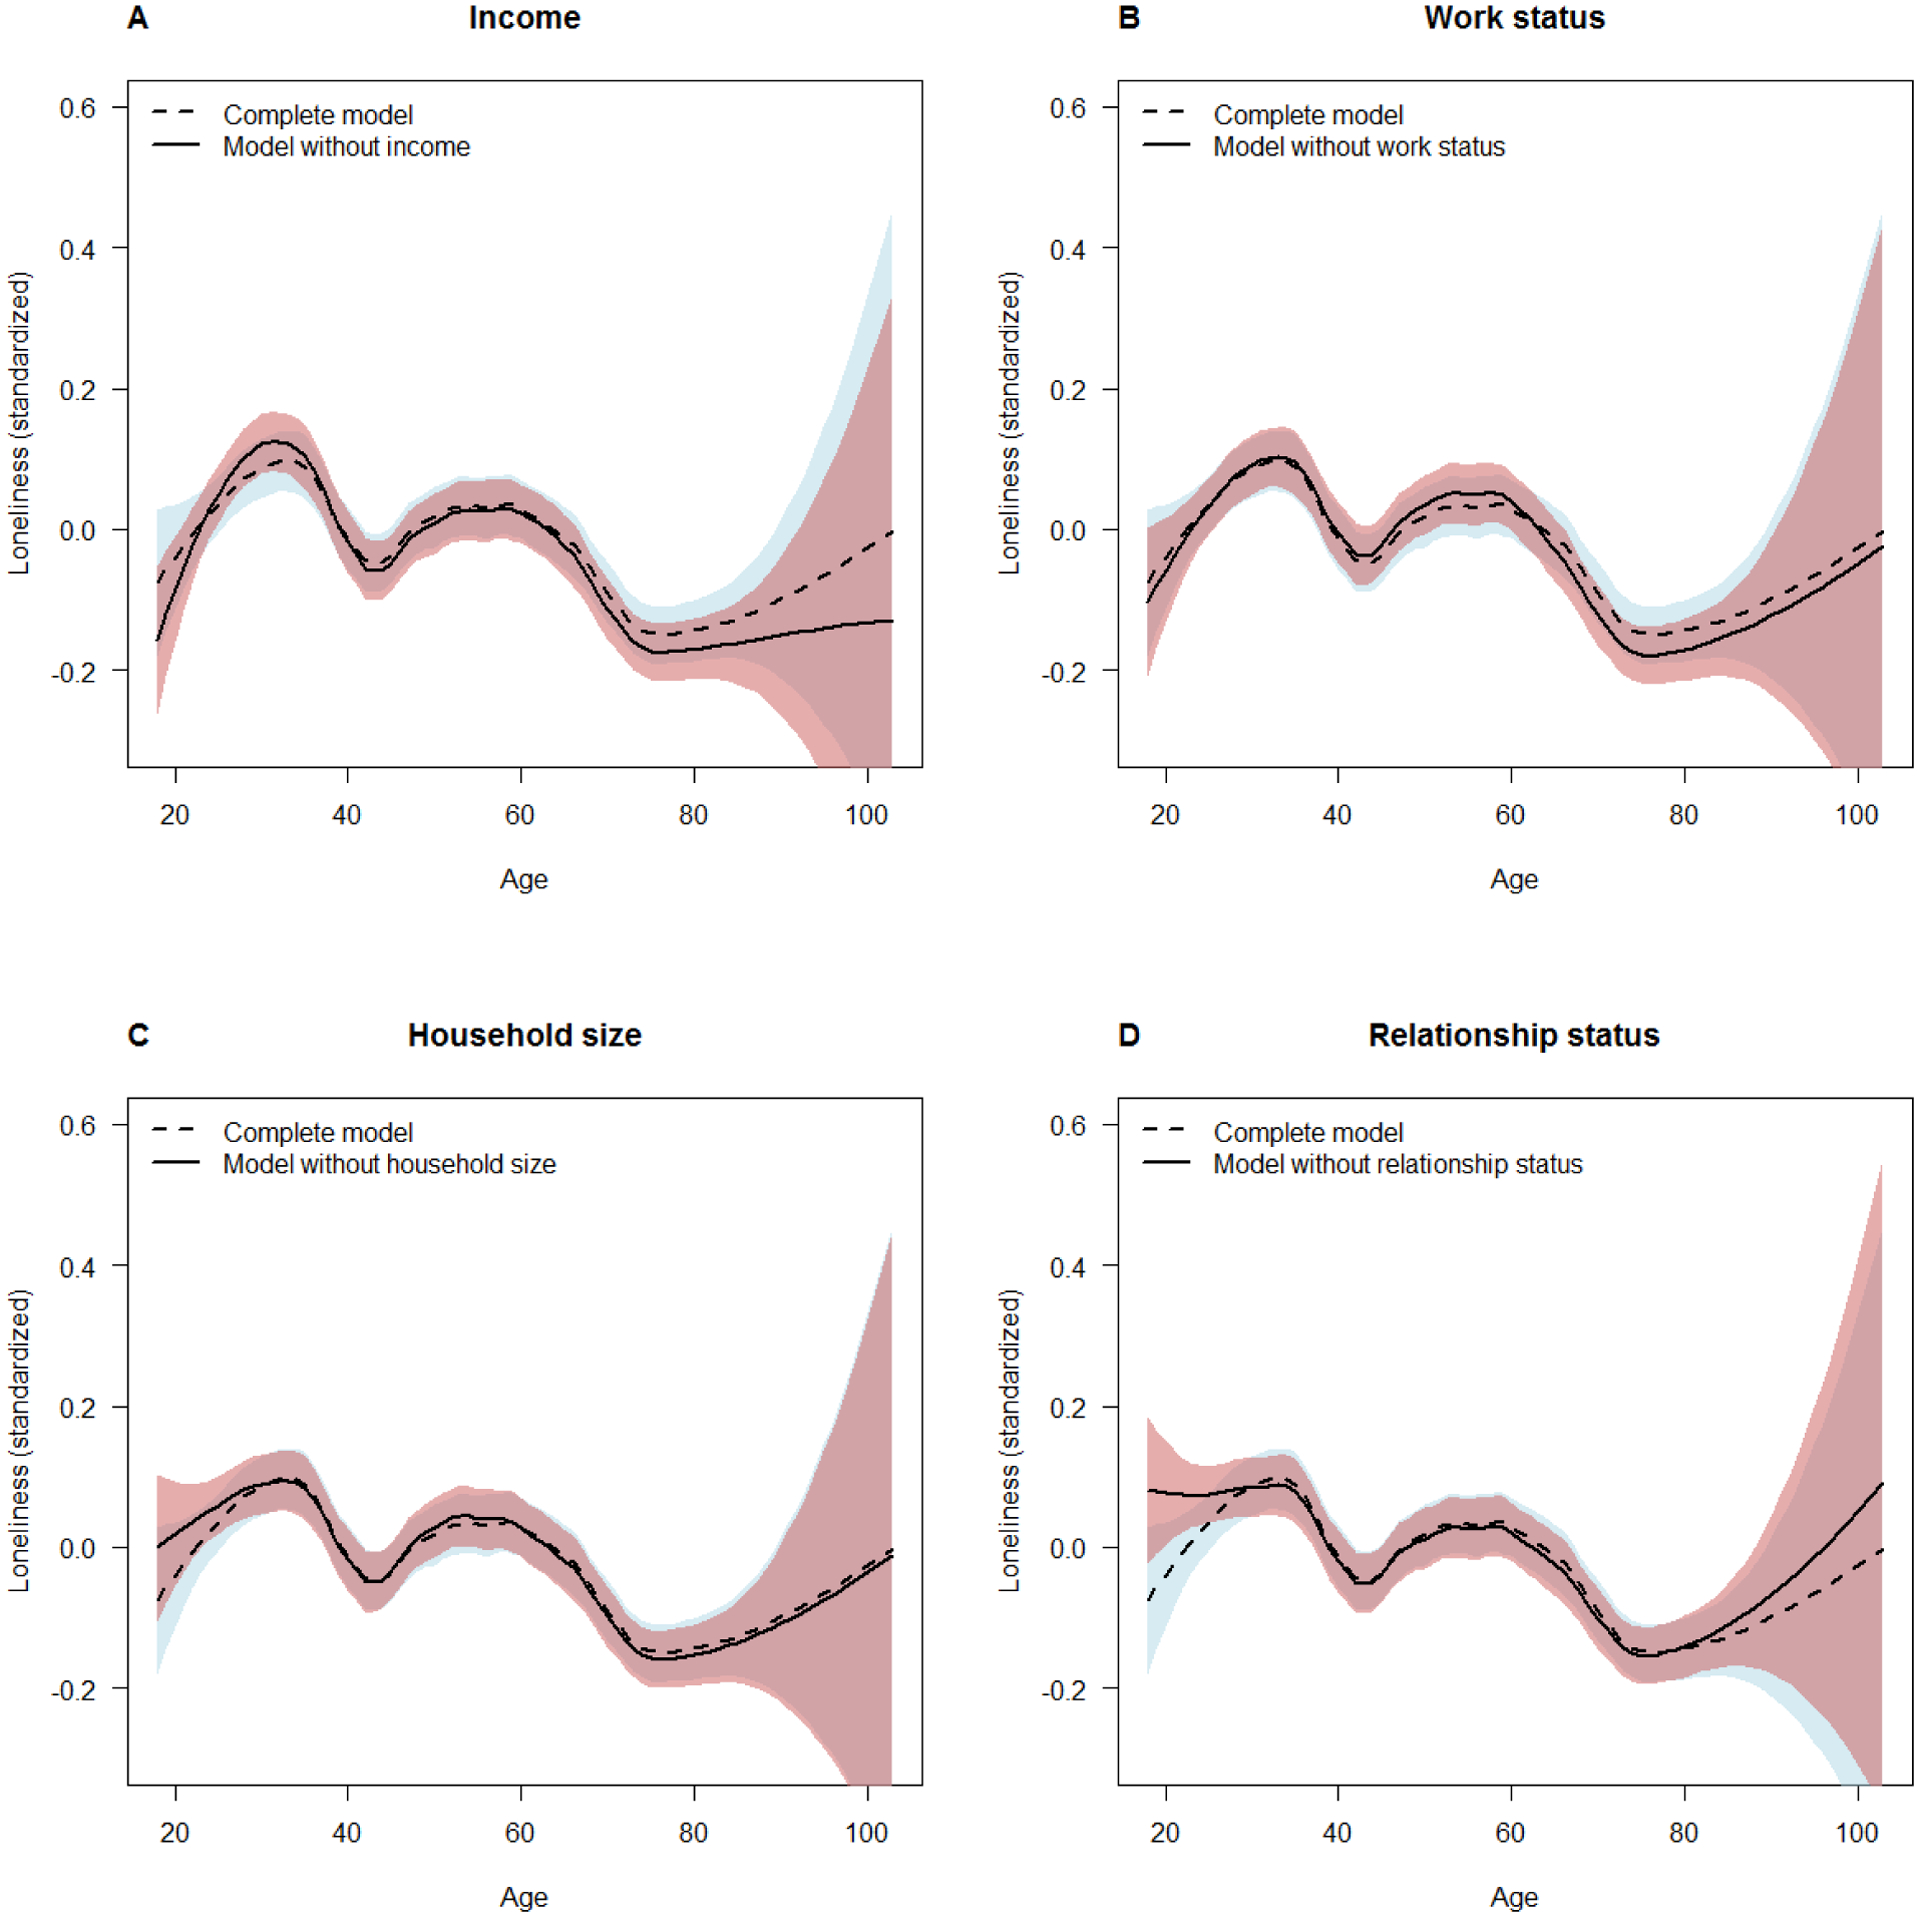
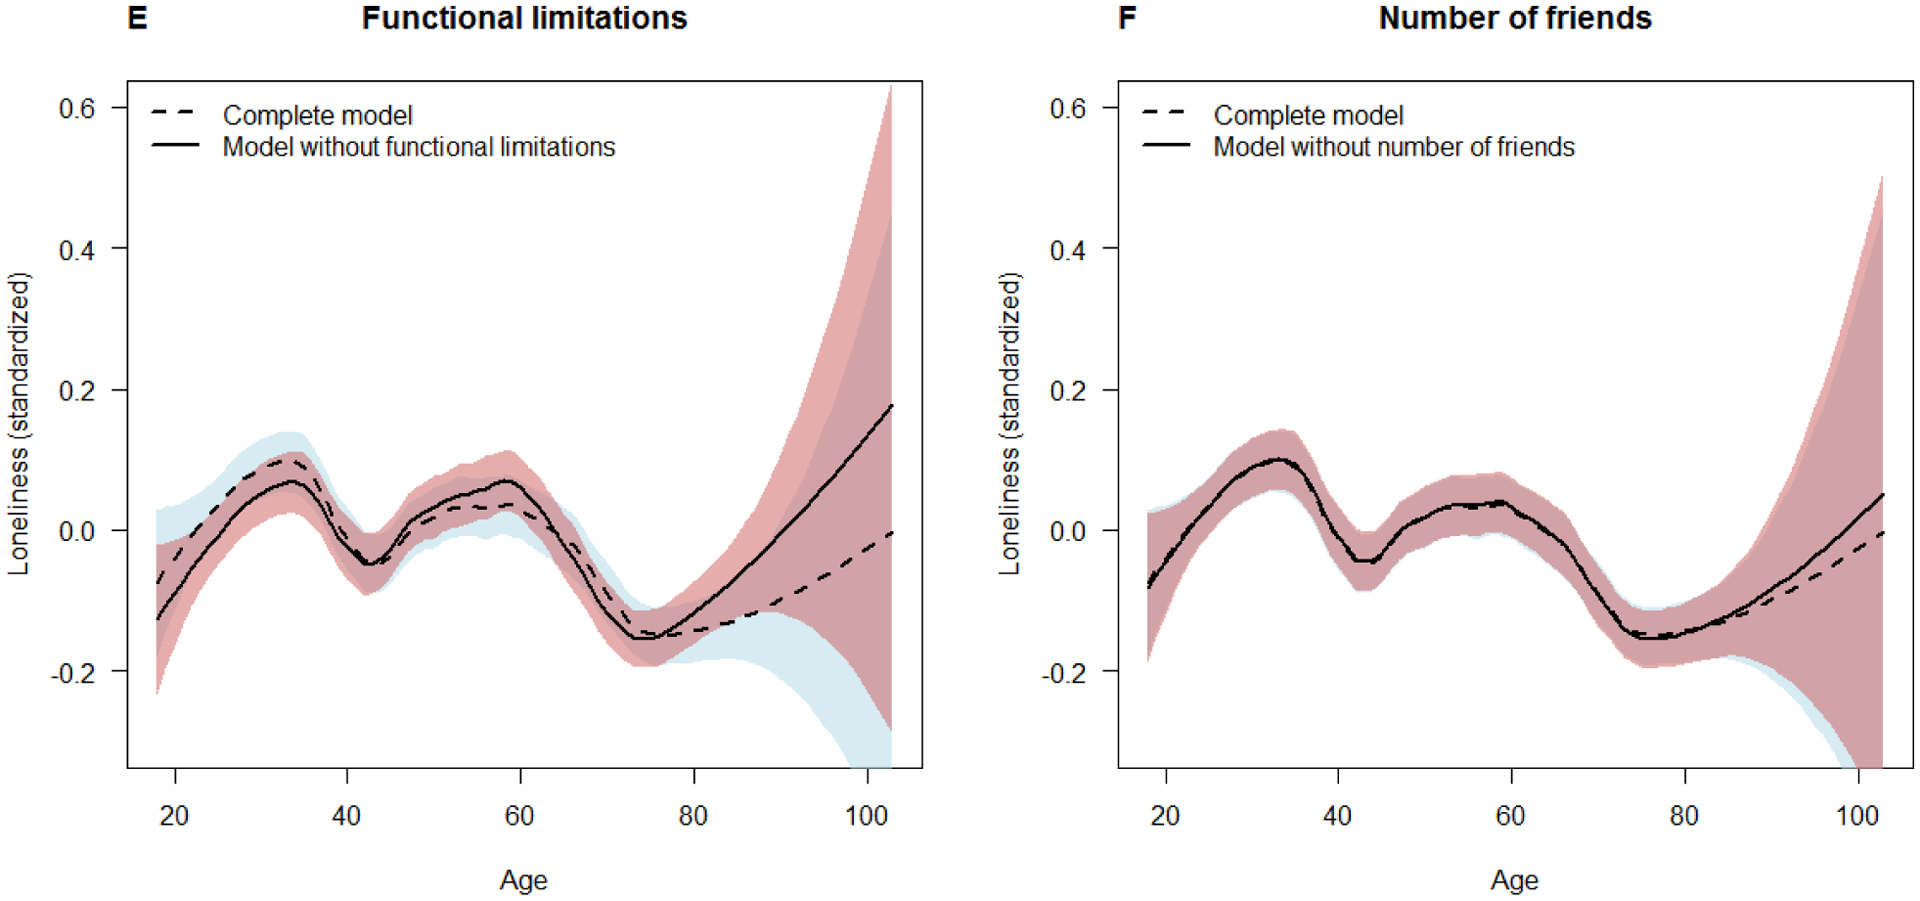
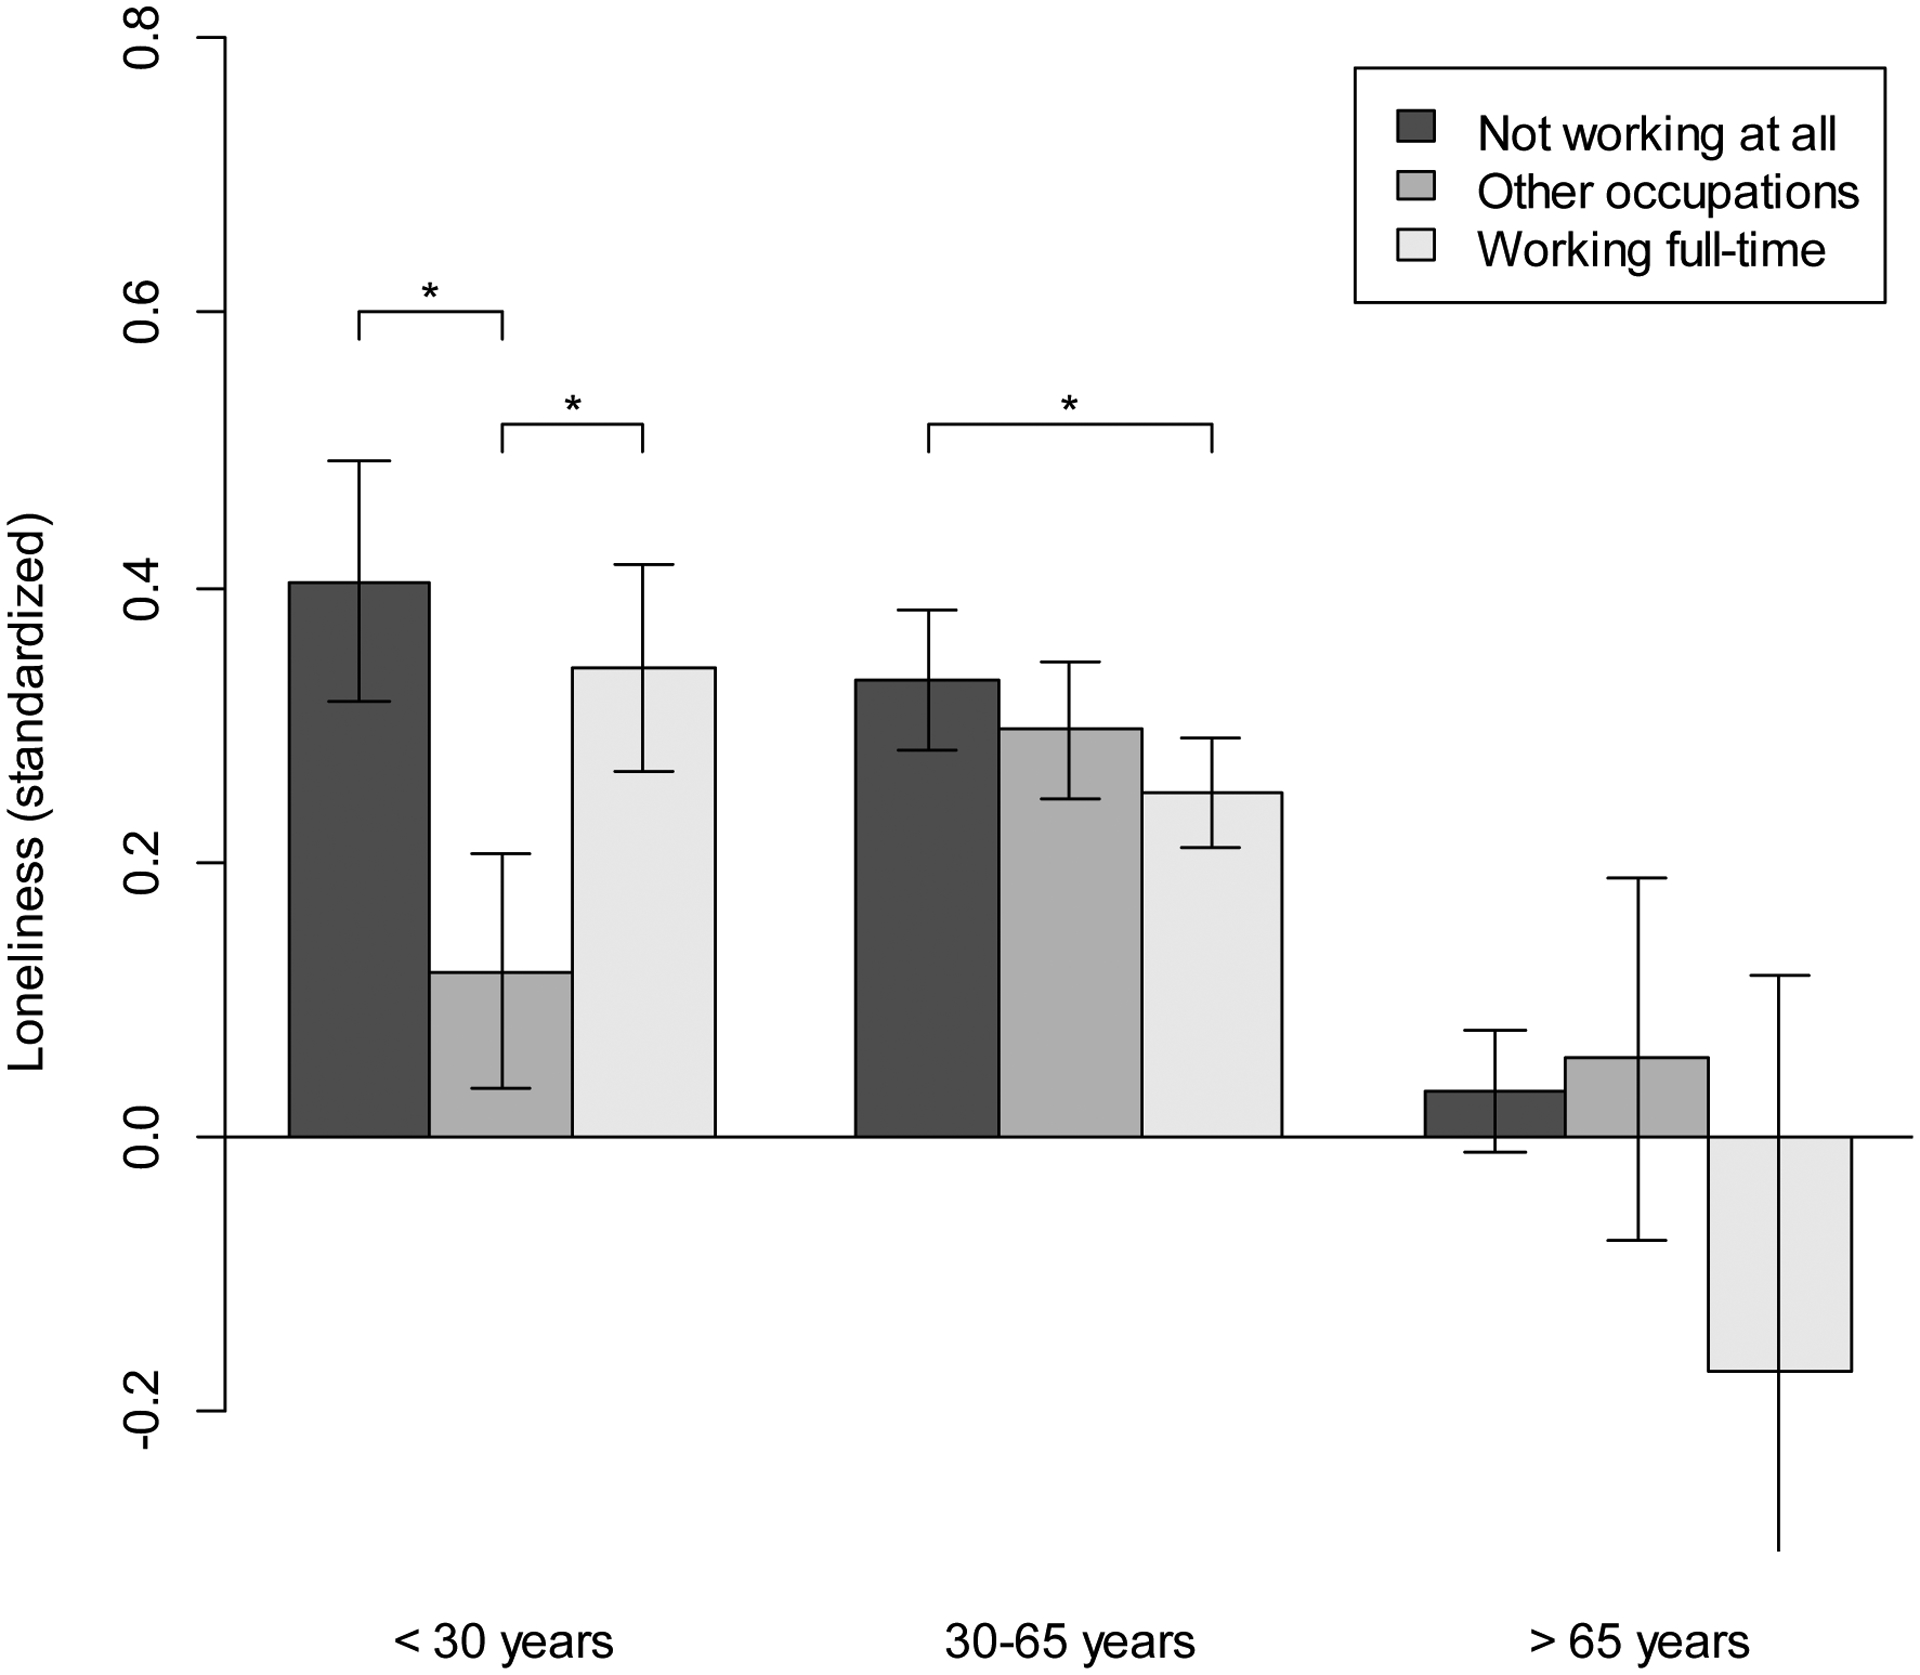
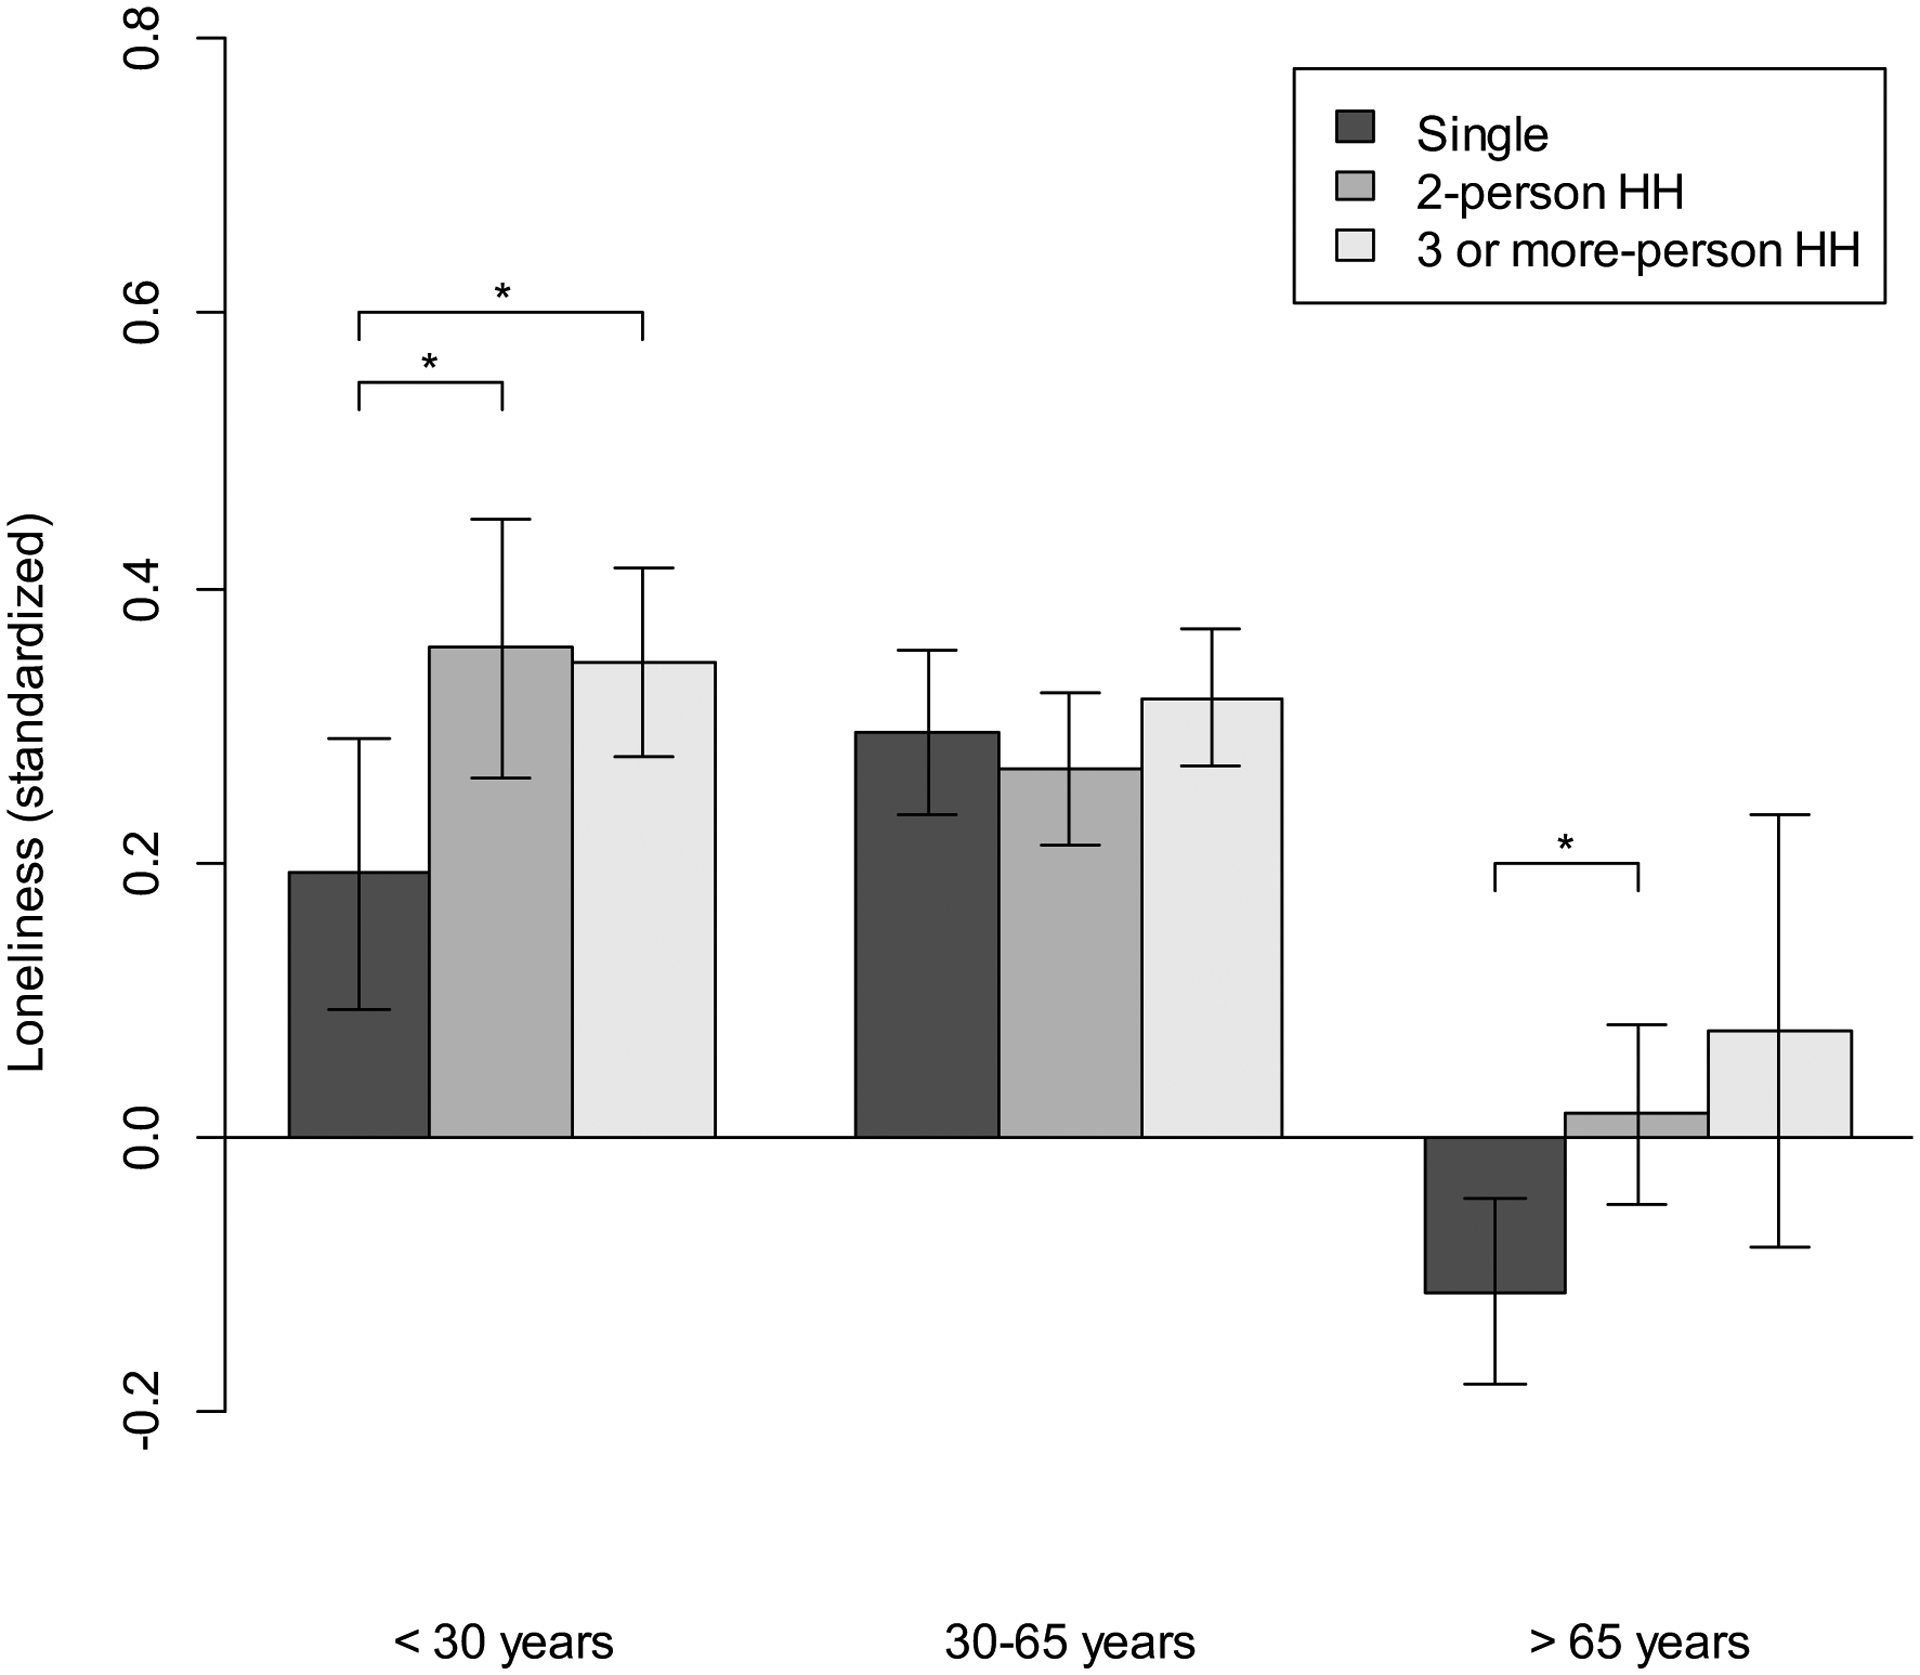
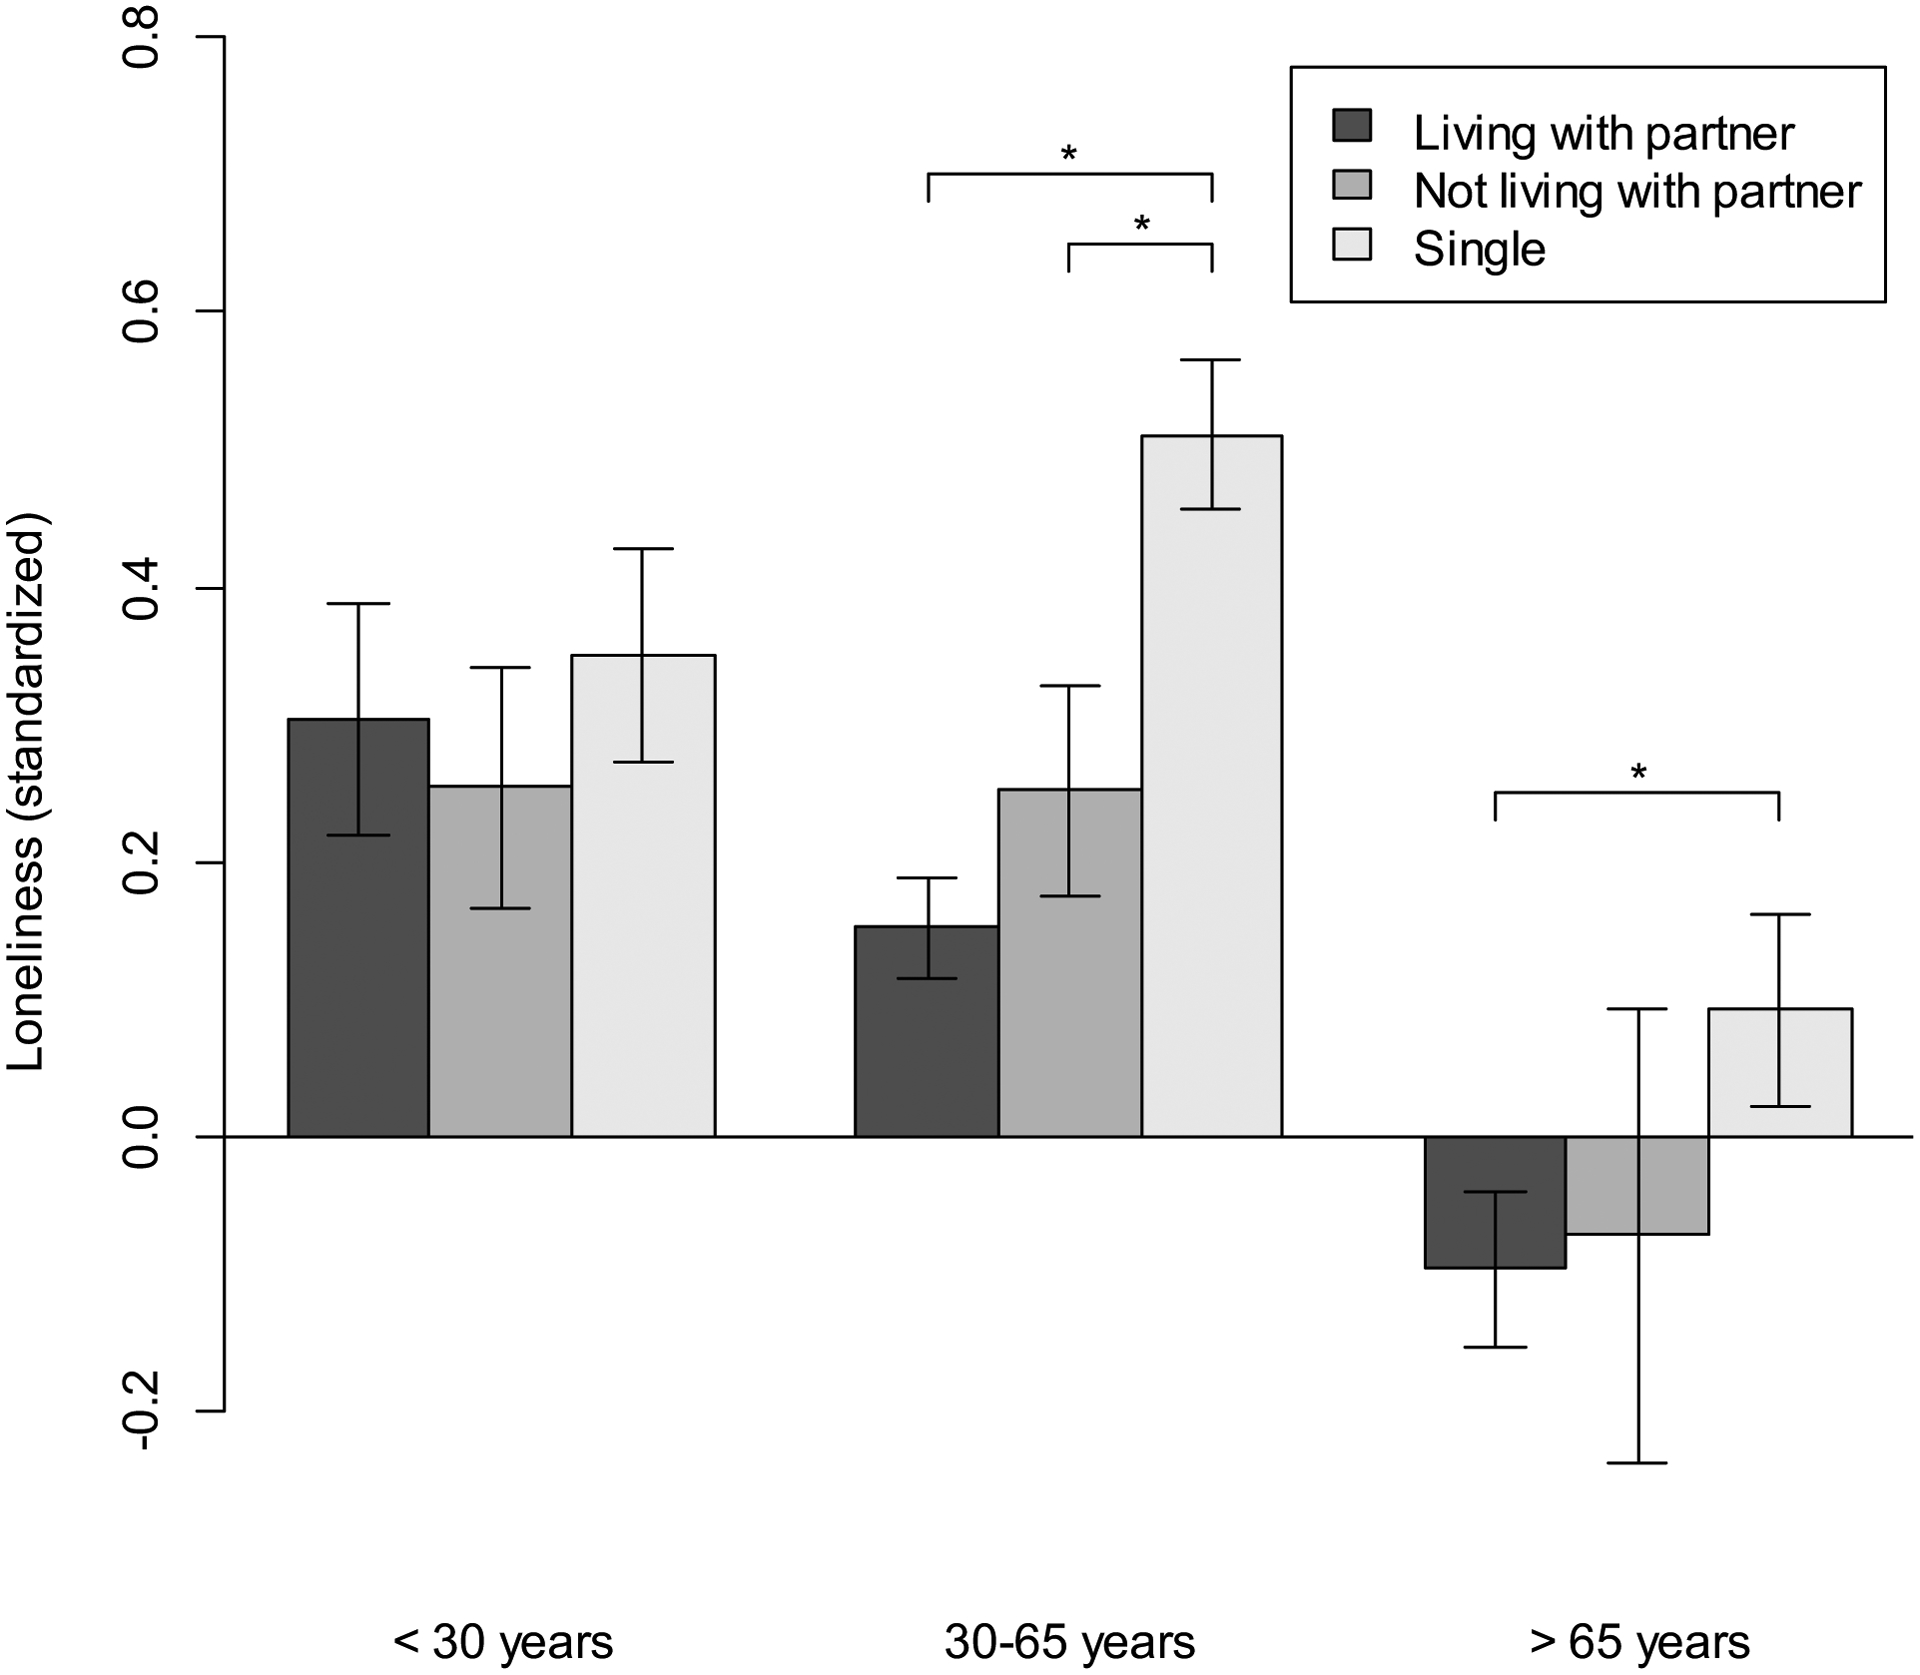
Contrary to common stereotypes, loneliness is not restricted to old age but can occur at any life stage. In this study, we used data from a large, nationally representative German study (N = 16,132) to describe and explain age differences in loneliness from late adolescence to oldest old age. The age distribution of loneliness followed a complex nonlinear trajectory, with elevated loneliness levels among young adults and among the oldest old. The late-life increase in loneliness could be explained by lower income levels, higher prevalence of functional limitations, and higher proportion of singles in this age group. Consistent with an age-normative perspective, the association of income, relationship status, household size, and work status with loneliness differed between different age groups. In contrast, indicators of the quantity of social relationships (social engagement, number of friends, contact frequency) were universally associated with loneliness regardless of age. Overall, these findings show that sources of loneliness in older adults are well understood. Future research should focus on understanding the specific sources of loneliness in middle-aged adults. (PsycINFO Database Record
(c) 2016 APA, all rights reserved).
Figures
References
-
- Asher SR, & Paquette JA (2003). Loneliness and peer relations in childhood. Current Directions in Psychological Science, 12(3), 75–78. doi:10.1111/1467-8721.01233 - DOI
-
- Ayalon L, Palgi Y, Avidor S, & Bodner E (2015). Accelerated increase and decrease in subjective age as a function of changes in loneliness and objective social indicators over a four-year period: Results from the Health and Retirement Study. Aging and Mental Health, 1–9. doi:10.1080/13607863.2015.1035696 - DOI - PubMed
-
- Borys S, & Perlman D (1985). Gender differences in loneliness. Personality and Social Psychology Bulletin, 11(1), 63–74. doi:10.1177/0146167285111006 - DOI
MeSH terms
Grants and funding
LinkOut - more resources
Full Text Sources
Other Literature Sources
Medical
