

Population Dynamics of Early Human Migration in Britain
- PMID: 27148959
- PMCID: PMC4858239
- DOI: 10.1371/journal.pone.0154641
Population Dynamics of Early Human Migration in Britain
Abstract
Background: Early human migration is largely determined by geography and human needs. These are both deterministic parameters when small populations move into unoccupied areas where conflicts and large group dynamics are not important. The early period of human migration into the British Isles provides such a laboratory which, because of its relative geographical isolation, may allow some insights into the complex dynamics of early human migration and interaction.
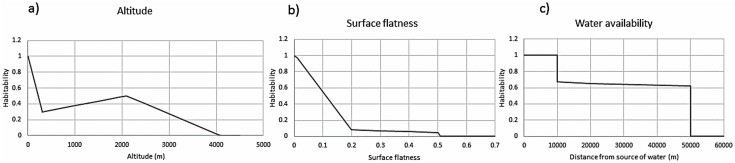
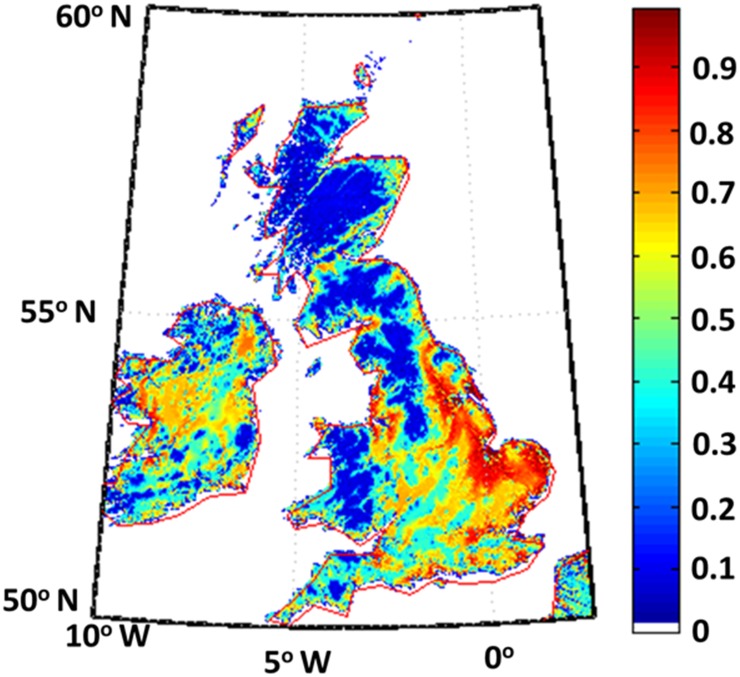
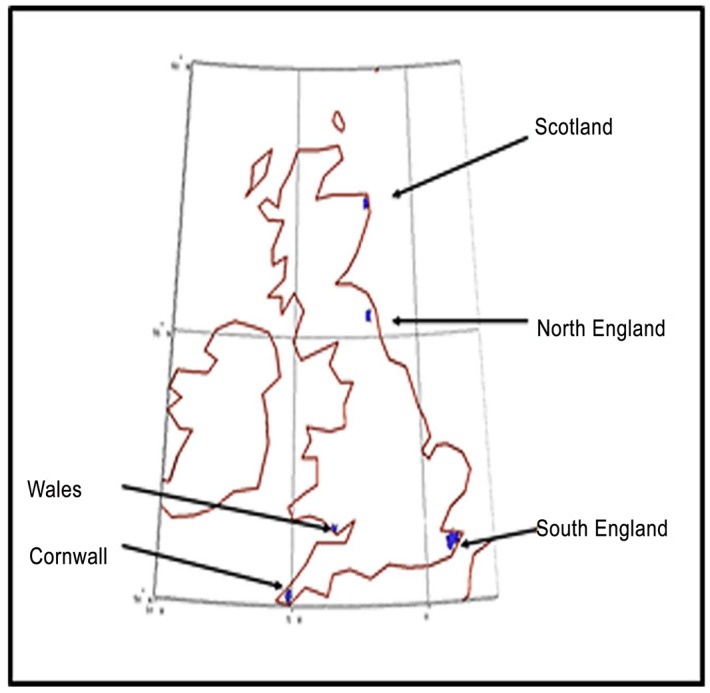
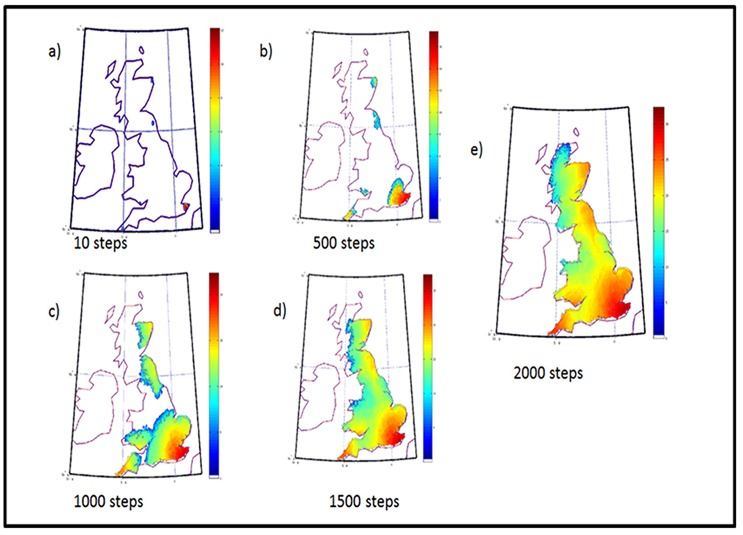
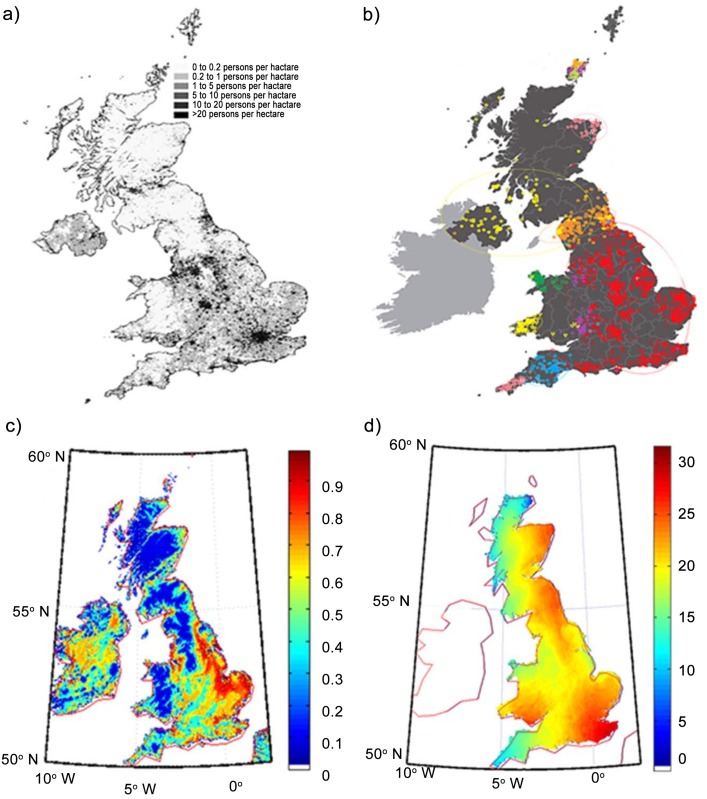
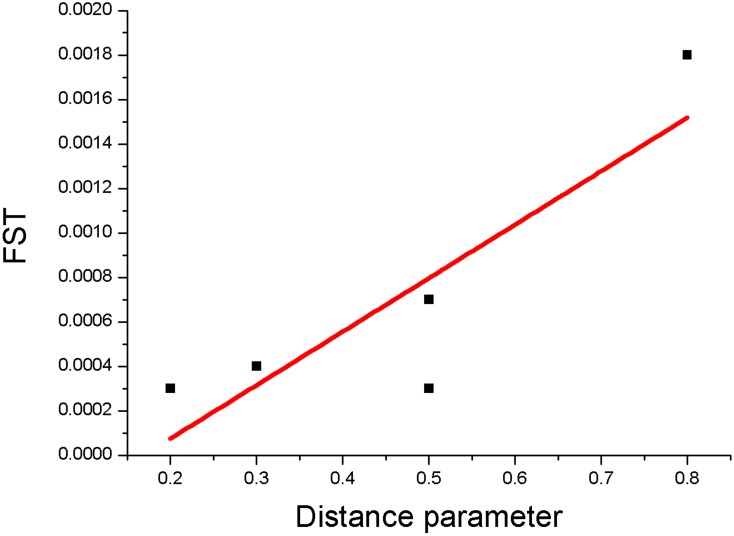
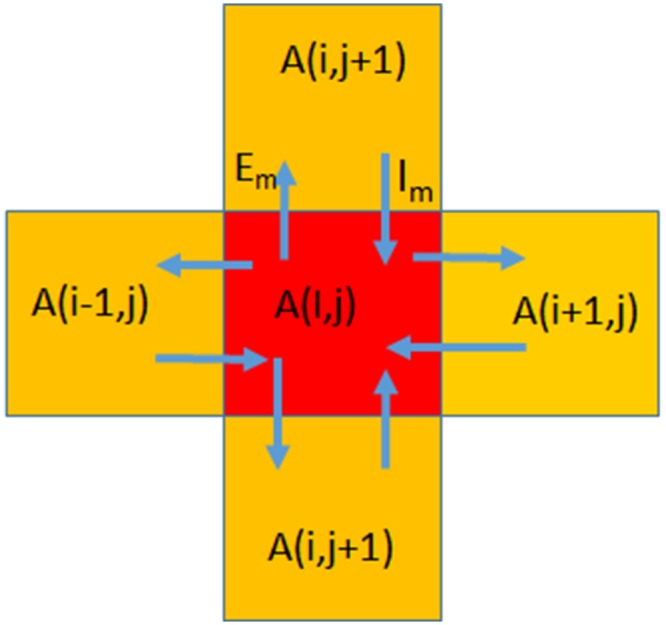
Method and results: We developed a simulation code based on human affinity to habitable land, as defined by availability of water sources, altitude, and flatness of land, in choosing the path of migration. Movement of people on the British island over the prehistoric period from their initial entry points was simulated on the basis of data from the megalithic period. Topographical and hydro-shed data from satellite databases was used to define habitability, based on distance from water bodies, flatness of the terrain, and altitude above sea level. We simulated population movement based on assumptions of affinity for more habitable places, with the rate of movement tempered by existing populations. We compared results of our computer simulations with genetic data and show that our simulation can predict fairly accurately the points of contacts between different migratory paths. Such comparison also provides more detailed information about the path of peoples' movement over ~2000 years before the present era.
Conclusions: We demonstrate an accurate method to simulate prehistoric movements of people based upon current topographical satellite data. Our findings are validated by recently-available genetic data. Our method may prove useful in determining early human population dynamics even when no genetic information is available.
Conflict of interest statement
Figures
Similar articles
-
A diffusion based study of population dynamics: Prehistoric migrations into South Asia.PLoS One. 2017 May 11;12(5):e0176985. doi: 10.1371/journal.pone.0176985. eCollection 2017. PLoS One. 2017. PMID: 28493906 Free PMC article.
-
The facts about the urban exodus.Town Ctry Plann. 1997 Mar;66(3):77-9. Town Ctry Plann. 1997. PMID: 12322158
-
Human migration patterns in Yemen and implications for reconstructing prehistoric population movements.PLoS One. 2014 Apr 23;9(4):e95712. doi: 10.1371/journal.pone.0095712. eCollection 2014. PLoS One. 2014. PMID: 24759992 Free PMC article.
-
Influence of Changes in Political Barriers and of Geographic Distance on Kinship Inferred from Surnames and Migration Data in Olivenza, Spain, and Surrounding Portuguese Areas.Hum Biol. 2015 Apr;87(2):122-31. doi: 10.13110/humanbiology.87.2.0122. Hum Biol. 2015. PMID: 26829295
-
Population and evolutionary dynamics in spatially structured seasonally varying environments.Biol Rev Camb Philos Soc. 2018 Aug;93(3):1578-1603. doi: 10.1111/brv.12409. Epub 2018 Mar 25. Biol Rev Camb Philos Soc. 2018. PMID: 29575449 Free PMC article. Review.
Cited by
-
A diffusion based study of population dynamics: Prehistoric migrations into South Asia.PLoS One. 2017 May 11;12(5):e0176985. doi: 10.1371/journal.pone.0176985. eCollection 2017. PLoS One. 2017. PMID: 28493906 Free PMC article.
References
-
- Hughes DJ (2006) What is environmental history? Polity Press, Cambridge.
-
- Gamble C (1994) The prehistory of global colonization. Harvard University Press, Cambridge.
-
- Weidlich W and Haag G, (Eds.), 1999. An Integrated Model of Transport and Urban Evolution, Springer, Berlin.
MeSH terms
LinkOut - more resources
Full Text Sources
Other Literature Sources
