. 2016 May 5;12(5):e1005857.
doi: 10.1371/journal.pgen.1005857. eCollection 2016 May.

Chromatoid Body Protein TDRD6 Supports Long 3' UTR Triggered Nonsense Mediated mRNA Decay

Affiliations

Chromatoid Body Protein TDRD6 Supports Long 3' UTR Triggered Nonsense Mediated mRNA Decay

Grigorios Fanourgakis et al. PLoS Genet. .

Abstract

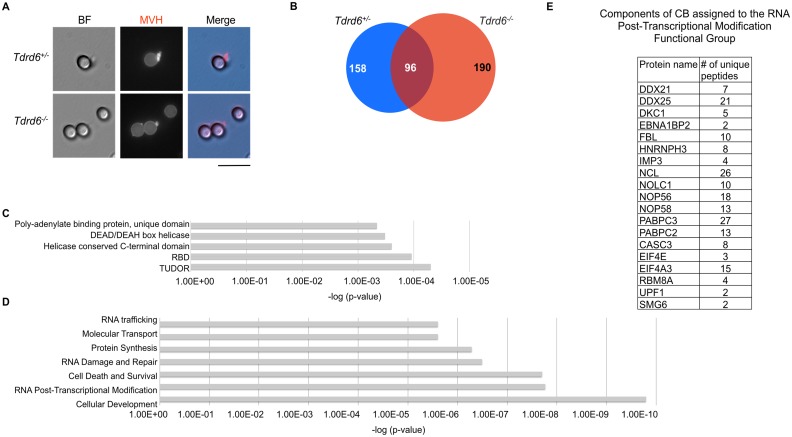
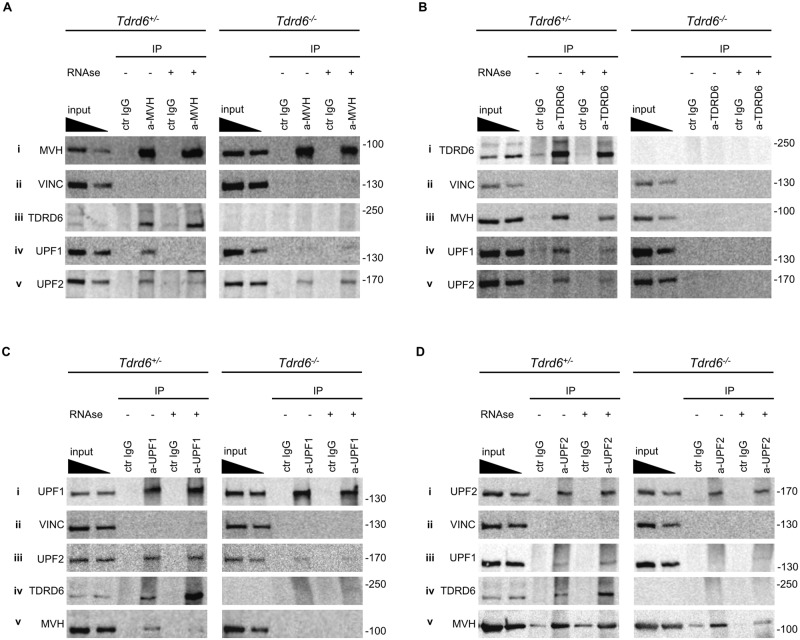
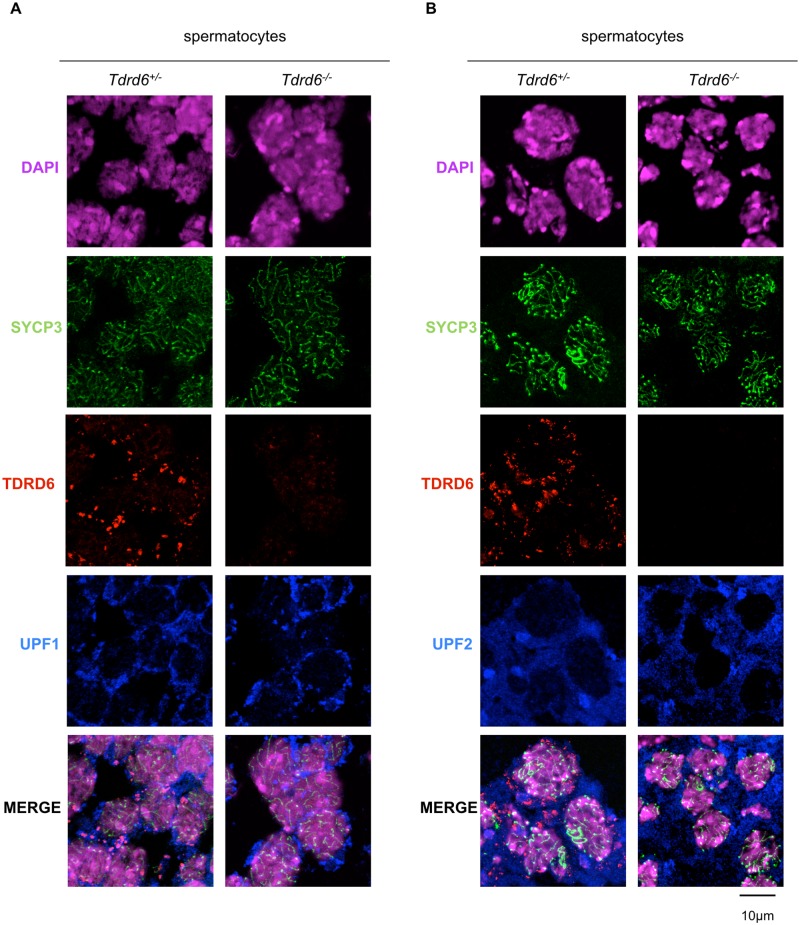
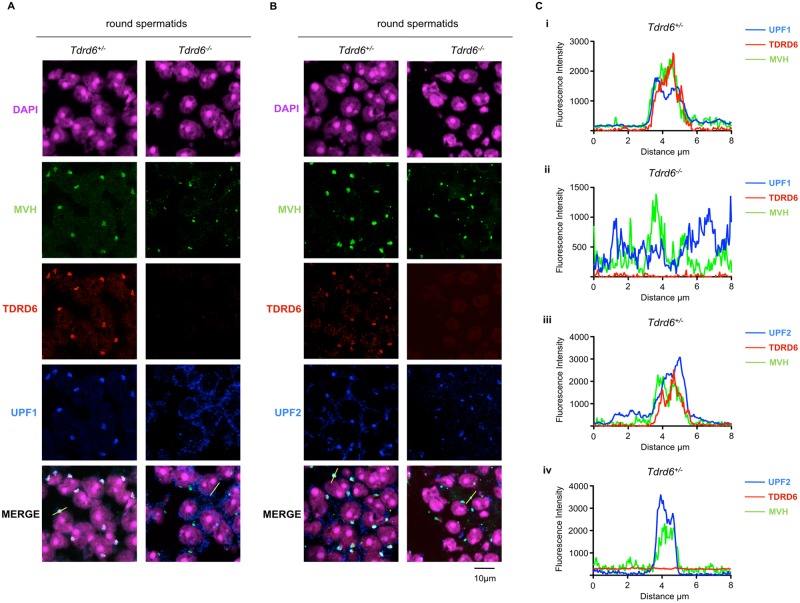
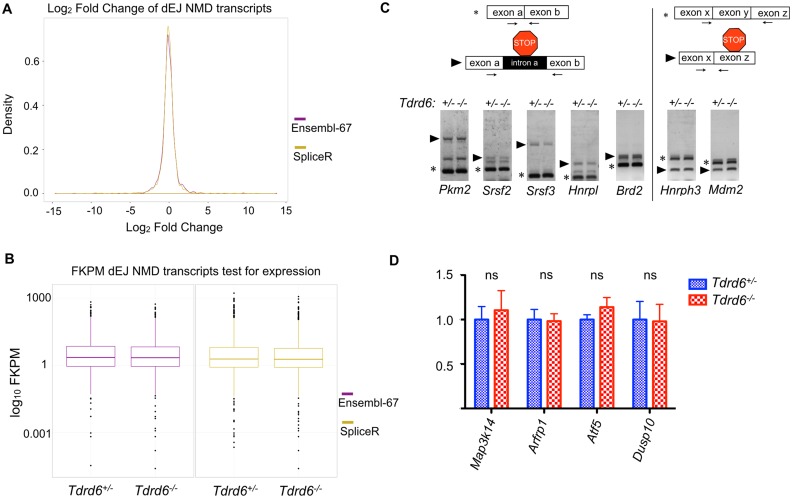
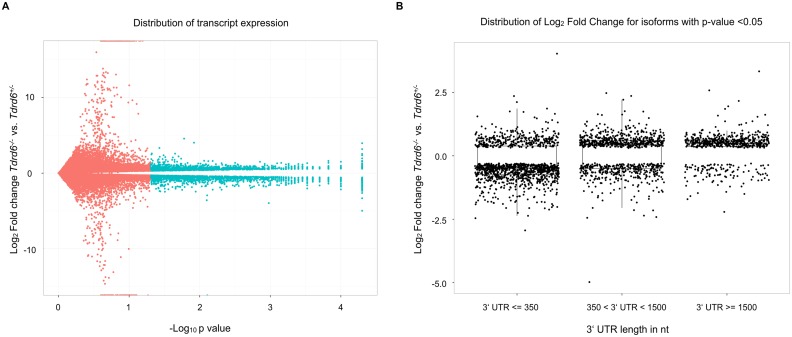
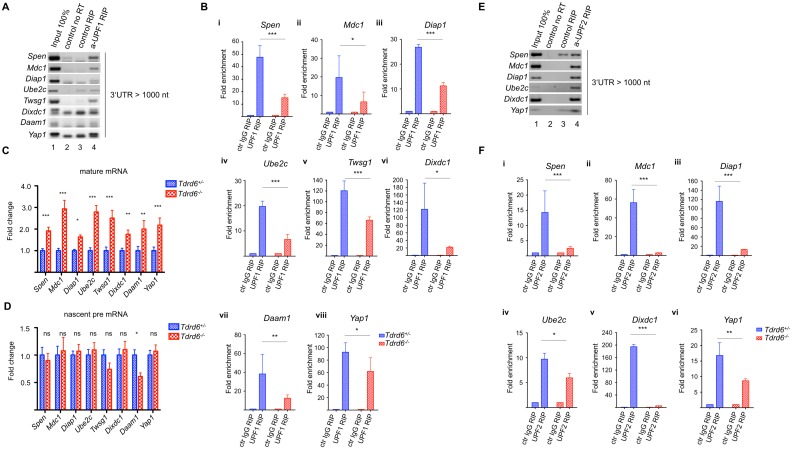
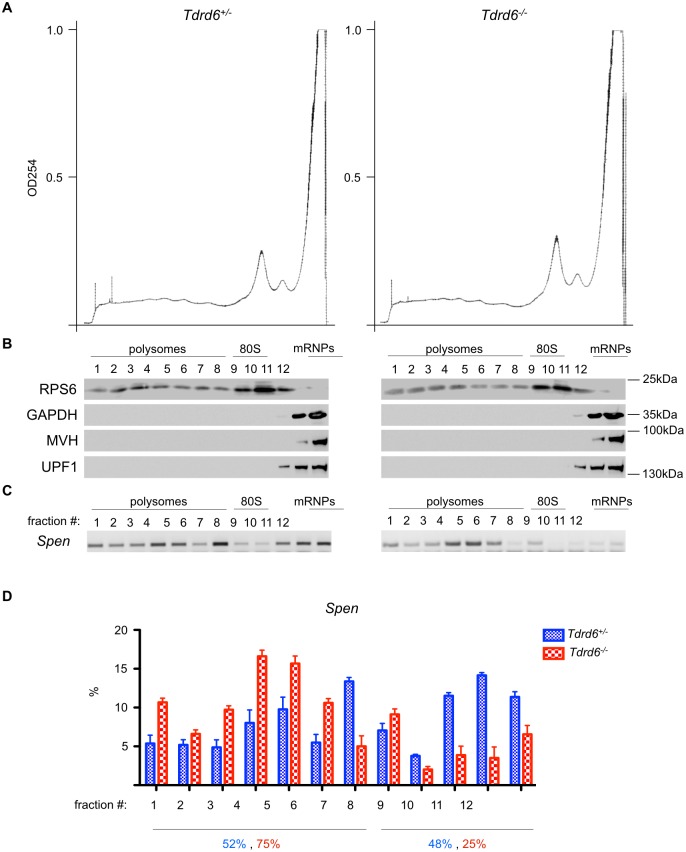
Chromatoid bodies (CBs) are spermiogenesis-specific organelles of largely unknown function. CBs harbor various RNA species, RNA-associated proteins and proteins of the tudor domain family like TDRD6, which is required for a proper CB architecture. Proteome analysis of purified CBs revealed components of the nonsense-mediated mRNA decay (NMD) machinery including UPF1. TDRD6 is essential for UPF1 localization to CBs, for UPF1-UPF2 and UPF1-MVH interactions. Upon removal of TDRD6, the association of several mRNAs with UPF1 and UPF2 is disturbed, and the long 3' UTR-stimulated but not the downstream exon-exon junction triggered pathway of NMD is impaired. Reduced association of the long 3' UTR mRNAs with UPF1 and UPF2 correlates with increased stability and enhanced translational activity. Thus, we identified TDRD6 within CBs as required for mRNA degradation, specifically the extended 3' UTR-triggered NMD pathway, and provide evidence for the requirement of NMD in spermiogenesis. This function depends on TDRD6-promoted assembly of mRNA and decay enzymes in CBs.


Conflict of interest statement

The authors have declared that no competing interests exist.

Figures

Fig 1
Fig 1. Proteomic analysis of CBs.
(A) Immunofluorescence staining of Tdrd6+/- and Tdrd6-/- CBs attached on Dynabeads coupled with anti-MVH. CBs were visualized by anti-MVH staining. Signal obtained from Dynabeads is a result of anti-MVH coupling. Dynabeads can be visualized in the bright-field channel (BF). Scale bar 10 μm. (B) Venn diagram showing proteins identified in Tdrd6+/- and Tdrd6-/- CB preparations.(C) Bar plot showing the most enriched domains in 158 proteins found exclusively in Tdrd6+/- CB preparation. The analysis was performed by DAVID 6.7 functional annotation tool and the results are ordered by p-value of enrichment. (D) Bar plot showing the most enriched functional groups according to Molecular and Cellular Function of 158 proteins found exclusively in Tdrd6+/- CB preparation. The analysis was performed by IPA and the results are ordered by p-value of enrichment. (E) List of proteins of RNA Post-Transcriptional Modification functional group found enriched in Tdrd6+/- CB preparation and the corresponding number of unique peptides identified by MS.
Fig 2
Fig 2. Associations of UPF proteins with CB components.
(A,B,C,D) Cell lysate from Tdrd6+/- (left) and Tdrd6-/- (right) round spermatids was precipitated with antibodies specific for (A) MVH (B) TDRD6 (C) UPF1 and (D) UPF2. Irrelevant rabbit IgG was used for immuno-precipitation (IP) control, RNAse A treatment was included as indicated. IP proteins were separated by SDS-PAGE and transferred to nitrocellulose membranes. Membranes were probed with anti-TDRD6, anti-MVH, anti-UPF1, anti-UPF2. Probing with anti-VINC serves as negative co-IP control. Inputs represent 10% and 5% of the sample used for immuno-precipitation. Molecular weight in kilodalton is noted on the right side of each blot. All images are representative from at least 3 independent IP experiments.
Fig 3
Fig 3. Localization of UPF proteins in primary spermatocytes.
Immunofluorescence staining of Tdrd6+/- and Tdrd6-/- testes. Frozen sections of 18 dpp testes were stained with anti-SYCP3 (green), anti-TDRD6 (red), anti-UPF1 (blue) in (A) anti-UPF2 (blue) in (B). DAPI (magenta) marks the nuclei. Scale bar 10 μm. Images are representative from 3 independent immunofluorescence experiments.
Fig 4
Fig 4. Localization of UPF proteins in round spermatids.
Immunofluorescence staining of Tdrd6+/- and Tdrd6-/- testes. Frozen sections of 26 dpp testes were stained with anti-MVH (green), anti-TDRD6 (red), anti-UPF1 (blue) in (A) anti-UPF2 (blue) in (B). DAPI (magenta) marks the nuclei. Scale bar 10 μm. Images are representative from 3 independent immunofluorescence experiments. (C) Line graphs showing the immunofluorescence intensity profile along the freely positioned line of MVH (green), TDRD6 (red) and UPF1 (blue) in Tdrd6+/- (i); MVH (green), TDRD6 (red) and UPF1 (blue) in Tdrd6-/- (ii); MVH (green), TDRD6 (red) and UPF2 (blue) in Tdrd6+/- (iii); MVH (green), TDRD6 (red) and UPF2 (blue) in Tdrd6-/- (iv).
Fig 5
Fig 5. Analysis of dEJ NMD pathway.
(A) Line Graph showing the distribution of expression changes for transcripts marked as putative dEJ NMD targets by Ensemble v67 (magenta line) and SpliceR (yellow line) between the two conditions (Tdrd6+/- and Tdrd6-/-) in fold change (x axis; log2 values). (B) Box plot showing the expression values for transcripts marked as putative dEJ NMD targets by Ensemble v67 (magenta) and SpliceR (yellow) (y axis; log10 scale) for Tdrd6+/- and Tdrd6-/- given in fragments per kilobase per million sequenced reads (FPKM). (C) Top left: Schematic representation of a normal splicing event marked by asterisk and PTC upon intron inclusion event marked by arrowhead. Arrows represent primer pairs used in the assay below. Bottom left: RT-PCR analysis of Pkm2, Srsf2, Srsf3, Hnrpl and Brd2 transcripts with known aberrant intron inclusion event. Top right: Schematic representation of a normal splicing event marked by asterisk and PTC upon exon exclusion event marked by arrowhead. Arrows represent primer pairs used in the assay below. Bottom right: RT-PCR analysis of Hnrph3 and Mdm2 transcripts with known aberrant exon exclusion event. Pictures are representative from 2 independent experiments. (D) RT-qPCR analysis of Map3k14, Arfrp1, Atf5, and Dusp10 (known NMD sensitive mRNAs due to 5’ uORFs presence) mRNA expression in Tdrd6+/- (blue bars) and Tdrd6-/- (red bars) round spermatids. Results are presented in terms of a fold change after normalizing mRNA levels with β-actin mRNA level. Each value represents the mean of three independent experiments. ns not significant p value>0.1.
Fig 6
Fig 6. Transcriptomic alterations in CB deficient round spermatids.
(A) Volcano plot showing the global transcriptional changes in Tdrd6-/- vs. Tdrd6+/- round spermatids. Each dot represents one transcript. The log2 fold change in Tdrd6-/- versus Tdrd6+/- is represented on the y-axis. Transcripts that differ significantly (p-value < 0.05; shown as negative log10 on the x-axis) between the conditions Tdrd6-/- and Tdrd6+/- are represented with blue dots. (B) Dot plot showing the distribution of fold change of transcripts in Tdrd6-/- versus Tdrd6+/- (y axis; log2 values) for the significantly differentially expressed transcripts by 3’ UTR length (x axis; length given in nucleotides).
Fig 7
Fig 7. UPF1 and UPF2 association with mRNAs.
(A) RT-PCR analysis of long 3‘UTR mRNAs i.e. Spen, Diap1, Mdc1, Ube2c, Twsg1, Dixdc1, Daam1 and Yap1 in UPF1-immunoprecipitated RNA from Tdrd6+/- round spermatids. RNAs were immunoprecipitated from round spermatids lysate either with irrelevant goat IgG (lane 3) of anti-UPF1 (lane 4). RNA was isolated from the total lysate (lane 1) and reverse transcribed except from lane 2. (B) RT-qPCR analysis of Spen (i), Mdc1 (ii), Diap1 (iii), Ube2c (iv), Twsg1 (v) Dixdc1 (vi), Daam1 (vii) and Yap1 (viii) in UPF1-immunoprecipitated RNA from Tdrd6+/- (blue bars) and Tdrd6-/- (red bars) round spermatids. Bars represent the fold enrichment (mean and standard deviation (SD) n = 3) of different mRNA species isolated by anti-UPF1 RIP over the control RIP from Tdrd6+/- and Tdrd6-/- round spermatids after normalization to the respective input. (C) RT-qPCR analysis Spen, Mdc1, Diap1, Ube2c, Twsg1, Dixdc1, Daam1 and Yap1 mature mRNA expression in Tdrd6+/- (blue bars) and Tdrd6-/- (red bars) round spermatids. Results are presented in terms of a fold change after normalizing mRNA levels with β-actin mRNA level. Each value represents the mean of three independent experiments. (D) RT-qPCR analysis Spen, Mdc1, Diap1, Ube2c, Twsg1, Dixdc1, Daam1 and Yap1 pre mRNA expression in Tdrd6+/- (blue bars) and Tdrd6-/- (red bars) round spermatids. Results are presented in terms of a fold change after normalizing mRNA levels with β-actin mRNA level. Each value represents the mean of three independent experiments. (E) RT-PCR analysis of long 3‘UTR mRNAs i.e. Spen, Diap1, Mdc1, Ube2c, Dixdc1 and Yap1 in UPF2-immunoprecipitated RNA from Tdrd6+/- round spermatids. RNAs were immunoprecipitated from round spermatids lysate either with irrelevant goat IgG (lane 3) of anti-UPF1 (lane 4). RNA was isolated from the total lysate (lane 1) and reverse transcribed except from lane 2. (F) RT-qPCR analysis of Spen (i), Mdc1 (ii), Diap1 (iii), Ube2c (iv), Dixdc1 (v) and Yap1 (vi) in UPF2-immunoprecipitated RNA from Tdrd6+/- (blue bars) and Tdrd6-/- (red bars) round spermatids. Bars represent the fold enrichment (mean and standard deviation (SD) n = 2) of different mRNA species isolated by anti-UPF1 RIP over the control RIP from Tdrd6+/- and Tdrd6-/- round spermatids after normalization to the respective input. * significant at p value<0.1, ** significant at p value<0.05, *** significant at p value<0.01, ns not significant p value>0.1.
Fig 8
Fig 8. Polysome fractionation and assessment of mRNA translational potential.
(A) Graph line showing the UV absorbance at 254nm of testis lysates from Tdrd6+/- (left) and Tdrd6-/- (right) mice (26 dpp) after centrifugation on a linear 15%-40% sucrose gradient. y-axis: UV absorbance in arbitrary units, x-axis: collected fractions. Representative graphs from 2 independent experiments; each sample consisted of cell preparations from 2 mice of each genotype. (B) Immunoblot analysis of the distribution of RPS6, GAPDH, MVH and UPF1 proteins along the fractions. (C) RT-PCR analysis of Spen mRNA distribution along the fractions. Representative image from 3 technical replicates of 2 biologically independent experiments. (D) Quantification of assays presented in (C). Spen mRNA signals in Tdrd6+/- (blue bars) and Tdrd6-/- (red bars) fractions were normalized to β-actin mRNA signals and relative abundances are presented as % of total levels.

Comment in

Similar articles

Cited by

References

    1. Chalmel F, Lardenois A, Primig M (2007) Toward understanding the core meiotic transcriptome in mammals and its implications for somatic cancer. Ann N Y Acad Sci 1120: 1–15. - PubMed
    1. Burgoyne PS, Mahadevaiah SK, Turner JM (2009) The consequences of asynapsis for mammalian meiosis. Nat Rev Genet 10: 207–216. 10.1038/nrg2505 - DOI - PubMed
    1. Rathke C, Baarends WM, Awe S, Renkawitz-Pohl R (2014) Chromatin dynamics during spermiogenesis. Biochim Biophys Acta 1839: 155–168. 10.1016/j.bbagrm.2013.08.004 - DOI - PubMed
    1. Kotaja N (2014) MicroRNAs and spermatogenesis. Fertil Steril 101: 1552–1562. 10.1016/j.fertnstert.2014.04.025 - DOI - PubMed
    1. Schmid R, Grellscheid SN, Ehrmann I, Dalgliesh C, Danilenko M, et al. (2013) The splicing landscape is globally reprogrammed during male meiosis. Nucleic Acids Res 41: 10170–10184. 10.1093/nar/gkt811 - DOI - PMC - PubMed

Publication types

MeSH terms