

The Diagnostic Value of Gastrin-17 Detection in Atrophic Gastritis: A Meta-Analysis
- PMID: 27149493
- PMCID: PMC4863810
- DOI: 10.1097/MD.0000000000003599
The Diagnostic Value of Gastrin-17 Detection in Atrophic Gastritis: A Meta-Analysis
Abstract
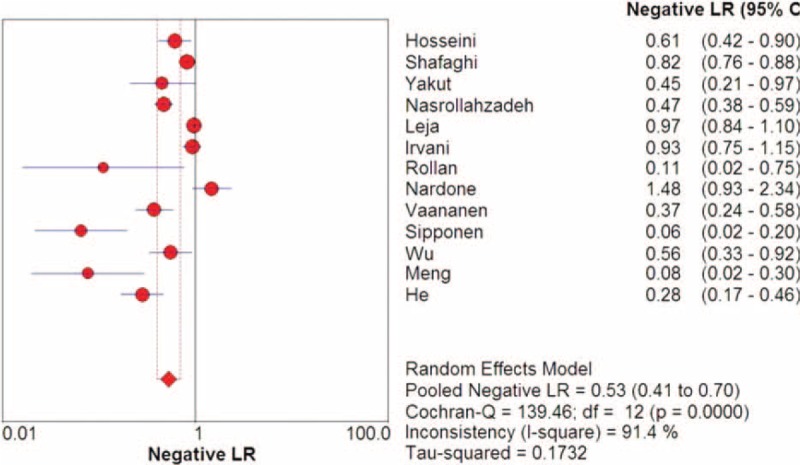
A meta-analysis was performed to assess the diagnostic value of gastrin-17 (G-17) for the early detection of chronic atrophic gastritis (CAG).An extensive literature search was performed, with the aim of selecting publications that reported the accuracy of G-17 in predicting CAG, in the following databases: PubMed, Science Direct, Web of Science, Chinese Biological Medicine, Chinese National Knowledge Infrastructure, Wanfang, and VIP. To assess the diagnostic value of G-17, the following statistics were estimated and described: sensitivity, specificity, diagnostic odds ratios (DOR), summary receiver operating characteristic curves, area under the curve (AUC), and 95% confidence intervals (CIs).Thirteen studies that met the inclusion criteria were included in this meta-analysis, comprising 894 patients and 1950 controls. The pooled sensitivity and specificity of these studies were 0.48 (95% CI: 0.45-0.51) and 0.79 (95% CI: 0.77-0.81), respectively. The DOR was 5.93 (95% CI: 2.93-11.99), and the AUC was 0.82.G-17 may have potential diagnostic value because it has good specificity and a moderate DOR and AUC for CAG. However, more studies are needed to improve the sensitivity of this diagnostic tool in the future.
Conflict of interest statement
The authors have no funding and conflicts of interest to disclose.
Figures


Similar articles
-
Identification of non-invasive biomarkers for chronic atrophic gastritis from serum exosomal microRNAs.BMC Cancer. 2019 Feb 8;19(1):129. doi: 10.1186/s12885-019-5328-7. BMC Cancer. 2019. PMID: 30736753 Free PMC article.
-
Prevalence of atrophic gastritis in southwest China and predictive strength of serum gastrin-17: A cross-sectional study (SIGES).Sci Rep. 2020 Mar 11;10(1):4523. doi: 10.1038/s41598-020-61472-7. Sci Rep. 2020. PMID: 32161305 Free PMC article.
-
A novel nomogram for predicting the morbidity of chronic atrophic gastritis based on serum CXCL5 levels.BMC Cancer. 2025 Jan 10;25(1):63. doi: 10.1186/s12885-024-13394-0. BMC Cancer. 2025. PMID: 39794766 Free PMC article.
-
Diagnostic value of neutrophil gelatinase-associated lipocalin for early diagnosis of cardiac surgery-associated acute kidney injury: a meta-analysis.Eur J Cardiothorac Surg. 2016 Mar;49(3):746-55. doi: 10.1093/ejcts/ezv199. Epub 2015 Jun 20. Eur J Cardiothorac Surg. 2016. PMID: 26094017 Review.
-
Systematic review and meta-analysis based on the composition of risk factors of chronic atrophic gastritis under gastroscopy detection.Ann Palliat Med. 2021 Sep;10(9):9742-9751. doi: 10.21037/apm-21-2063. Ann Palliat Med. 2021. PMID: 34628900
Cited by
-
Screening for gastric cancer in China: Advances, challenges and visions.Chin J Cancer Res. 2021 Apr 30;33(2):168-180. doi: 10.21147/j.issn.1000-9604.2021.02.05. Chin J Cancer Res. 2021. PMID: 34158737 Free PMC article.
-
Mechanism of Weiwei granules in the treatment of chronic active Helicobacter pylori gastritis with atrophy based on the TLR4/NF-κB/COX-2 inflammatory signaling pathway.Histol Histopathol. 2024 Jun;39(6):761-769. doi: 10.14670/HH-18-679. Epub 2023 Nov 23. Histol Histopathol. 2024. PMID: 38031901 Clinical Trial.
-
Assessment of Serum Pepsinogens with and without Co-Testing with Gastrin-17 in Gastric Cancer Risk Assessment-Results from the GISTAR Pilot Study.Diagnostics (Basel). 2022 Jul 19;12(7):1746. doi: 10.3390/diagnostics12071746. Diagnostics (Basel). 2022. PMID: 35885649 Free PMC article.
-
Chronic atrophic gastritis: an update on diagnosis.Med Pharm Rep. 2021 Jan;94(1):7-14. doi: 10.15386/mpr-1887. Epub 2021 Jan 29. Med Pharm Rep. 2021. PMID: 33629042 Free PMC article. Review.
-
Correlation between serum levels of cyclooxygenase-2, aquaporin-1, pepsinogen I, gastrin-17 and pathological features of Laryngeal Cancer.Pak J Med Sci. 2024 Dec;40(11):2675-2680. doi: 10.12669/pjms.40.11.10417. Pak J Med Sci. 2024. PMID: 39634909 Free PMC article.
References
-
- Siegel R, Naishadham D, Jemal A. Cancer statistics, 2013. CA: Cancer J Clin 2013; 6:11–30. - PubMed
-
- De Martel C, Forman D, Plummer M. Gastric cancer: epidemiology and risk factors. Gastroenterol Clin North Am 2013; 42:219–240. - PubMed
-
- Weck MN, Brenner H. Prevalence of chronic atrophic gastritis in different parts of the world. Cancer Epidemiol Biomarkers Prevent 2006; 15:1083–1094. - PubMed
-
- Kuipers EJ, Klinkenberg-Knol EC, Vandenbroucke-Grauls CM, et al. Role of Helicobacter pylori in the pathogenesis of atrophic gastritis. Scand J Gastroenterol Suppl 1996; 223:28–34. - PubMed
Publication types
MeSH terms
Substances
LinkOut - more resources
Full Text Sources
Other Literature Sources
Miscellaneous
