Pathogen Propagation Model with Superinfection in Vegetatively Propagated Plants on Lattice Space
- PMID: 27149510
- PMCID: PMC4858194
- DOI: 10.1371/journal.pone.0154883
Pathogen Propagation Model with Superinfection in Vegetatively Propagated Plants on Lattice Space
Abstract
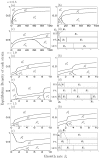
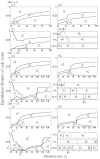
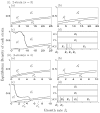
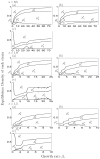
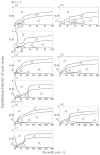
Many clonal plants have two reproductive patterns, seed propagation and vegetative propagation. By vegetative propagation, plants reproduce the genetically identical offspring with a low mortality, because resources are supplied from the other individuals through interconnected ramets at vegetative-propagated offspring. However, the ramets transport not only resources but also systemic pathogen. Pathogens evolve to establish and spread widely within the plant population. The superinfection, which is defined as the ability that an established pathogen spreads widely by infecting to already-infected individuals with other strains of a pathogen, is important to the evolution of pathogens. We examine the dynamics of plant reproduction and pathogen propagation considering spatial structure and the effect of superinfection on genetic diversity of pathogen by analysis of several models, 1-strain and multiple-strain models, on two-dimensional square lattice. In the analysis of 1-strain model, we derive equilibrium value by mean-field approximation and pair approximation, and its local stability by Routh-Hurwitz stability criterion. In the multiple-strain models, we analyze the dynamics by numerical simulation of mean-field approximation, pair approximation and Monte Carlo simulation. Through the analyses, we show the effect of parameter values to dynamics of models, such as transition of dominant strain of pathogen, competition between plants and pathogens and density of individuals. As a result, (i) The strain with intermediate cost becomes dominant when both superinfection rate and growth rate are low. (ii) The competition between plants and pathogens occurs in the phase of coexistence of various strains by pair approximation and Monte Carlo simulation. (iii) Too high growth rate leads to the decrease of plant population in all models. (iv) Pathogens are easy to maintain their genetic diversity with low superinfection rate. However, if they do not superinfect, the maintenance becomes difficult. (v) When growth rate of plant is low, individuals are very influenced by distant individuals.
Conflict of interest statement
Figures





Similar articles
-
The analysis of an effect of seed propagation on defense strategy against pathogen transmission within clonal plant population using lattice model.J Theor Biol. 2017 Aug 1;427:65-76. doi: 10.1016/j.jtbi.2017.05.001. Epub 2017 May 15. J Theor Biol. 2017. PMID: 28522357
-
Evolution of almond genetic diversity and farmer practices in Lebanon: impacts of the diffusion of a graft-propagated cultivar in a traditional system based on seed-propagation.BMC Plant Biol. 2018 Aug 6;18(1):155. doi: 10.1186/s12870-018-1372-8. BMC Plant Biol. 2018. PMID: 30081821 Free PMC article.
-
Spatially structured superinfection and the evolution of disease virulence.Theor Popul Biol. 2006 Jun;69(4):367-84. doi: 10.1016/j.tpb.2005.12.004. Epub 2006 Jan 26. Theor Popul Biol. 2006. PMID: 16442579
-
Evolutionary and Epidemiological Implications of Multiple Infection in Plants.Trends Plant Sci. 2016 Jan;21(1):80-90. doi: 10.1016/j.tplants.2015.10.014. Epub 2015 Dec 2. Trends Plant Sci. 2016. PMID: 26651920 Review.
-
Experimental measures of pathogen competition and relative fitness.Annu Rev Phytopathol. 2013;51:131-53. doi: 10.1146/annurev-phyto-082712-102302. Epub 2013 Jun 13. Annu Rev Phytopathol. 2013. PMID: 23767846 Review.
References
-
- Slade AJ, Hutchings MJ. Clonal integration and plasticity in foraging behaviour in Glechoma hederacea. The Journal of Ecology. 1987: 1023–1036. 10.2307/2260311 - DOI
-
- Marshall C. Sectoriality and physiological organisation in herbaceous plants: an overview. Vegetatio. 1996;127(1): 9–16. 10.1007/BF00054842 - DOI
-
- Stuefer JF, Gómez S, Van Mölken T. Clonal integration beyond resource sharing: implications for defence signalling and disease transmission in clonal plant networks. Evolutionary Ecology. 2004;18(5–6): 647–667. 10.1007/s10682-004-5148-2 - DOI
-
- Gibbs A, Harrison B. Effects of viruses on plants. Edward Arnold, London: 1976.
-
- Jones R. Further studies on losses in productivity caused by infection of annual pasture legumes with three viruses. Crop and Pasture Science. 1992;43(5): 1229–1241. 10.1071/AR9921229 - DOI
Publication types
MeSH terms
LinkOut - more resources
Full Text Sources
Other Literature Sources
Research Materials

