

Influenza Virus Affects Intestinal Microbiota and Secondary Salmonella Infection in the Gut through Type I Interferons
- PMID: 27149619
- PMCID: PMC4858270
- DOI: 10.1371/journal.ppat.1005572
Influenza Virus Affects Intestinal Microbiota and Secondary Salmonella Infection in the Gut through Type I Interferons
Abstract
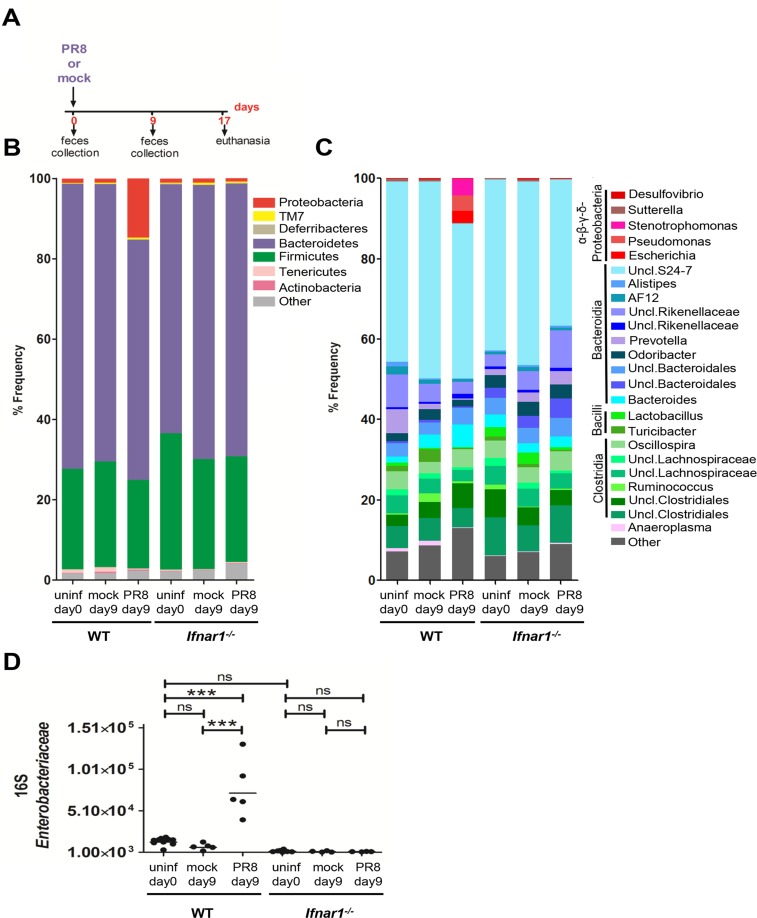
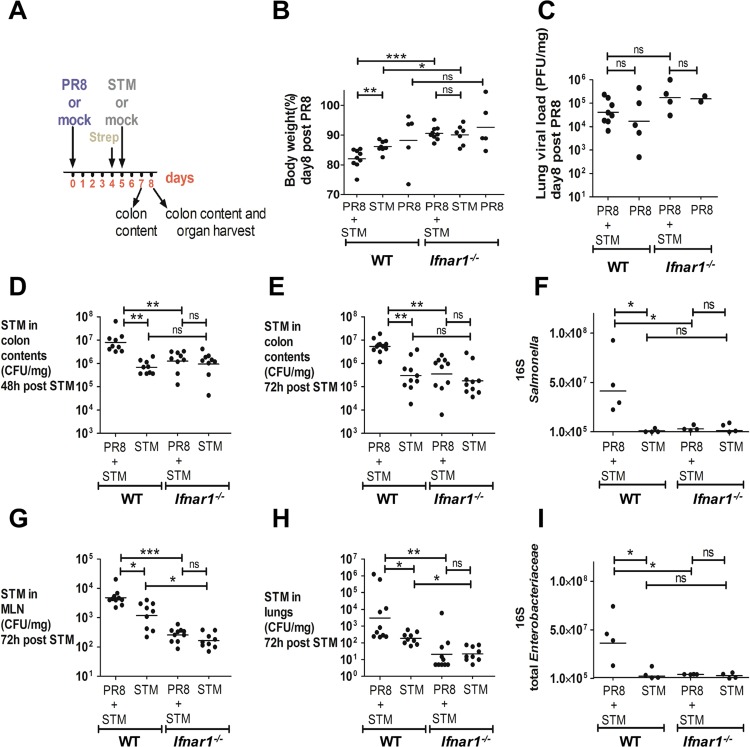
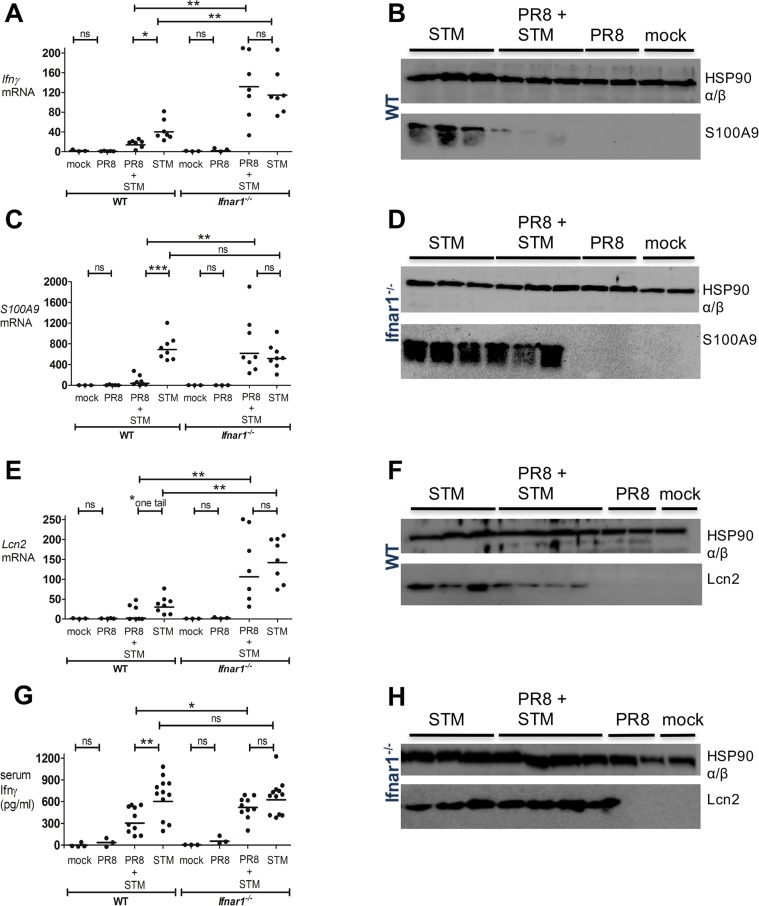
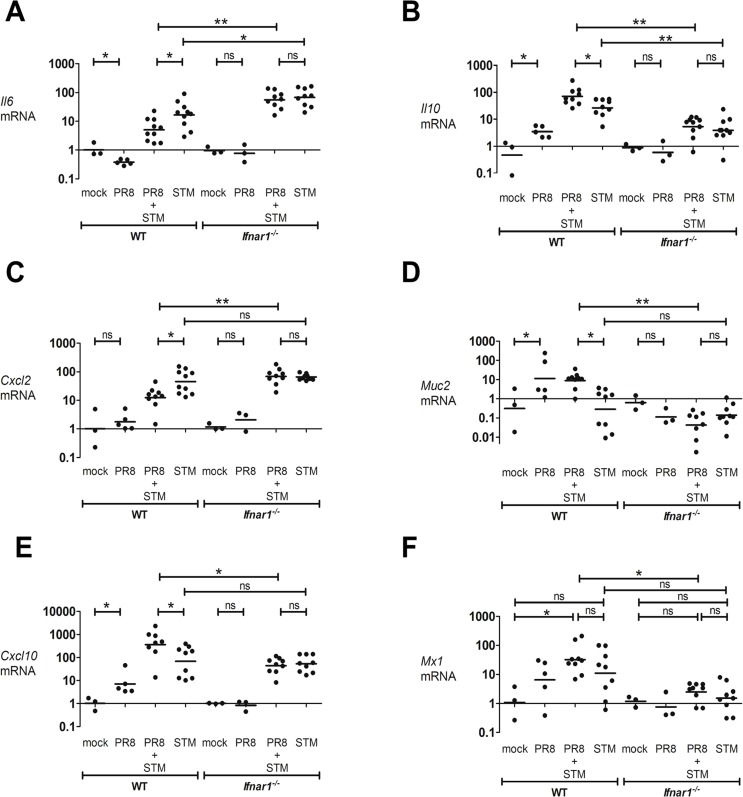
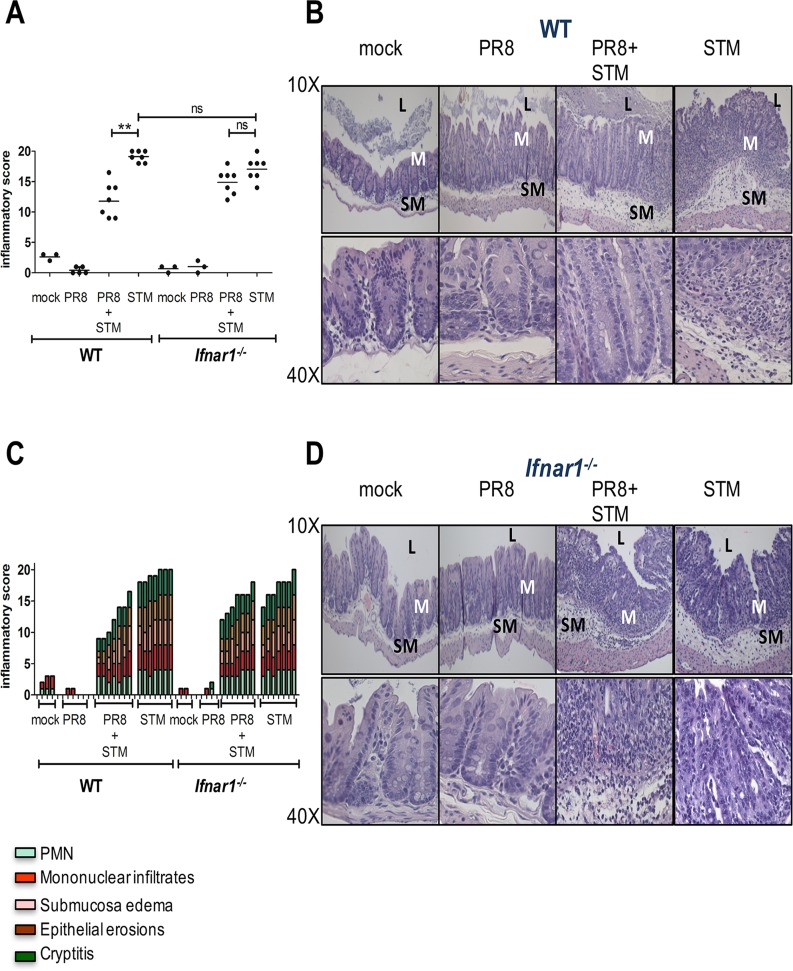
Human influenza viruses replicate almost exclusively in the respiratory tract, yet infected individuals may also develop gastrointestinal symptoms, such as vomiting and diarrhea. However, the molecular mechanisms remain incompletely defined. Using an influenza mouse model, we found that influenza pulmonary infection can significantly alter the intestinal microbiota profile through a mechanism dependent on type I interferons (IFN-Is). Notably, influenza-induced IFN-Is produced in the lungs promote the depletion of obligate anaerobic bacteria and the enrichment of Proteobacteria in the gut, leading to a "dysbiotic" microenvironment. Additionally, we provide evidence that IFN-Is induced in the lungs during influenza pulmonary infection inhibit the antimicrobial and inflammatory responses in the gut during Salmonella-induced colitis, further enhancing Salmonella intestinal colonization and systemic dissemination. Thus, our studies demonstrate a systemic role for IFN-Is in regulating the host immune response in the gut during Salmonella-induced colitis and in altering the intestinal microbial balance after influenza infection.
Conflict of interest statement
The authors have declared that no competing interests exist.
Figures
Similar articles
-
The microbial metabolite desaminotyrosine protects from influenza through type I interferon.Science. 2017 Aug 4;357(6350):498-502. doi: 10.1126/science.aam5336. Science. 2017. PMID: 28774928 Free PMC article.
-
Synergistic stimulation of type I interferons during influenza virus coinfection promotes Streptococcus pneumoniae colonization in mice.J Clin Invest. 2011 Sep;121(9):3657-65. doi: 10.1172/JCI57762. Epub 2011 Aug 15. J Clin Invest. 2011. PMID: 21841308 Free PMC article.
-
Signals from intestinal microbiota mediate the crosstalk between the lung-gut axis in an influenza infection mouse model.Front Immunol. 2024 Jul 23;15:1435180. doi: 10.3389/fimmu.2024.1435180. eCollection 2024. Front Immunol. 2024. PMID: 39114658 Free PMC article.
-
Porcine innate and adaptative immune responses to influenza and coronavirus infections.Ann N Y Acad Sci. 2006 Oct;1081(1):130-6. doi: 10.1196/annals.1373.014. Ann N Y Acad Sci. 2006. PMID: 17135502 Free PMC article. Review.
-
Type I IFN exhaustion is a host defence protecting against secondary bacterial infections.Scand J Immunol. 2013 Nov;78(5):395-400. doi: 10.1111/sji.12107. Scand J Immunol. 2013. PMID: 24006947 Free PMC article. Review.
Cited by
-
Anti-influenza A virus activity of two Newtonia species and the isolated compound myricetin-3-o-rhamnoside.BMC Complement Med Ther. 2021 Mar 16;21(1):92. doi: 10.1186/s12906-021-03250-0. BMC Complement Med Ther. 2021. PMID: 33726731 Free PMC article.
-
Avian influenza and gut microbiome in poultry and humans: A "One Health" perspective.Fundam Res. 2023 Dec 27;4(3):455-462. doi: 10.1016/j.fmre.2023.10.016. eCollection 2024 May. Fundam Res. 2023. PMID: 38933214 Free PMC article. Review.
-
Influenza Virus Infection Impairs the Gut's Barrier Properties and Favors Secondary Enteric Bacterial Infection through Reduced Production of Short-Chain Fatty Acids.Infect Immun. 2021 Aug 16;89(9):e0073420. doi: 10.1128/IAI.00734-20. Epub 2021 Aug 16. Infect Immun. 2021. PMID: 33820816 Free PMC article.
-
Progression and Trends in Virus from Influenza A to COVID-19: An Overview of Recent Studies.Viruses. 2021 Jun 15;13(6):1145. doi: 10.3390/v13061145. Viruses. 2021. PMID: 34203647 Free PMC article. Review.
-
The Clinical Impact of Cirrhosis on the Hospital Outcomes of Patients Admitted With Influenza Infection: Propensity Score Matched Analysis of 2011-2017 US Hospital Data.J Clin Exp Hepatol. 2021 Sep-Oct;11(5):531-543. doi: 10.1016/j.jceh.2021.01.005. Epub 2021 Feb 4. J Clin Exp Hepatol. 2021. PMID: 34511813 Free PMC article.
References
-
- Doyle S, Vaidya S, O'Connell R, Dadgostar H, Dempsey P, Wu T, et al. IRF3 mediates a TLR3/TLR4-specific antiviral gene program. Immunity. 2002;17(3):251–63. Epub 2002/10/02. . - PubMed
-
- Tough DF, Borrow P, Sprent J. Induction of bystander T cell proliferation by viruses and type I interferon in vivo. Science. 1996;272(5270):1947–50. Epub 1996/06/28. . - PubMed
Publication types
MeSH terms
Substances
Associated data
Grants and funding
LinkOut - more resources
Full Text Sources
Other Literature Sources
Molecular Biology Databases
