. 2016 May 5;11(5):e0154415.
doi: 10.1371/journal.pone.0154415. eCollection 2016.

Insulin Signaling in Insulin Resistance States and Cancer: A Modeling Analysis

Affiliations

Insulin Signaling in Insulin Resistance States and Cancer: A Modeling Analysis

Alessandro Bertuzzi et al. PLoS One. .

Abstract

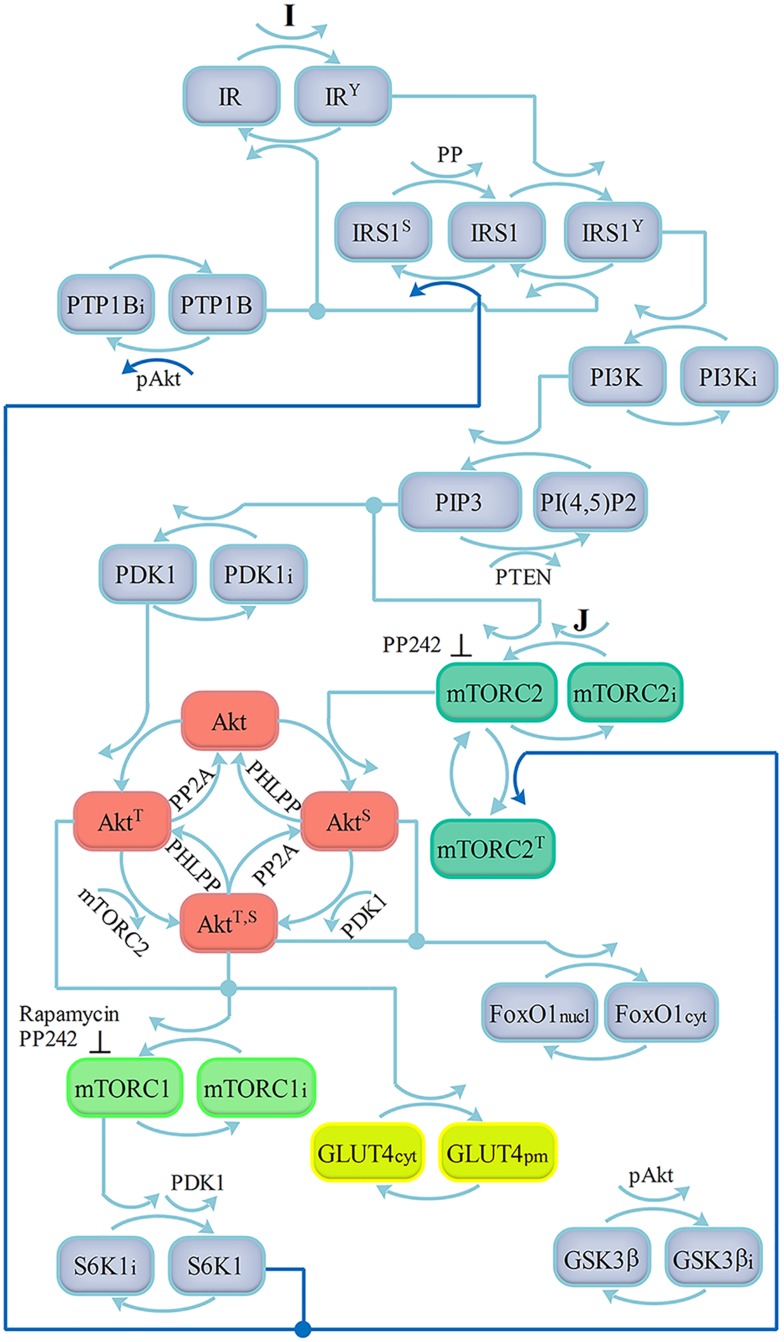
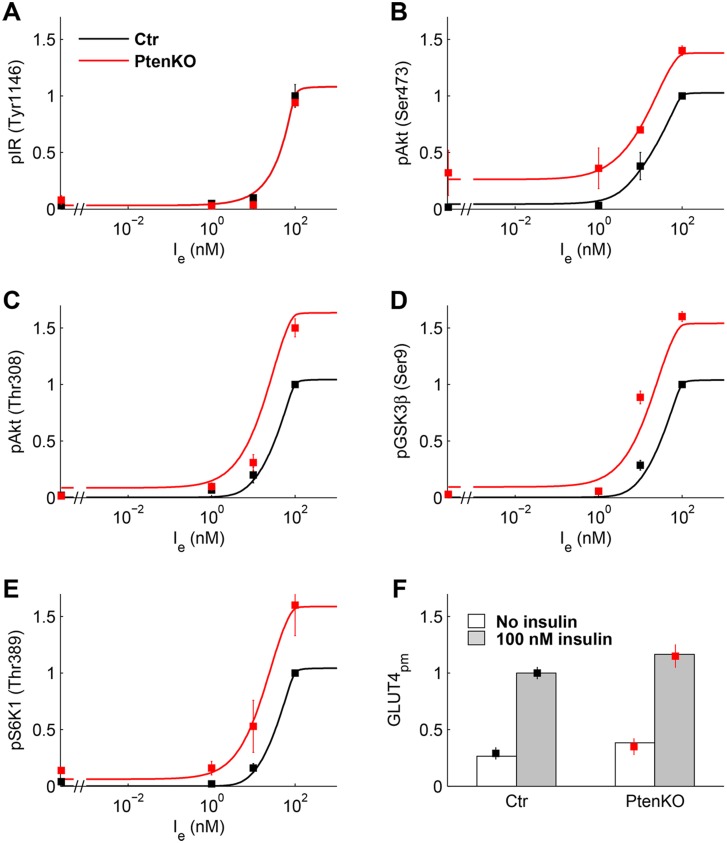
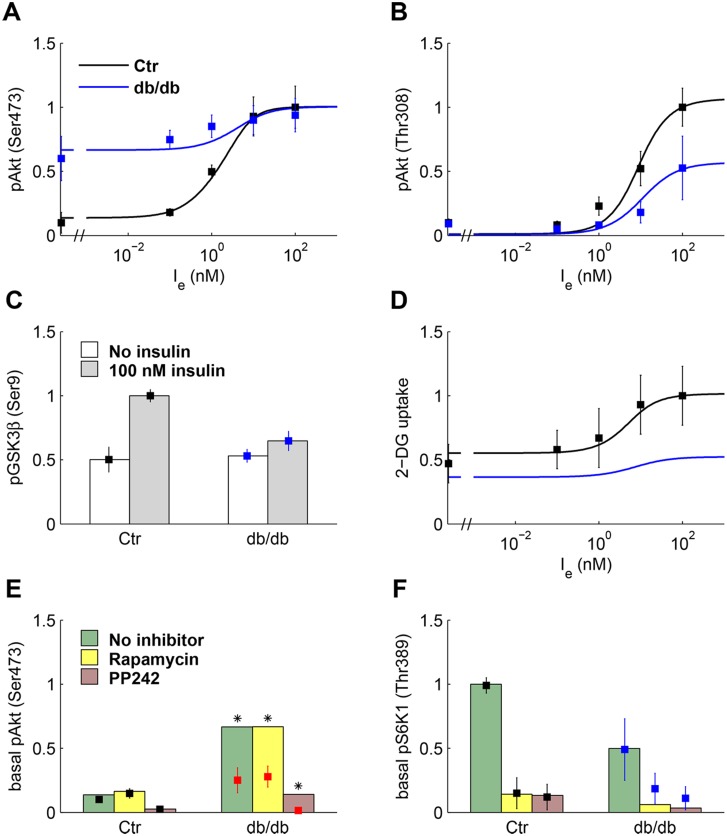
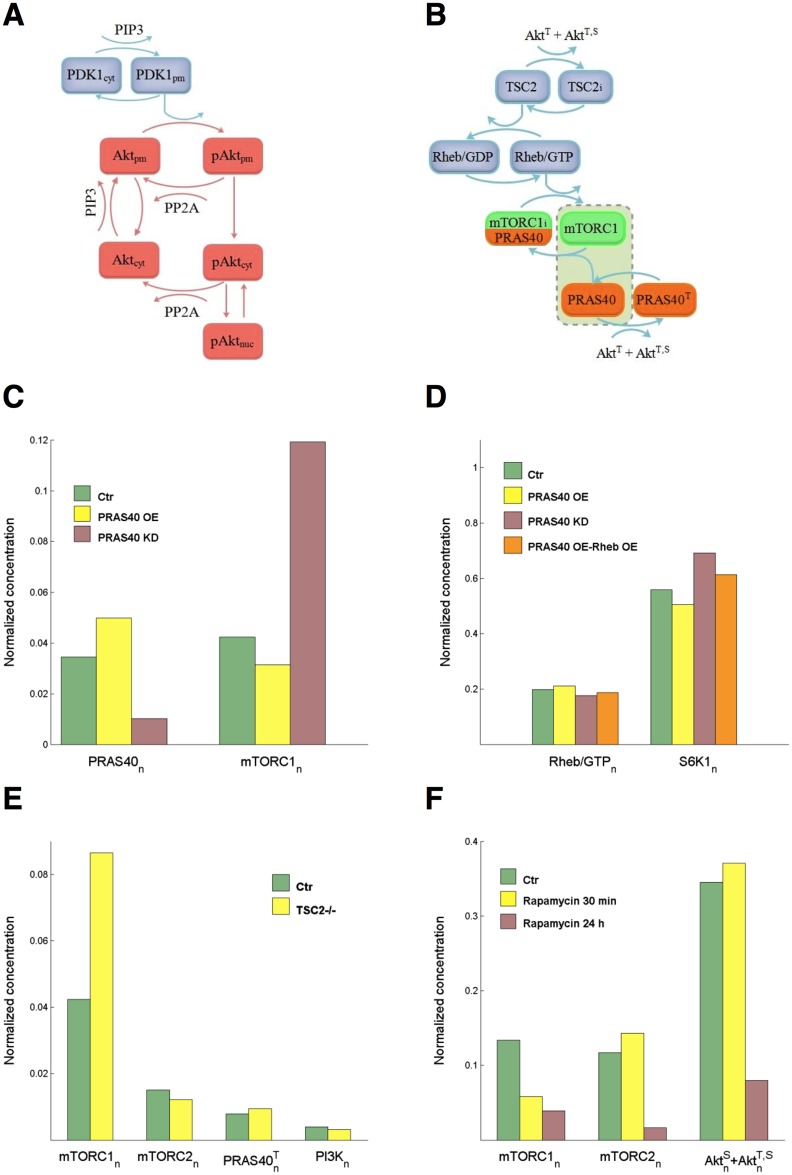
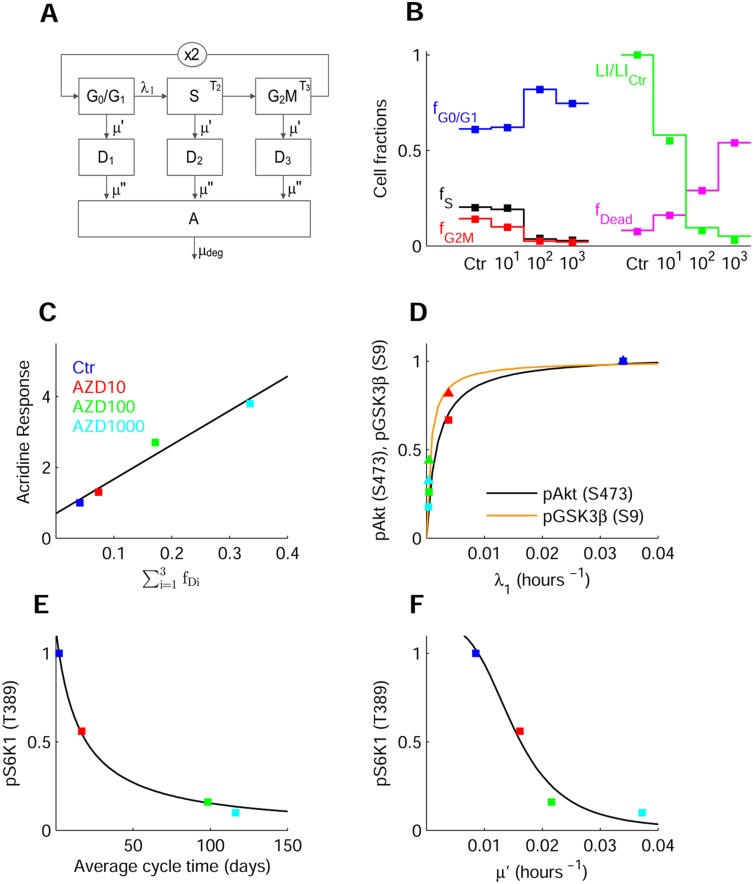
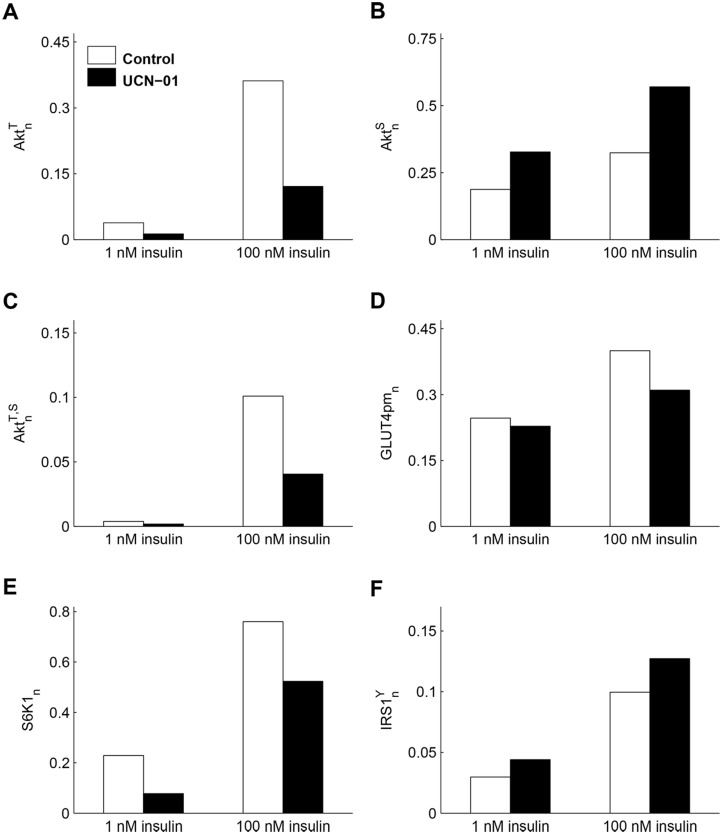
Insulin resistance is the common denominator of several diseases including type 2 diabetes and cancer, and investigating the mechanisms responsible for insulin signaling impairment is of primary importance. A mathematical model of the insulin signaling network (ISN) is proposed and used to investigate the dose-response curves of components of this network. Experimental data of C2C12 myoblasts with phosphatase and tensin homologue (PTEN) suppressed and data of L6 myotubes with induced insulin resistance have been analyzed by the model. We focused particularly on single and double Akt phosphorylation and pointed out insulin signaling changes related to insulin resistance. Moreover, a new characterization of the upstream signaling of the mammalian target of rapamycin complex 2 (mTORC2) is presented. As it is widely recognized that ISN proteins have a crucial role also in cell proliferation and death, the ISN model was linked to a cell population model and applied to data of a cell line of acute myeloid leukemia treated with a mammalian target of rapamycin inhibitor with antitumor activity. The analysis revealed simple relationships among the concentrations of ISN proteins and the parameters of the cell population model that characterize cell cycle progression and cell death.


Conflict of interest statement

Competing Interests: The authors have declared that no competing interests exist.

Figures

Fig 1
Fig 1. Scheme of the insulin signaling network.
Activation by insulin (I) of insulin receptor (IR) catalyzes tyrosine phosphorylation of IRS1. Phosphorylated IRS1 binds the p85 regulatory subunit of PI3K, activating the p110 catalytic subunit. PI3K mediates phosphorylation of PI(4,5)-bisphosphate (PIP2) to PI (3,4,5)-trisphoshpate (PIP3) near plasma membrane (PM) and the phosphatase and tensin homologue (PTEN) dephosphorylates PIP3 back to PIP2. PIP3 recruits Akt and PDK1 to PM, where PDK1 phosphorylates Akt at Thr308 (phosphatase PP2A). mTORC2 is activated by PIP3 and by the factor J, and catalyzes Akt phosphorylation on Ser473 (phosphatase PHLPP). Maximal Akt activity is achieved when the molecule is phosphorylated on both Thr308 and Ser473 residues, allowing translocation of GLUT4 glucose transporters to PM. GSK3 and FoxO1 are direct Akt substrates. Akt also activates mTORC1, which in turn activates S6K1. Activated S6K1 phosphorylates IRS1 and Rictor in negative feedback loops. The positive feedback loop from Akt to PTP1B is also included. Feedback loops are represented by bold lines.
Fig 2
Fig 2. Experimental data of C2C12 myoblast cells and model fitting.
Data (mean ± SEM) replotted from Ref [32] for control (black squares) and PTEN-suppressed (red squares) cells. Solid lines are the dose-response curves predicted by the model for control (black) and PTEN-suppressed cells (red). (A) Relative pIR(Tyr1146). (B, C) Relative pAkt(Ser473) and pAkt(Thr308). (D) Relative pGSK3β(Ser9). (E) Relative pS6K1(Thr389). (F) Relative GLUT4 at PM at zero (white box) and 100 nM (gray box) insulin.
Fig 3
Fig 3. Experimental data of L6 myotubes and model fitting.
Data (mean ± SD) replotted from Ref [11] except panel D from Ref [34]. Data (squares) and model fitting (solid lines) plotted in black for control and in blue for cells exposed to conditioned (db/db) medium. (A, B) Relative pAkt(Ser473) and pAkt(Thr308). (C) Relative pGSK3β(Ser9) at zero (white box) and 100 nM (gray box) insulin. (D) Relative 2-DG uptake in rat L6 myoblasts. (E) Relative pAkt(Ser473) at zero insulin in control (black) and cells exposed to db/db medium (red), in the absence of inhibition and in cells treated with rapamycin (50 nM) and PP242 (500 nM). The red color indicates that experimental values do not preserve the increase in basal pAkt(Ser473) from control to db/db medium in the absence of inhibition, and asterisks point out that these data were not used in model fitting. Green (no inhibitor), yellow (rapamycin), and pink boxes (PP242) represent model fitting. (F) Relative pS6K1(Thr389) at zero insulin in the absence of inhibition and in treated cells (the boxes represent model fitting).
Fig 4
Fig 4. Improved modeling of Akt and mTOR.
(A) PIP3 recruits PDK1 and Akt to the plasma membrane. At the PM, Akt is phosphorylated by PDK1 and dephosphorylated by PP2A. Transport of not yet phosphorylated Akt from PM back to cytosol is regulated by the rate constant k−13. Phosphorylated Akt is transported to cytosol (rate constant kmc) where it is dephosphorylated by PP2A or imported into the nucleus (kcn). Export from nucleus is regulated by knc. (B) Phosphorylated Akt inactivates TSC2. Active TSC2 promotes Rheb binding to GDP and TSC2 inactivation stimulates the conversion from Rheb/GDP to active Rheb/GTP, which in turn activates mTORC1. mTORC1 is also inhibited by PRAS40. The box including active mTORC1 and proline-rich Akt substrate of 40 kDa (PRAS40) accounts for reaction (3) in S1 File (Text S3). (C) PRAS knockdown (KD: KmTOR increased tenfold compared to control and φ = 0.7, pink boxes) and overexpression (OE: KmTOR halved compared to control and φ = −5/6, yellow boxes) and effect on mTORC1 activation at 1 nM insulin. (D) Normalized concentrations Rheb/GTP and of T389 S6K1 at 1 nM insulin with PRAS knockdown (tenfold bPRAS decrease, pink boxes), PRAS overexpression (twofold bPRAS increase, yellow boxes), and with both PRAS (twofold bPRAS increase) and Rheb (fivefold bRheb increase) overexpression (orange boxes). (E) Normalized protein concentrations in TSC2-null cells at 1 nM insulin. (F) Response to short-term and long-term rapamycin treatment of mTORC1 and mTORC2, and effect on Akt phosphorylation at 10 nM insulin. Short- and long-term treatments: KmTOR in Eq (14) of S1 File (Text S3) set to 0.1 of control. Long-term-treatment: parameters a15ε, a19ε and a19γ of Akt Eqs (9)–(11) set to 0.1 of control.
Fig 5
Fig 5. Response of AML cell population to mTOR inhibitor with antitumor activity.
(A) Scheme of model used for the analysis of AML cell population data in the absence and presence of AZD8055. The blocks represent G0/G1, S and G2M cells, with the ×2 block denoting binary cell division. λ1 is the rate constant of G1S transition, T2 and T3 the transit times in S and G2M phases, and μ′ the rate constant of cell loss. D1–D3 represent cells lost from viable compartments but still measurable, and A the apoptotic bodies and fragments, with μ′′ the rate constant of cell fragmentation. (B) Data, replotted from Ref [44], of cell fractions in cell cycle phases in control and cells treated with 10, 100, and 1000 nM AZD8055 (closed squares), and model fitting (solid lines). The panel also displays data and fitting of LI normalized to control, and of total fraction of dead cells and fragments. (C) Correlation between data of acridine orange staining in A549 cells, replotted from Ref [43], and fraction of dead cells i = 13fDi . (D) Relationship between the decrease of pAkt(Ser473) (squares) and that of λ1 at increasing drug concentrations. Fitting line y = 1.03x/(0.18·10−2+x), with y = pAkt(Ser473) and x = λ1. A similar function fits the relation between GSK3β(Ser9) (triangles) and λ1. Data are normalized to control and represented with the color code in panel C. (E) Decrease of normalized pS6K1(Thr389) with drug concentration and relation with the average cell cycle time Tc = 1/λ1+T2+T3 predicted by the cell population model. Fitting line y = 17.71/(15.61+x). (F) Decrease of pS6K1(Thr389) with the drug concentration and relation with the parameter μ′ predicted by cell population model. Fitting line y = 3.63·10−7/(3.15·10−7+x3.57).
Fig 6
Fig 6. Response of the insulin signaling network to the Akt inhibitor UCN-01 in L6 cells.
(A- C) Model predictions of AktnT, AktnS, and AktnT,S at 1 and 100 nM insulin in control (white boxes) and in cells exposed to UCN-01 (black boxes), obtained by a tenfold decrease of the PDK1 parameter a9. The plots show the marked decrease of AktnT and AktnT,S, with the resulting increase in AktnS in treated cells compared to control. (D) The model prediction of GLUT4 concentration at plasma membrane highlights the insulin resistance elicited by the drug. (E) S6K1n reduction due to drug action on PDK1. (F) IRS1nY enhancement caused by the weakening of negative feedback.

References

    1. Thong FS, Dugani CB, Klip A. Turning signals on and off: GLUT4 traffic in the insulin-signaling highway. Physiology (Bethesda). 2005; 20: 271–284. - PubMed
    1. Huang J, Manning BD. A complex interplay between Akt, TSC2 and the two mTOR complexes. Biochem Soc Trans. 2009; 37(Pt 1): 217–222. 10.1042/BST0370217 - DOI - PMC - PubMed
    1. Laplante M, Sabatini DM. mTOR signaling in growth control and disease. Cell. 2012; 149(2): 274–293. 10.1016/j.cell.2012.03.017 - DOI - PMC - PubMed
    1. Sarbassov DD, Guertin DA, Ali SM, Sabatini DM. Phosphorylation and regulation of Akt/PKB by the rictor-mTOR complex. Science. 2005; 307(5712): 1098–1101. - PubMed
    1. Stöckli J, Fazakerley DJ, James DE. GLUT4 exocytosis. J Cell Sci. 2011; 124(Pt 24): 4147–4159. 10.1242/jcs.097063 - DOI - PMC - PubMed