. 2016 Jun;23(6):483-94.
doi: 10.1089/cmb.2016.0010. Epub 2016 May 5.

Immunoglobulin Classification Using the Colored Antibody Graph

Affiliations

Immunoglobulin Classification Using the Colored Antibody Graph

Stefano R Bonissone et al. J Comput Biol. 2016 Jun.

Abstract

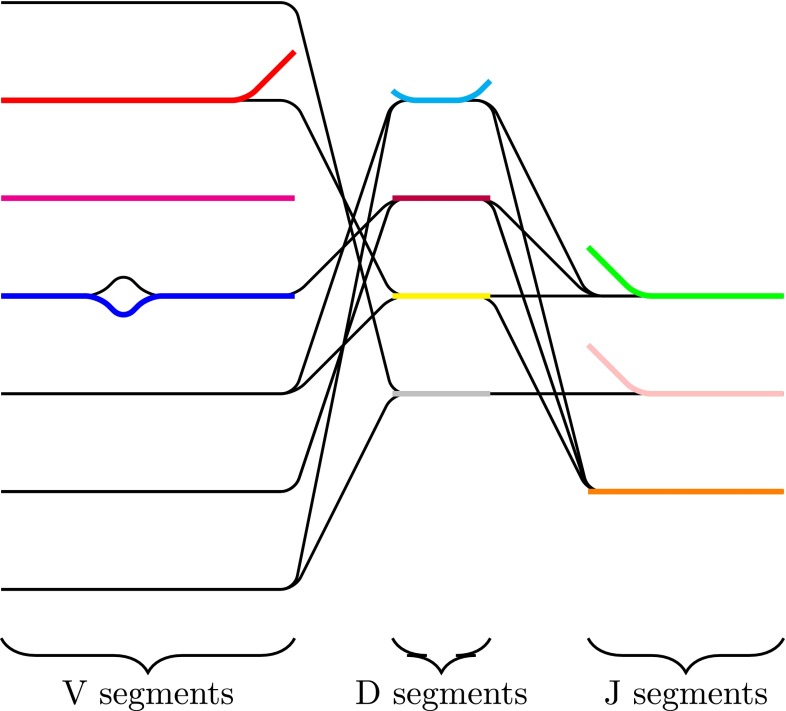
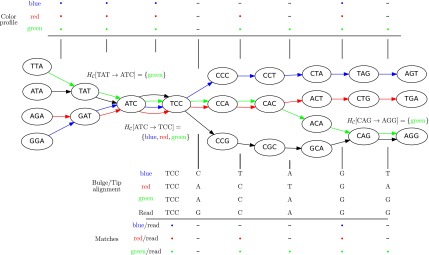
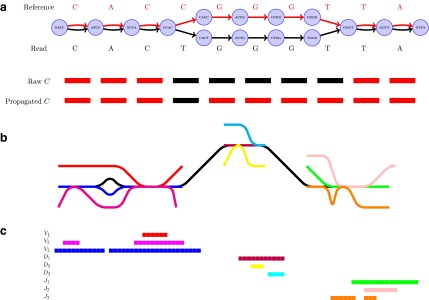
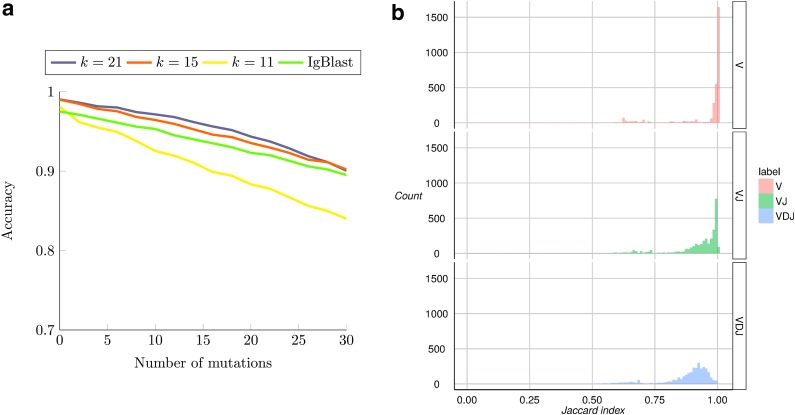
The somatic recombination of V, D, and J gene segments in B-cells introduces a great deal of diversity, and divergence from reference segments. Many recent studies of antibodies focus on the population of antibody transcripts that show which V, D, and J gene segments have been favored for a particular antigen, a repertoire. To properly describe the antibody repertoire, each antibody must be labeled by its constituting V, D, and J gene segment, a task made difficult by somatic recombination and hypermutation events. While previous approaches to repertoire analysis were based on sequential alignments, we describe a new de Bruijn graph-based algorithm to perform VDJ labeling and benchmark its performance.

Keywords: antibody repertoire analysis; de Bruijn graph; immunoglobulin classification.


Figures

<b>FIG. 1.</b>
FIG. 1.
Edit distances between (a) 213 human V gene segments (alleles) and (b) 55 consensus V gene segments. The consensus V gene segments illustrate that, even after collapsing highly similar allelic variants into consensus V gene segments, many of the 55 consensus V gene segments remain similar to each other.
<b>FIG. 2.</b>
FIG. 2.
The canonical antibody graph for different values of formula image (arcs corresponding to the V, D, and J gene segments are colored blue, green, and red, respectively) constructed for all alleles (left) and all consensus gene-segments (right). All nonbranching paths are collapsed to a single arc, and at each junction, a dummy node is created to connect V gene segments to D gene segments, and D gene segments to J gene segments; these arcs are colored black. These graphs are constructed with formula image (a and d), formula image (b and e), and formula image (c and f). Panel (b) shows V, D, and J gene segments completely separated, while (a) shows considerably more sharing of arcs in the V segments, and some shared in the D gene segments. Increasing the value of formula image (c) greatly simplifies the relationship among V gene segments. This is not a feasible parameter for our purposes (as no D segments are captured) but does show the complexity of V gene segments. In the case of formula image, the graph becomes disconnected (and green edges disappear), since it exceeds the length of the longest D gene segment.
<b>FIG. 3.</b>
FIG. 3.
Colored antibody graph. An idealized colored antibody graph built over the reads, with reference gene segments represented as distinct colors. Imperfect overlay of reference gene segments at V/D and D/J segments is common. Also detectable is the divergence of V-segments from their references, helpful in determining differences in CDR1 and CDR2 regions.
<b>FIG. 4.</b>
FIG. 4.
An example antibody graph with three reference segments, colored by red, blue, and green arcs. A single read is shown here with black arcs. The color hash formula image is shown for the three arcs from the read that are shared with reference gene segments, formula image and formula image. Bulge/tip traversal and color assignment is shown below the graph, for example, to obtain the matching for the green reference, the green/black bulge is traversed, and marginals are aligned. Tips are also traversed, shown here with red and blue references. Matching/mismatching nucleotides are noted for each colored reference to the read at the bottom of the figure. Matches are noted with a • and mismatches with a −.
<b>FIG. 5.</b>
FIG. 5.
Color propagation and colored antibody graph with single read. (a) Color propagation example. Two sequences with a single nucleotide difference between them: GATCCACTGGGTTA (read shown by black edges) and GATCCACCGGGTTA (reference shown by red edges). The de Bruijn graph in this example is created with formula image. Edges shared between the two sequences are colored red and black. A single nucleotide difference creates five mismatches in the color profile of this read, shown as the “Raw” formula image. IgGraph traverses this bulge and propagates the color to reduce the number of mismatches to the single nucleotide difference, shown as “Propagated” formula image. (b) A single read (shown in black) along with V, D, and J gene segments shown as different colors. Shared formula image-mers between the read and different gene segments are shown as merged paths, while divergences are shown as bulges and tips. (c) The formula image color profile matrix for the example is shown. Each row represents one of nine gene segments, and each column is a different position in the read. From this matrix, we can score each row to select the V, D, and J labels for the read.
<b>FIG. 6.</b>
FIG. 6.
Labeling and partitioning comparison. Panel (a) shows the accuracy of IgGraph for V gene segments when a fixed number of mutations are inserted in each smAb V gene segment. Only datasets with an even number of mutations are plotted. The blue, orange, and yellow curves represent IgGraph results with parameterizations of formula image, formula image, and formula image, respectively. The green curve represents the IgBlast tool run with default parameters. (b) Jaccard index over partitions. The similarity of the partitioning for range sets of V, VJ, and VDJ gene segments are measured by computing the Jaccard index for predictions from IgGraph and IgBlast for each sequence.

References

    1. Angly F.E., Willner D., Rohwer F., et al. . 2012. Grinder: A versatile amplicon and shotgun sequence simulator. Nucleic Acids Res. 40, e94–e94 - PMC - PubMed
    1. Arnaout R., Lee W., Cahill P., et al. . 2011. High-resolution description of antibody heavy-chain repertoires in humans. PLoS One 6, e22365. - PMC - PubMed
    1. Basu M., Hegde M.V., and Modak M.J. 1983. Synthesis of compositionally unique DNA by terminal deoxynucleotidyl transferase. Biochem Biophys Res Commun 111, 1105–1112 - PubMed
    1. Brochet X., Lefranc M., and Giudicelli V. 2008. IMGT/V-QUEST: The highly customized and integrated system for IG and TR standardized VJ and VDJ sequence analysis. Nucleic Acids Res. 36, W503–W508 - PMC - PubMed
    1. Chen W., Prabakaran P., Zhu Z., et al. . 2012. Identification of cross-reactive IgG antibodies from an acute HIV-1-infected patient using phage display and high-throughput sequencing technologies. Exp. Mol. Pathol. 93

Publication types

Substances