. 2016 Apr 26;15(4):735-747.
doi: 10.1016/j.celrep.2016.03.062. Epub 2016 Apr 14.

Dopamine Autoreceptor Regulation of a Hypothalamic Dopaminergic Network

Affiliations

Dopamine Autoreceptor Regulation of a Hypothalamic Dopaminergic Network

Stefanos Stagkourakis et al. Cell Rep. .

Abstract

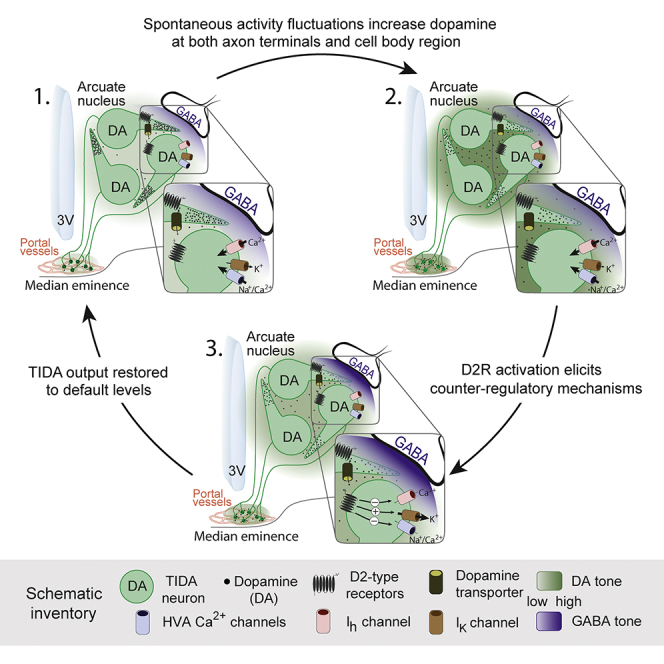
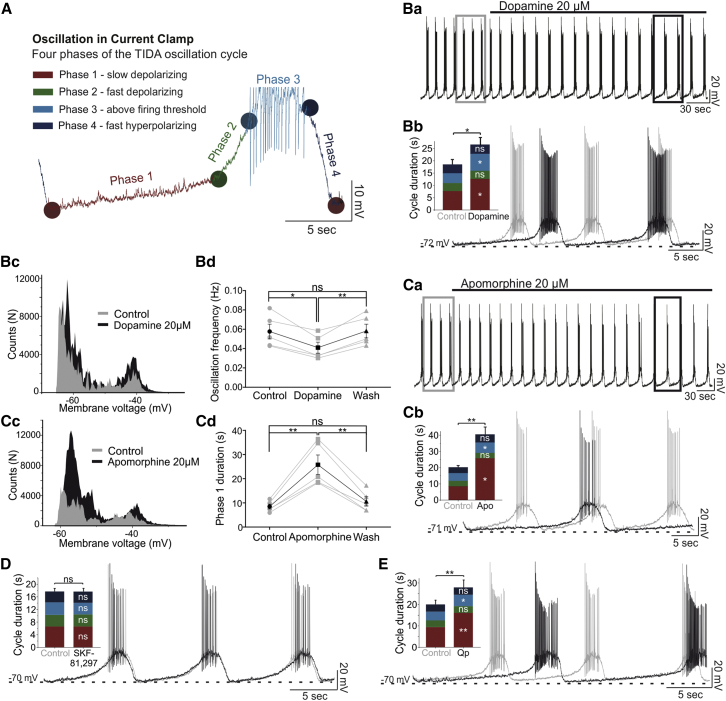
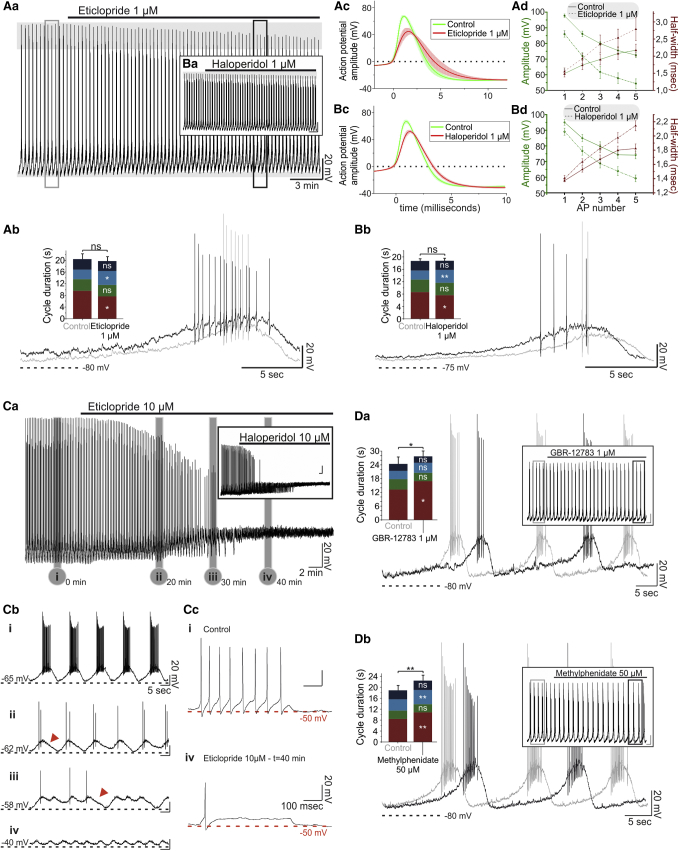
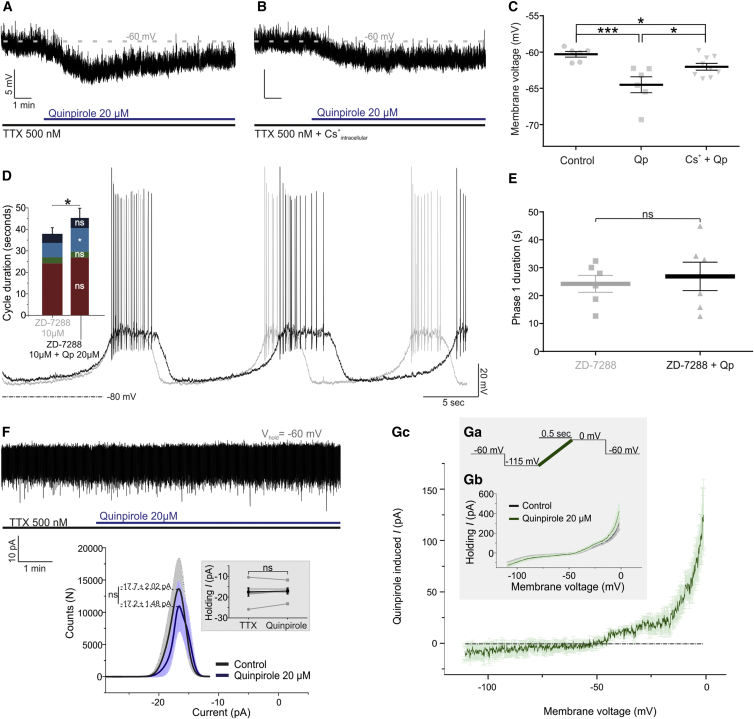
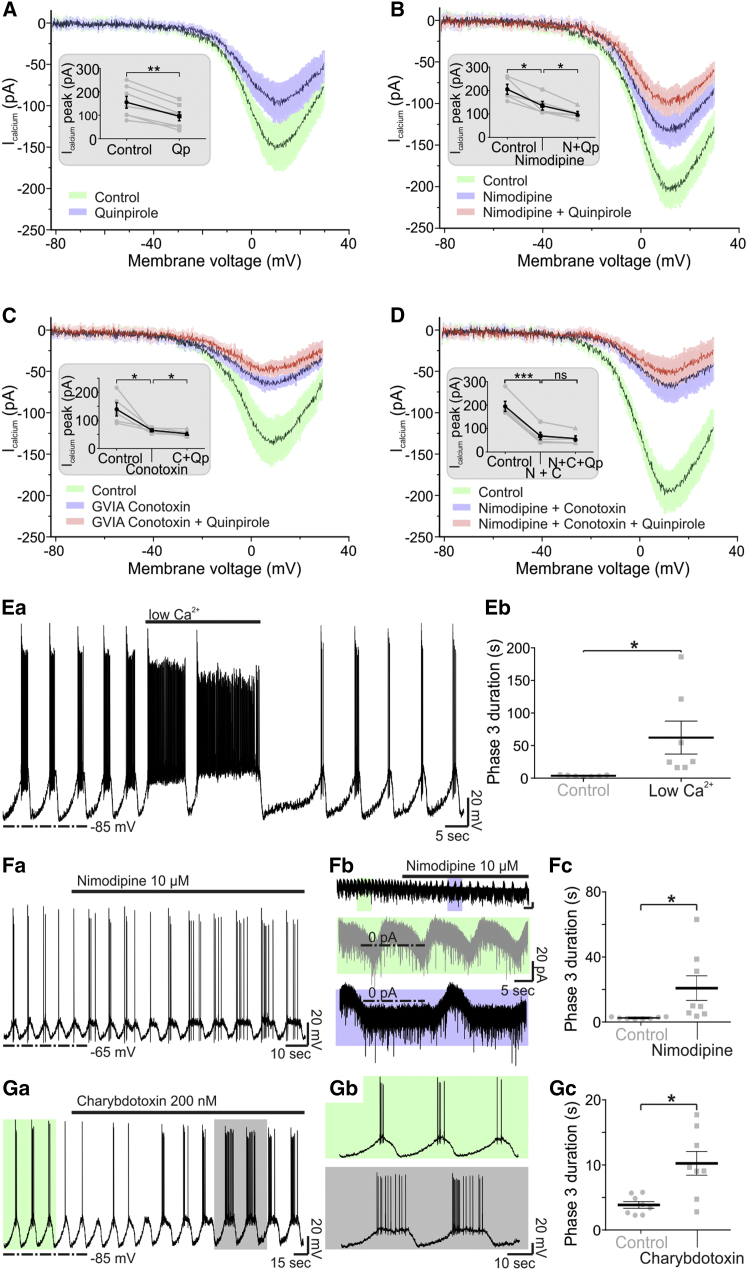
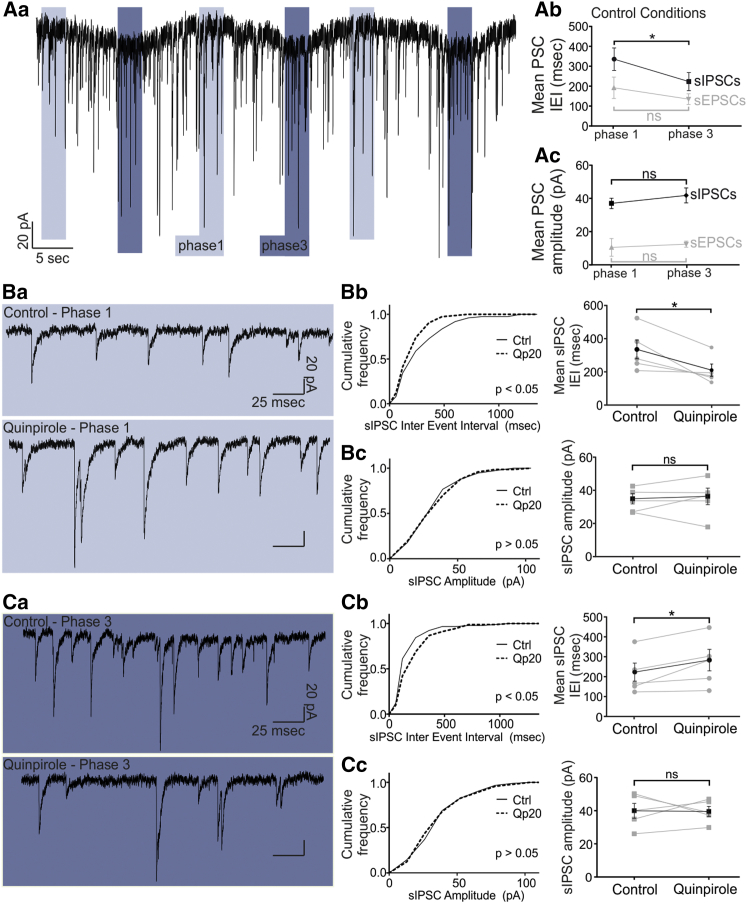
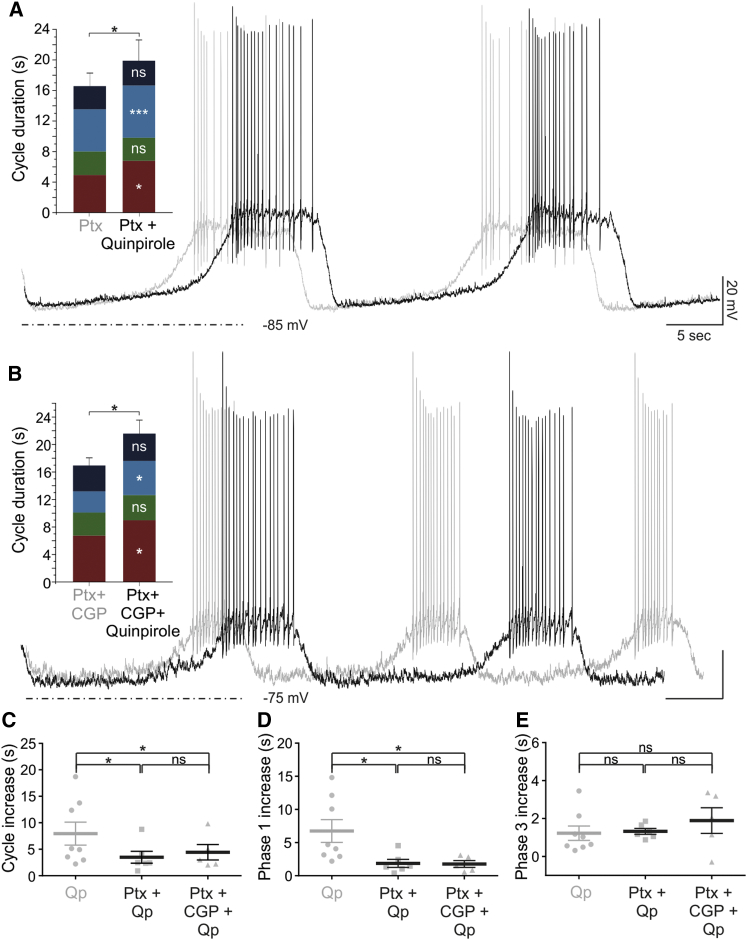
How autoreceptors contribute to maintaining a stable output of rhythmically active neuronal circuits is poorly understood. Here, we examine this issue in a dopamine population, spontaneously oscillating hypothalamic rat (TIDA) neurons, that underlie neuroendocrine control of reproduction and neuroleptic side effects. Activation of dopamine receptors of the type 2 family (D2Rs) at the cell-body level slowed TIDA oscillations through two mechanisms. First, they prolonged the depolarizing phase through a combination of presynaptic increases in inhibition and postsynaptic hyperpolarization. Second, they extended the discharge phase through presynaptic attenuation of calcium currents and decreased synaptic inhibition. Dopamine reuptake blockade similarly reconfigured the oscillation, indicating that ambient somatodendritic transmitter concentration determines electrical behavior. In the absence of D2R feedback, however, discharge was abolished by depolarization block. These results indicate the existence of an ultra-short feedback loop whereby neuroendocrine dopamine neurons tune network behavior to echoes of their own activity, reflected in ambient somatodendritic dopamine, and also suggest a mechanism for antipsychotic side effects.

Keywords: D2 receptor; arcuate nucleus; auto-inhibition; calcium currents; network oscillation; prolactin; tuberoinfundibular.


Figures

None
Graphical abstract
Figure 1
Figure 1
D2R Activation Decreases TIDA Neuron Oscillation Frequency (A) Current-clamp recording from TIDA neuron illustrating one cycle of the oscillation divided into four phases based on changes in slope (dV/dt). (Ba–Bd) In (Ba), dopamine application leads to a reversible decrease in oscillation frequency (−0.017 ± 0.004 Hz, p < 0.05, n = 5). (Bb) Expanded and overlaid boxed traces from (Ba) (gray trace indicates control, black trace indicates dopamine), and population data show a large increase in phase 1 duration (+5.03 ± 1.13 s) and a smaller increase in phase 3 duration (+2.92 ± 0.71 s; p < 0.05; n = 5). (Bc) Membrane voltage distribution plot illustrates accentuated biphasic distribution in the presence of dopamine. (Bd) Histogram demonstrating a reversible decrease of the oscillation frequency by dopamine. (Ca–Cd) Organized as in (Ba)–(Bc), (Ca)–(Cc) illustrate a similar slowing effect on oscillation by apomorphine as by dopamine; increases in phase 1 (+17.28 ± 3.09 s) and phase 3 (+1.76 ± 0.56 s) duration (p < 0.05, n = 5). Apomorphine-induced accentuation of biphasic membrane voltage distribution as shown in (Cc). (Cd) Histogram demonstrating a reversible increase in phase 1 duration by apomorphine. (D and E) Organized as in (Ba). (D) Application of the D1R-agonist, SKF-81,297, does not alter cycle or phase durations (n = 5). (E) Application of the D2R receptor agonist, Qp (n = 8), decreases oscillation frequency (−0.013 ± 0.001 Hz; p < 0.0001) and increases the duration of phases 1 (+6.61 ± 1.76 s; p < 0.01) and 3 (+1.23 ± 0.38 s; p < 0.05). Note similarity to dopamine and apomorphine effects (Ba, Bb, Ca, and Cb). ns, not significant.
Figure 2
Figure 2
D2R Antagonism and DAT-Blockade Effect on TIDA Neurons (Aa–Ad) In (Aa) and (Ab), a current-clamp recording from oscillating TIDA neuron is shown. Application of eticlopride (1 μM) is followed by a progressive decrease in AP amplitude and depolarization of the nadir (horizontal gray bars). Boxed sections from (Aa) are expanded and overlaid in (Ab) (gray indicates control; black indicates eticlopride), with population data shown in the histogram; note the decrease in the phase 1 duration (−1.88 ± 0.65 s) and the increase in the phase 3 duration (+1.51 ± 0.37 s) (p < 0.05, n = 5). (Ac) Averaged (indicated by solid lines, SE in shading) APs in the absence (green) and presence (red) of 1 μM eticlopride. (Ad) Average AP amplitude (green) progressively decreases and half-width (red) increases during the oscillation cycle in the presence of 1 μM eticlopride (indicated by a dashed line; solid line indicates control). (Ba–Bd) Organized as in (Aa)–(Ad), respectively, these panels illustrate the similarity of effects of 1 μM haloperidol and eticlopride. (Ca–Cc) In (Ca), following application of 10 μM eticlopride, TIDA neurons progressively depolarize, with the oscillation ultimately collapsing and AP firing being abolished (n = 5/5). Inset shows the same effect with 10 μM haloperidol (n = 11/11). (Cb) Boxed sections in (Ca) are expanded in (Cb i)–(Cb iv). (Cc) Voltage responses to step current pulses in control (Cb i) and after a 40-min application of 10 μM eticlopride (Cb iv) show a loss of capacity for repetitive discharge. (Da and Db) Effect of DAT antagonists on oscillation frequency. (Da) Application of GBR-12783 (1 μM) prolongs cycle duration (3.49 ± 1.25 s; n = 8; p < 0.05 versus control) via phase 1 prolongation (3.64 ± 1.41 s; n = 8; p < 0.05 versus control). (Db) Similarly, methylphenidate increases cycle duration (2.62 ± 0.44 s; n = 5; p < 0.01 versus control) via phase 1 (+2.38 ± 0.38 s) and, to a smaller extent, phase 3 (+1.06 ± 0.18 s) (p < 0.01, n = 5). ns, not significant.
Figure 3
Figure 3
D2R Activation Induces a Postsynaptic Outward Current Operating at a Depolarized Membrane Potential (A) Current-clamp recording of a TIDA neuron in the presence of TTX to abolish oscillation and APs. Note hyperpolarization following application of Qp. (B) Recording under the same conditions as in (A) but with cesium methanesulfonate included in the intracellular solution; note the attenuation of Qp-induced hyperpolarization. (C) Average membrane potential in control, with Qp applied (−4.19 ± 0.78 mV; n = 6; p < 0.01), and Qp applied in the presence of intracellular cesium (−1.69 ± 0.45 mV; n = 9; p < 0.01). (D) Current-clamp recording of a TIDA neuron in the presence of ZD-7288 and co-application of Qp. Under these conditions, cycle duration increase is attributable exclusively to phase 3 prolongation (4.25 ± 1.38 s; n = 6; p < 0.05 versus ZD-7288). (E) D2R activation under Ih blockade does not lead to phase 1 prolongation (2.67 ± 3.3 s; n = 6; p > 0.05 versus ZD-7288). (F) Voltage-clamp recording of a TIDA neuron in the presence of TTX at a holding potential of −60 mV. Under these conditions, Qp does not significantly affect membrane current (−0.49 ± 1.5 pA; n = 6; p > 0.05). Population data in the inset show control in black and Qp in blue (solid lines indicate average; shaded area indicates SE. (Ga–Gc) Inset shows voltage-clamp ramps: −115 to −0 mV; 500-ms (Ga–Gc) recordings of TIDA neurons in the absence (black) and presence (blue) of Qp (averaged traces; (Gb) n = 5). (Gc) Qp-induced current. Note the minimal current flowing between −115 and −50 mV and large inward current activated at depolarized voltage (> −50 mV). ns, not significant.
Figure 4
Figure 4
D2R Activation Decreases Ca2+ Currents in TIDA Neurons through L- and N-Type Ca2+ Channels (A) Average voltage-clamp ramp traces recorded from TIDA neurons (ns = 7/5/5/5 for A–D, respectively) under pharmacological isolation of Ca2+ currents. Current recorded under control conditions shown in green (solid lines, average; shaded area, SE). Note the attenuation of HVA Ca2+ currents in the presence of Qp (blue). Inset shows average current at peak in control (154.9 ± 25.44 pA) and upon Qp application (102.1 ± 19.10 pA, n = 7, p < 0.01 versus control). (B) Organized as (A), but with recording in the presence of the L-type HVA current antagonist, nimodipine (blue), and nimodipine and Qp co-applied (red). The control HVA Ca2+ current (205 ± 21.55 pA) is decreased following the application of nimodipine (142.2 ± 18.78 pA, n = 5, p < 0.05 versus control), upon which Qp has a diminished effect (107.6 ± 10.49 pA; n = 5; p < 0.05 versus nimodipine). (C) Organized as in (A), but with recording in the presence of the N-type HVA current antagonist, GVIA-conotoxin (blue), and GVIA-conotoxin and Qp co-applied (red). The control HVA Ca2+ current (141.2 ± 22.77 pA) is decreased by application of GVIA-conotoxin (69.8 ± 4.55 pA; n = 5; p < 0.05 versus control), upon which Qp has a miniature yet significant effect (62 ± 5.54 pA; n = 5; p < 0.05 versus GVIA-conotoxin). (D) Organized as in (A), but with recording in the presence of nimodipine and GVIA-conotoxin (blue) and of nimodipine, GVIA-conotoxin, and Qp co-applied (red). The control HVA Ca2+ current (194.2 ± 21.55 pA) is markedly decreased when both L- and N-type channels are blocked (74.8 ± 16.18 pA; n = 5; p < 0.001 versus control). Under these conditions, application of Qp does not further decrease HVA currents (64.2 ± 11.56 pA; n = 5; p > 0.05 versus GVIA-conotoxin and nimodipine). Data are presented in absolute values. (Ea and Eb) Effect of (Ea) “low-Ca2+” aCSF on the TIDA oscillation and (Eb) phase 3 duration, which is increased (59.98 ± 24.45 s; n = 7; p < 0.05 versus control). (Fa–Fc) Current-clamp (Fa) and voltage-clamp (Fb) recordings in the presence of nimodipine, demonstrating (Fc) phase 3 prolongation (18.33 ± 7.61 s; n = 8; p < 0.05 versus control). (Ga–Gc) In (Ga), a current-clamp recording is shown in the presence of the BK channel blocker, charybdotoxin (200 nM). (Gb) Recording in (Ga), shown in higher temporal resolution; control (light green) versus charybdotoxin (gray). Note the prolongation of phase 3 and discharge. (Gc) BK channel blockade leads to a significant prolongation of phase 3 (6.41 ± 1.85 s; n = 8; p < 0.05 versus control). ns, not significant.
Figure 5
Figure 5
Phase-Dependent Modulation of sIPSC Frequency via D2R Agonism (Aa–Ac) In (Aa), a voltage-clamp recording from TIDA neurons is shown, in the presence of ionotropic glutamate receptor antagonists and using high [Cl]i to isolate sIPSCs. Phase 1 is indicated by light blue, and phase 3 is indicated by dark blue. (Ab) The sIPSC IEI is significantly lower in phase 3 than in phase 1 (−112.5 ± 32.55 ms; n = 5; p < 0.05), whereas the sEPSC IEI is not significantly different (−57.07 ± 30.5 ms; n = 6; p > 0.05). (Ac) The amplitude of sIPSCs (+4.81 ± 3.87 ms; n = 5; p > 0.05, phase 3 versus phase 1) and sEPSCs (+0.19 ± 0.46 ms; n = 6; p > 0.05) is not different between phases 1 and 3. (Ba–Bc) In (Ba), raw voltage-clamp phase 1 traces are shown in the absence (top) and presence (bottom) of Qp. (Bb) Cumulative frequency distribution of the sIPSC IEI, demonstrating a significant increase in sIPSC frequency (−125.0 ± 40.09 ms; KS-2 p < 0.05; t test p < 0.05; n = 5) during phase 1 after application of Qp. (Bc) Phase 1 sIPSC amplitude remains unchanged by Qp (+1.39 ± 3.19 pA; KS-2 p > 0.05; t test p > 0.05; n = 5). (Ca–Cc) In (Ca), raw voltage-clamp phase 3 traces are shown in the absence (top) and presence (bottom) of Qp. (Cb) Cumulative frequency distribution of the sIPSC IEI demonstrating a decrease in sIPSC frequency (+60.43 ± 21.61 ms, KS-2 p < 0.05; t test p < 0.05; n = 5) during phase 3 in the presence of Qp. (Cc) Phase 3 sIPSC amplitude is not affected (−0.34 ± 4.75 pA; KS-2, p > 0.05; t test, p > 0.05; n = 5). ns, not significant.
Figure 6
Figure 6
Increased GABAA-Mediated Inhibition Contributes to D2R-Mediated Slowing of Oscillation Frequency by Extending Phase 1 (A) Overlaid current-clamp recordings from oscillating TIDA neuron in the presence of Ptx before (gray) and during (black) application of Qp. Activation of the D2R induces an increase in cycle duration (+3.49 ± 1.13 s; p < 0.05 versus Ptx; n = 6) by increasing the duration of phases 1 (+1.86 ± 0.59 s; p < 0.05 versus Ptx; n = 6) and 3 (+1.32 ± 0.15 s; p < 0.001 versus Ptx; n = 6). (B) Experiment is as in (A), but with addition of CGP-55845 (CGP) in the bath to block GABAB receptors. When Qp is added, increases in the duration of the oscillation cycle (+4.43 ± 1.45 s; p < 0.05 versus Ptx + CGP; n = 5), phase 1 (+1.76 ± 0.51 s; p < 0.05 versus Ptx + CGP; n = 5), and phase 3 (+1.89 ± 0.68 s; p < 0.05 versus Ptx + CGP; n = 5) are seen also under these conditions. Scale bars, as shown in (A). (C–E) Comparison of the increases in cycle (C), phase 1 (D), and phase 3 (E) duration induced by Qp application in control conditions (n = 7) versus during GABAA (n = 6) or combined GABAA/B (n = 5) blockade. (C) The increase in cycle duration following Qp alone (7.95 ± 2.17 s) is significantly larger than the increases seen in Ptx + Qp (3.49 ± 1.13 s; p < 0.05) and Ptx + CGP + Qp (4.43 ± 1.45 s; p < 0.05). In contrast, the increase measured in Ptx + Qp was not significantly different from the increase in Ptx + CGP + Qp. (D) Similarly, the increase in the duration of phase 1 following Qp alone (6.61 ± 1.76 s) is significantly greater than the increases seen for Ptx + Qp (1.86 ± 0.59 s; p < 0.05) and Ptx + CGP + Qp (2.22 ± 0.78 s; p < 0.05); increases recorded in Ptx + Qp and Ptx + CGP + Qp are not significantly different from each other. (E) The increases in the duration of phase 3 recorded in Qp (1.23 ± 0.38 s), Ptx + Qp (1.32 ± 0.15 s) and Ptx + CGP + Qp (1.89 ± 0.68 s) are not different from each other. ns, not significant.

Comment in

References

    1. Aghajanian G.K., Bunney B.S. Dopamine“autoreceptors”: pharmacological characterization by microiontophoretic single cell recording studies. Naunyn Schmiedebergs Arch. Pharmacol. 1977;297:1–7. - PubMed
    1. Andén N.E., Strömbom U. Adrenergic receptor blocking agents: effects on central noradrenaline and dopamine receptors and on motor activity. Psychopharmacology (Berl.) 1974;38:91–103. - PubMed
    1. Annunziato L., Leblanc P., Kordon C., Weiner R.I. Differences in the kinetics of dopamine uptake in synaptosome preparations of the median eminence relative to other dopaminergically inervated brain regions. Neuroendocrinology. 1980;31:316–320. - PubMed
    1. Beckstead M.J., Grandy D.K., Wickman K., Williams J.T. Vesicular dopamine release elicits an inhibitory postsynaptic current in midbrain dopamine neurons. Neuron. 2004;42:939–946. - PubMed
    1. Bedran de Castro J.C., Khorram O., McCann S.M. Possible negative ultra-short loop feedback of luteinizing hormone releasing hormone (LHRH) in the ovariectomized rat. Proc. Soc. Exp. Biol. Med. 1985;179:132–135. - PubMed

LinkOut - more resources