. 2016 May 5;14(1):120.
doi: 10.1186/s12967-016-0886-9.

Serum microRNA-1233 is a specific biomarker for diagnosing acute pulmonary embolism

Affiliations

Serum microRNA-1233 is a specific biomarker for diagnosing acute pulmonary embolism

Thorsten Kessler et al. J Transl Med. .

Abstract

Background: Circulating microRNAs (miRNAs) emerge as novel biomarkers in cardiovascular diseases. Diagnosing acute pulmonary embolism (PE) remains challenging due to a diverse clinical presentation and the lack of specific biomarkers. Here we evaluate serum miRNAs as potential biomarkers in acute PE.

Methods: We enrolled 30 patients with acute, CT (computed tomography)-angiographically confirmed central PE and collected serum samples on the day of emergency room admission (1st day) and from 22 of these patients 9 months thereafter. For comparison, we examined serum samples from patients with acute non ST-segment elevation myocardial infarction (NSTEMI, n = 30) and healthy individuals (n = 12).

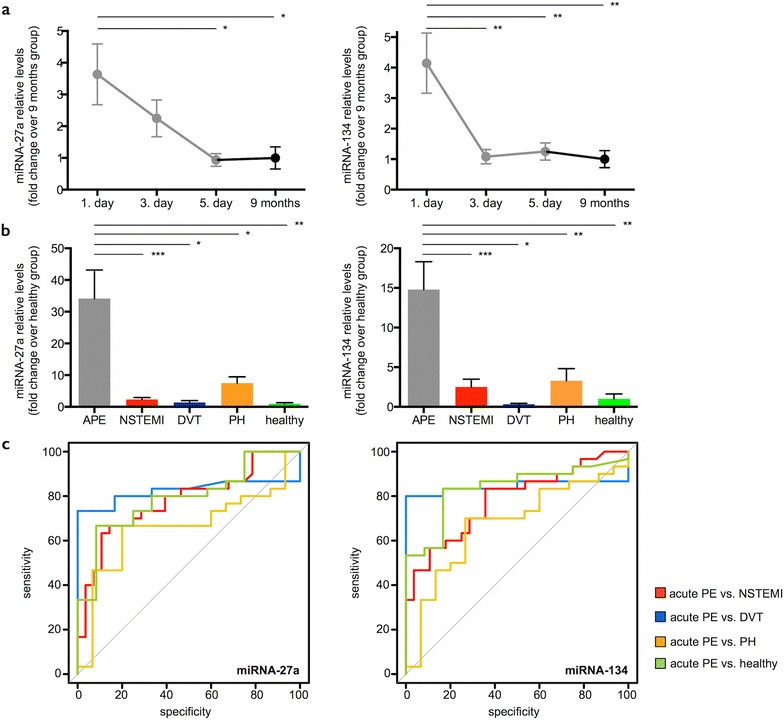
Results: We randomly selected 16 out of 30 PE patients and screened sera from the acute (1st day) and chronic stages (9 months) for 754 miRNAs using microarrays and found 37 miRNAs to be differentially regulated. Across all miRNAs, miRNA-1233 displayed the highest fold change (FC) from acute to chronic stage (log2FC 11.5, p < 0.004). We validated miRNA-1233 by real-time quantitative polymerase chain reaction (RT-qPCR). In acute PE (1st day) we found elevated levels of miRNA-1233 in comparison to NSTEMI (log2FC 5.7, p < 0.0001) and healthy controls (log2FC 7.7, p < 0.0001). miRNA-1233 differentiated acute PE from NSTEMI patients and healthy individuals with 90 and 90 % sensitivity, and 100 and 92 % specificity [area under the curve (AUC) 0.95, p < 0.001 and 0.91, p < 0.001], respectively.

Conclusions: This is the first report that identifies a miRNA that allows distinguishing acute PE from acute NSTEMI and healthy individuals with high specificity and sensitivity.

Keywords: Biomarker; Non ST-segment elevation myocardial infarction micro-RNA; Pulmonary embolism.


Figures

Fig. 1
Fig. 1
Biomarker time course. Levels of the biomarkers D-Dimers, high sensitive (hs) TroponinT and n-terminal (nt) pro brain natriuretic peptide (BNP) during the course of pulmonary embolism (PE, 1st day: presentation at the emergency department, 3rd and 5th day during the hospital stay (n = 30) and 9 ± 1.5 months thereafter (n = 22), mean ± SEM, *p < 0.05, **p < 0.01, ****p < 0.0001)
Fig. 2
Fig. 2
miRNA-1233. a microRNA (miRNA) array screening. We randomly selected 16 out of 30 pulmonary embolism (PE) patients and screened their sera from the acute (1st day) and chronic stage (9 months) for 754 miRNAs. The 37 most differentially expressed miRNAs (nominal P value ≤ 0.05) were displayed. miRNA-1233 (red dot) displayed the highest fold change on the 1st day (log2FC 11.5 on 1st day vs. 9 months, p < 0.004) and was consequently subjected to real-time quantitative polymerase chain reaction (RT-qPCR) validation. b miRNA RT-qPCR validation. Serum miRNA-1233 levels during the time course of acute PE (1st day: presentation at the emergency department, 3rd and 5th day during the hospital stay (n = 30) and 9 ± 1.5 months thereafter (n = 22). Values represent relative levels with the “9 months” group set as 1 (mean ± SEM, **p < 0.01). c Serum miRNA-1233 levels from acute pulmonary embolism patients (APE, 1st day, n = 30) in comparison to patients with acute non ST-segment elevation myocardial infarction (NSTEMI, n = 30), acute deep vein thrombosis without concomitant PE (DVT, n = 6), chronic non-thromboembolic pulmonary hypertension (PH, n = 15) and healthy individuals (n = 12). Values represent relative levels with the “healthy” group set as 1 (mean ± SEM, ***p < 0.001, ****p < 0.0001). d Receiver operating characteristic (ROC) curve analysis for miRNA-1233 to discriminate acute PE (1st day) from acute NSTEMI (red line, area under the curve (AUC) 0.95, p < 0.001, sensitivity 90 % and specificity 100 %), acute DVT (blue line, AUC 0.99, p < 0.001, sensitivity 97 % and specificity 100 %), chronic PH (orange line, AUC 0.91, p < 0.001, sensitivity 90 % and specificity 93 %) and healthy individuals (green line, AUC 0.91, p < 0.001, sensitivity 90 % and specificity 92 %)
Fig. 3
Fig. 3
miRNA-27a and 134. a Serum miRNA-27a and 134 levels during the time course of acute pulmonary embolism (APE, 1st day: presentation at the emergency department, 3rd and 5th day during the hospital stay (n = 30) and 9 ± 1.5 months thereafter (n = 22). Values represent relative levels with the pulmonary embolism (PE) “9 months” group set as 1 (mean ± SEM, *p < 0.05, **p < 0.01). b Serum miRNA-27a and 134 levels from acute PE patients (APE, 1st day, n = 30) in comparison to patients with acute non ST-segment elevation myocardial infarction (NSTEMI, n = 30), acute deep vein thrombosis without concomitant PE (DVT, n = 6), chronic non-thromboembolic pulmonary hypertension (PH, n = 15) and healthy individuals (n = 12). Values represent relative levels with the “healthy” group set as 1 (mean ± SEM, *p < 0.05, **p < 0.01, ***p < 0.001). c ROC (Receiver operating characteristic) curve analysis for miRNA-27a and 134 to discriminate acute PE (1st day) from acute NSTEMI (red line, area under the curve (AUC) 0.78, 0.78, p < 0.001, < 0.001, respectively), acute DVT (blue line, AUC 0.83, 0.84, p < 0.05, < 0.01, respectively), chronic PH (orange line, AUC 0.66, 0.67, p = 0.09, 0.06, respectively) and healthy individuals (green line, AUC 0.79, 0.84, p < 0.01, < 0.001, respectively)
Fig. 4
Fig. 4
Receiver operating characteristic curve analysis. ROC (Receiver operating characteristic) curve analysis for a combining two microRNAs (miRNA) or b all three miRNAs to discriminate acute pulmonary embolism (PE, 1st day) from acute non-ST segment myocardial infarction (NSTEMI, red line), acute deep vein thrombosis without concomitant PE (DVT, blue line), chronic non-thromboembolic pulmonary hypertension (PH, orange line) and healthy individuals (green line). c ROC curve analysis for comparing miRNAs (green line: miRNA-1233, red line: miRNA-134, blue line: miRNA-27a) to discriminate acute PE (1st day) from acute NSTEMI, acute DVT without concomitant PE, chronic non-thromboembolic PH and healthy individuals

References

    1. Konstantinides SV, Torbicki A, Agnelli G, Danchin N, Fitzmaurice D, Galiè N, et al. 2014 ESC guidelines on the diagnosis and management of acute pulmonary embolism. Eur Heart J. 2014;35:3033–3069. doi: 10.1093/eurheartj/ehu243. - DOI - PubMed
    1. Jaff MR, McMurtry MS, Archer SL, Cushman M, Goldenberg N, Goldhaber SZ, et al. Management of massive and submassive pulmonary embolism, iliofemoral deep vein thrombosis, and chronic thromboembolic pulmonary hypertension: a scientific statement from the American Heart Association. Circulation. 2011;123:1788–1830. doi: 10.1161/CIR.0b013e318214914f. - DOI - PubMed
    1. Douma RA, Kamphuisen PW, Buller HR. Acute pulmonary embolism. Part 1: epidemiology and diagnosis. Nat Rev Cardiol. 2010;7:585–596. doi: 10.1038/nrcardio.2010.106. - DOI - PubMed
    1. Agnelli G, Becattini C. Acute pulmonary embolism. N Engl J Med. 2010;363:266–274. doi: 10.1056/NEJMra0907731. - DOI - PubMed
    1. Huisman MV, Klok FA. How I diagnose acute pulmonary embolism. Blood. 2013;121:4443–4448. doi: 10.1182/blood-2013-03-453050. - DOI - PubMed

Publication types