. 2016 May 3;24(5):750-761.
doi: 10.1016/j.str.2016.02.021. Epub 2016 Apr 14.

Individual Ion Binding Sites in the K(+) Channel Play Distinct Roles in C-type Inactivation and in Recovery from Inactivation

Affiliations

Individual Ion Binding Sites in the K(+) Channel Play Distinct Roles in C-type Inactivation and in Recovery from Inactivation

Kimberly Matulef et al. Structure. .

Abstract

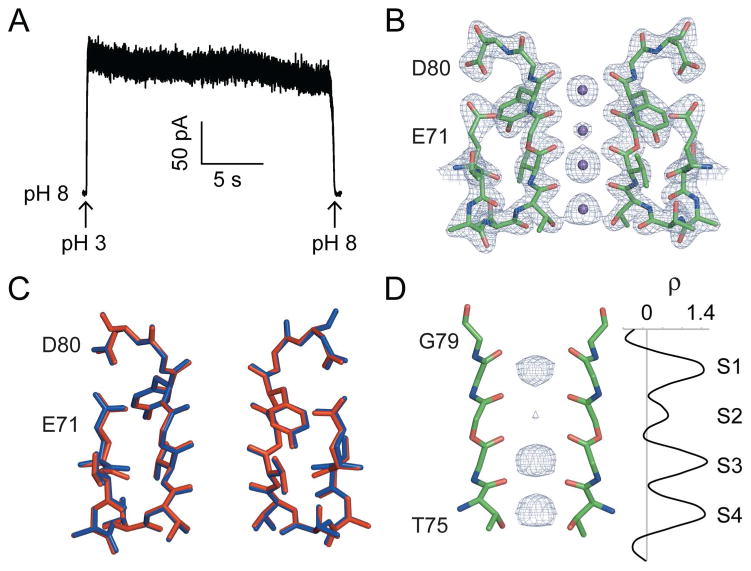
The selectivity filter of K(+) channels contains four ion binding sites (S1-S4) and serves dual functions of discriminating K(+) from Na(+) and acting as a gate during C-type inactivation. C-type inactivation is modulated by ion binding to the selectivity filter sites, but the underlying mechanism is not known. Here we evaluate how the ion binding sites in the selectivity filter of the KcsA channel participate in C-type inactivation and in recovery from inactivation. We use unnatural amide-to-ester substitutions in the protein backbone to manipulate the S1-S3 sites and a side-chain substitution to perturb the S4 site. We develop an improved semisynthetic approach for generating these amide-to-ester substitutions in the selectivity filter. Our combined electrophysiological and X-ray crystallographic analysis of the selectivity filter mutants show that the ion binding sites play specific roles during inactivation and provide insights into the structural changes at the selectivity filter during C-type inactivation.


Figures

Figure 1
Figure 1. The selectivity filter and inactivation in the KcsA channel
a) Structure of the wild type KcsA channel (PDB: 1K4C). Two opposite subunits of the tetramer are shown with the selectivity filter (residues T75-G79) depicted as sticks and K+ ions bound to the selectivity filter shown as spheres. b) Close-up of the selectivity filter of the KcsA channel. The amide bonds (1′-4′) and the ion binding sites (S1–S4) are labeled. The Fo-Fc electron density (residues 75–79, ions and lipid omitted) present at the ion binding sites is shown, contoured at 3.0 σ. A one-dimensional plot (1-D) of the electron density sampled along the central axis of the selectivity filter is shown (right). c) The gating cycle of the KcsA channel. Four states are depicted with the selectivity filter in either the conductive or the inactivated state and the bundle crossing in either the closed or the open state. The changes at the bundle crossing and the selectivity filter are coupled. Opening of the bundle crossing favors the inactivated state of the selectivity filter while closure of the bundle crossing favors the conductive state. d) Macroscopic currents for the KcsA channel were elicited at +80 mV by two pulses to pH 3.0 with a variable time interval (recovery time) at pH 8.0 between pulses. The fraction recovery was measured as the ratio of the peak current in the second pulse to the peak current in the first pulse. Inset: The fraction recovery plotted as a function of the recovery time at pH 8.0. Points represent the mean ± standard deviation (SD) from 3–4 patches and the solid line is a fit to a single exponential function. e) Amide-to-ester mutagenesis.
Figure 2
Figure 2. Modular semisynthesis of the KcsA V76ester channel
a) Strategy for the semisynthesis of the KcsA V76ester channel. The KcsA polypeptide is synthesized from two recombinant peptides (gray, N-peptide thioester: residues 1–69 and C-peptide: 82–160) and a synthetic pore peptide thioester (red, residues 70–81) by two sequential native chemical ligation reactions. The V76ester linkage in the pore peptide is indicated by an asterisk. The first ligation reaction between the C-peptide and the pore peptide thioester yields an intermediate peptide. The Thz protecting group (green sphere) on the N-terminal cysteine of the intermediate peptide is removed, and the intermediate peptide is then ligated to the N-peptide thioester to yield the KcsA polypeptide. The KcsA polypeptide is folded in vitro to the native state. The ligation sites, residues 70 and 82, are represented by yellow boxes or spheres. b) SDS-PAGE gel (15%) of the first ligation reaction between the C-peptide (C) and the V76ester pore peptide (residues 70–81, with the peptide bond between residues 75 and 76 replaced with an ester linkage) to form the intermediate peptide (I) at 0 min (lane 1) and 2 h (lane 2). c) SDS-PAGE gel (15%) of the second ligation reaction between the N-peptide thioester (N) and the intermediate peptide to form the KcsA polypeptide (F) at 0 min (lane 1) and 24 h (lane 2). d) SDS-PAGE gel (12%) showing the folding of semisynthetic KcsA by lipids. The unfolded monomeric (M, which corresponds to the KcsA polypeptide) and the folded tetrameric KcsA (T) are indicated. e) Size exclusion chromatography of the purified V76ester KcsA channel. Inset: SDS-PAGE gel (12%) showing molecular weight markers (lane 1) and the purified V76ester channel (lane 2).
Figure 3
Figure 3. Functional and structural effects of the V76ester substitution
a) Macroscopic currents for the KcsA V76ester channel were elicited at +80 mV by a rapid change in pH. b) Recovery from inactivation in the V76ester (red triangles) and the control channel (black circles). The control channel contains the amino acid substitutions (S69A, V70C, and Y82C) that are present in the semisynthetic channels. Data points represent the mean ± SD from 3–10 patches. The solid lines are single exponential fits. c) Structure of the selectivity filter of the V76ester channel. The 2Fo-Fc electron density map contoured at 2.8 σ for diagonally opposite subunits is shown with residues 71–80 represented as sticks and the K+ ions in the filter represented as spheres. d) Superposition of selectivity filter of wild type (blue) and the V76ester channel (red).
Figure 4
Figure 4. Incorporating the G77dA substitution into the KcsA V76ester channel
a) Macroscopic currents for the KcsA G77dA channel elicited at +80 mV by a rapid change in pH. b) The ion binding sites in the selectivity filter of the KcsA G77dA channel (PDB: 2IH3). Two opposite subunits are shown as sticks. Side chains of V76 and Y78 are omitted for clarity. The Fo-Fc electron density (KcsA residues 75–79, K+ ions, and lipid omitted) along the central axis of the selectivity filter contoured at 3.0 σ is shown. The one-dimensional plot of the electron density is shown on the right. c) Macroscopic currents for the KcsA V76ester+ G77dA channel elicited at +80 mV by a rapid change in pH. d) Recovery from inactivation in the G77dA (black triangles) and the V76ester+G77dA channels (red squares). Data points represent the mean ± SD from 3–6 patches. The solid lines are single exponential fits. e) Structure of the selectivity filter of the V76ester+G77dA channel. The 2Fo-Fc electron density map contoured at 2.8 σ is shown with residues 71–80 of the channel represented as sticks and K+ ions in the filter represented as spheres. f) Superposition of residues 71–80 of the V76ester+G77dA channel (red) with the G77dA (blue, PDB: 2IH3) and the wild type channels (grey, PDB: 1K4C). g) The ion binding sites in the selectivity filter of the V76ester+G77dA KcsA channel. The Fo-Fc electron density (KcsA residues 75–79, K+ ions, and lipid omitted) contoured at 3.0 σ is shown along the central axis of the selectivity filter. The one-dimensional plot of the electron density is shown on the right.
Figure 5
Figure 5. Effects of the G77ester substitution on inactivation and ion distribution in the selectivity filter
a) Macroscopic currents elicited at +80 mV for the KcsA G77ester channels by a rapid change in pH. b) Structure of the selectivity filter of the KcsA G77ester channel. The 2Fo-Fc electron density map contoured at 2.8 σ is shown with residues 71–80 of the channel represented as sticks and K+ ions in the filter represented as spheres. c) Superposition of residues 71–80 of the KcsA G77ester (red) and the wild type channel (blue). d) The ion binding sites in the selectivity filter of the G77ester channel. The Fo-Fc electron density (KcsA residues 75–79, K+ ions, and lipid omitted) along the central axis of the selectivity filter contoured at 2.5σ is shown. The one-dimensional plot of the electron density is shown on the right.
Figure 6
Figure 6. Inactivation and recovery in the KcsA G79ester channel
a) The ion binding sites in the selectivity filter of the KcsA G79ester channel. Two opposite subunits are shown in stick representation (PDB: 2H8P). Fo-Fc electron density (KcsA residues 75–79, K+ ions, and lipid omitted) along the central axis of the selectivity filter contoured at 3.0 σ is shown. b) Macroscopic currents for the KcsA G79ester channel elicited at +80 mV by a rapid change in pH. c) Recovery from inactivation of G79ester (red squares) and control channels (black circles). Data points represent the mean ± SD from 3–5 patches and the solid line represents an exponential fit to the data for the G79ester channel.
Figure 7
Figure 7. Effects of the T75G substitution on inactivation and ion distribution in the selectivity filter
a) Macroscopic currents for the KcsA T75G channels elicited at +80 mV by a rapid change in pH. b) Recovery from inactivation in the KcsA T75G (blue open circles), V76 ester (red triangles), and wild type channels (black closed circles). Data points represent the mean ± SD from 3–7 patches and the solid lines are single exponential fits. Data for the V76ester and the wild type channel are from figures 3b and 1d respectively. c) Structure of the selectivity filter of the KcsA T75G channel. The 2Fo-Fc electron density map contoured at 2.5 σ is shown with residues 71–80 of the channel represented as sticks and K+ ions in the filter represented as spheres. d) Superposition of residues 71–80 of the KcsA T75G (red) and the wild type channel (blue). e) The ion binding sites in the selectivity filter of the T75G channel. The Fo-Fc electron density (KcsA residues 75–79, K+ ions, and lipid omitted) along the central axis of the selectivity filter contoured at 3.0 σ is shown. The one-dimensional plot of the electron density for the T75G (red) and the wild type (black) channel is shown on the right.
Figure 8
Figure 8. A working model for C-type inactivation
a) Summary of the effects of ion occupancy at the selectivity filter sites on inactivation and recovery. b) Schematic diagram of the selectivity filter in the conductive and the inactivated states. The conformational change at the selectivity filter leading to C-type inactivation is proposed to be a rotation of the 4′ carbonyl oxygen that results in a disruption of the S3 and S4 sites. The inactivated state contains an ion bound at the S2 site. Recovery from inactivation involves a rotation of the 4′ carbonyl oxygen back into the conduction pathway to regenerate the S3 and the S4 sites. K+ ions are represented as purple spheres. The 4′ carbonyl oxygen is indicated by an asterisk and the direction of movement is indicated by blue arrows.

References

    1. Adams PD, Afonine PV, Bunkoczi G, Chen VB, Davis IW, Echols N, Headd JJ, Hung LW, Kapral GJ, Grosse-Kunstleve RW, et al. PHENIX: a comprehensive Python-based system for macromolecular structure solution. Acta Crystallogr D Biol Crystallogr. 2010;66:213–221. - PMC - PubMed
    1. Ader C, Schneider R, Hornig S, Velisetty P, Vardanyan V, Giller K, Ohmert I, Becker S, Pongs O, Baldus M. Coupling of activation and inactivation gate in a K+-channel: potassium and ligand sensitivity. EMBO J. 2009;28:2825–2834. - PMC - PubMed
    1. Armstrong CM, Hoshi T. K(+) channel gating: C-type inactivation is enhanced by calcium or lanthanum outside. J Gen Physiol. 2014;144:221–230. - PMC - PubMed
    1. Berneche S, Roux B. A gate in the selectivity filter of potassium channels. Structure. 2005;13:591–600. - PubMed
    1. Bhate MP, McDermott AE. Protonation state of E71 in KcsA and its role for channel collapse and inactivation. Proc Natl Acad Sci U S A. 2012;109:15265–15270. - PMC - PubMed

Publication types