

Effects of Cardiac Troponin I Mutation P83S on Contractile Properties and the Modulation by PKA-Mediated Phosphorylation
- PMID: 27150586
- PMCID: PMC5001945
- DOI: 10.1021/acs.jpcb.6b01859
Effects of Cardiac Troponin I Mutation P83S on Contractile Properties and the Modulation by PKA-Mediated Phosphorylation
Abstract
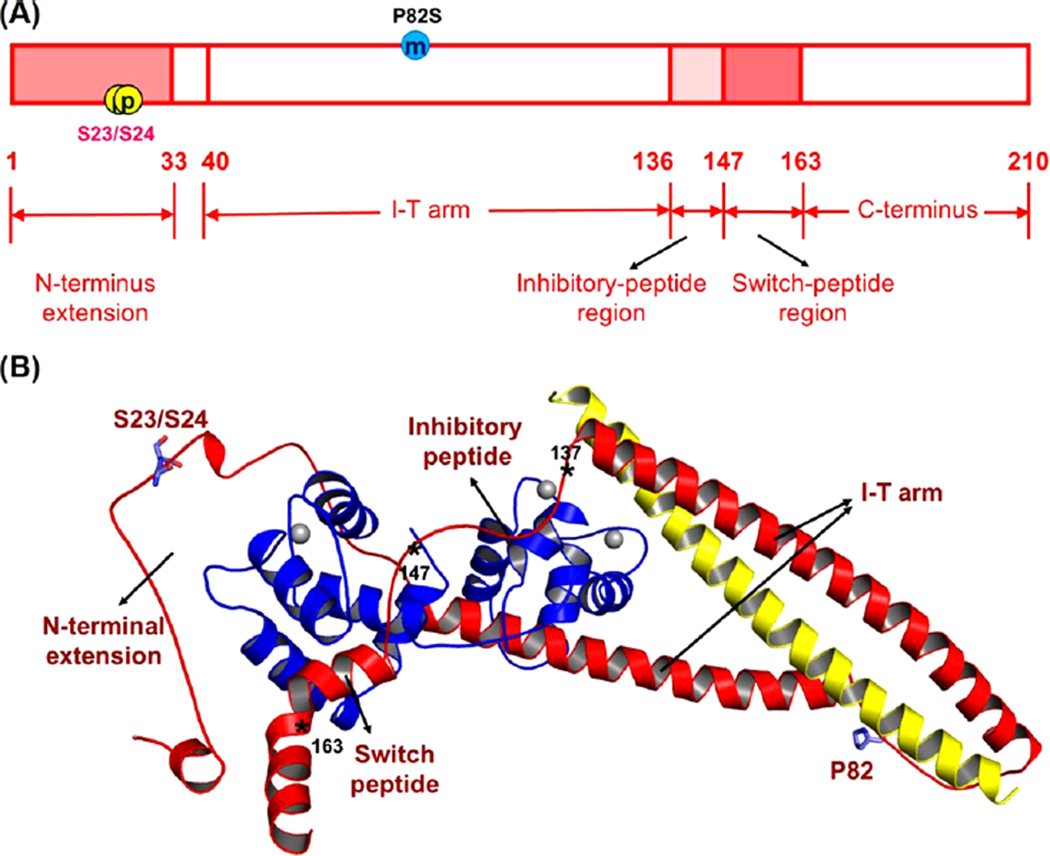
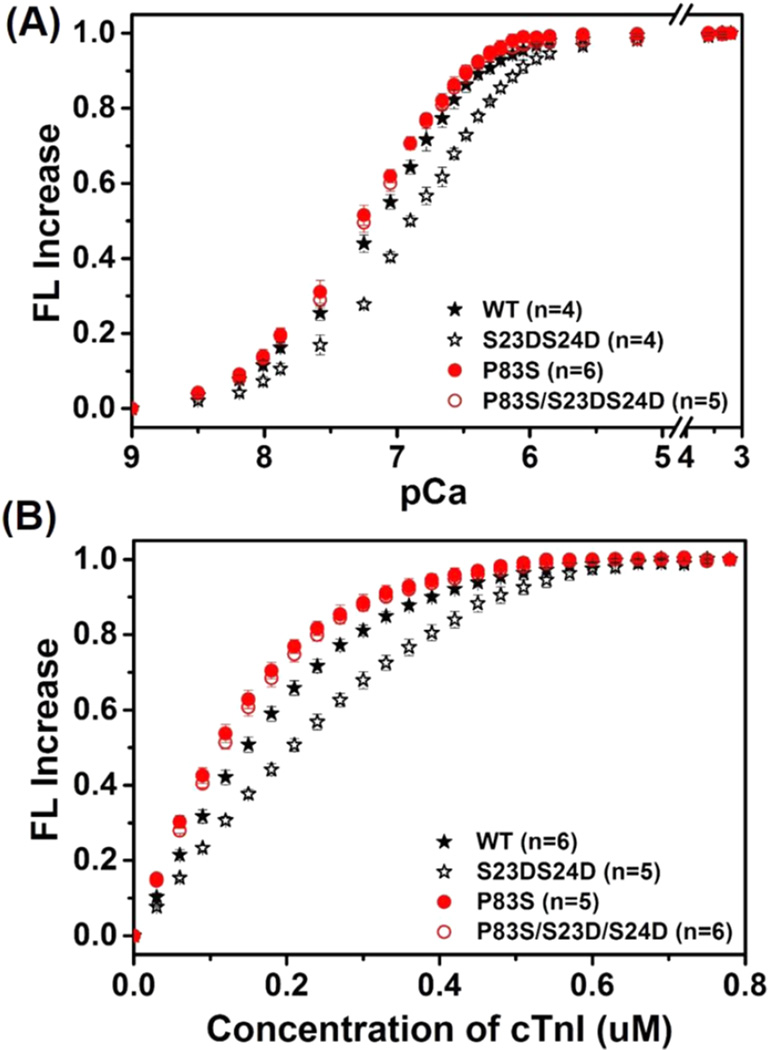
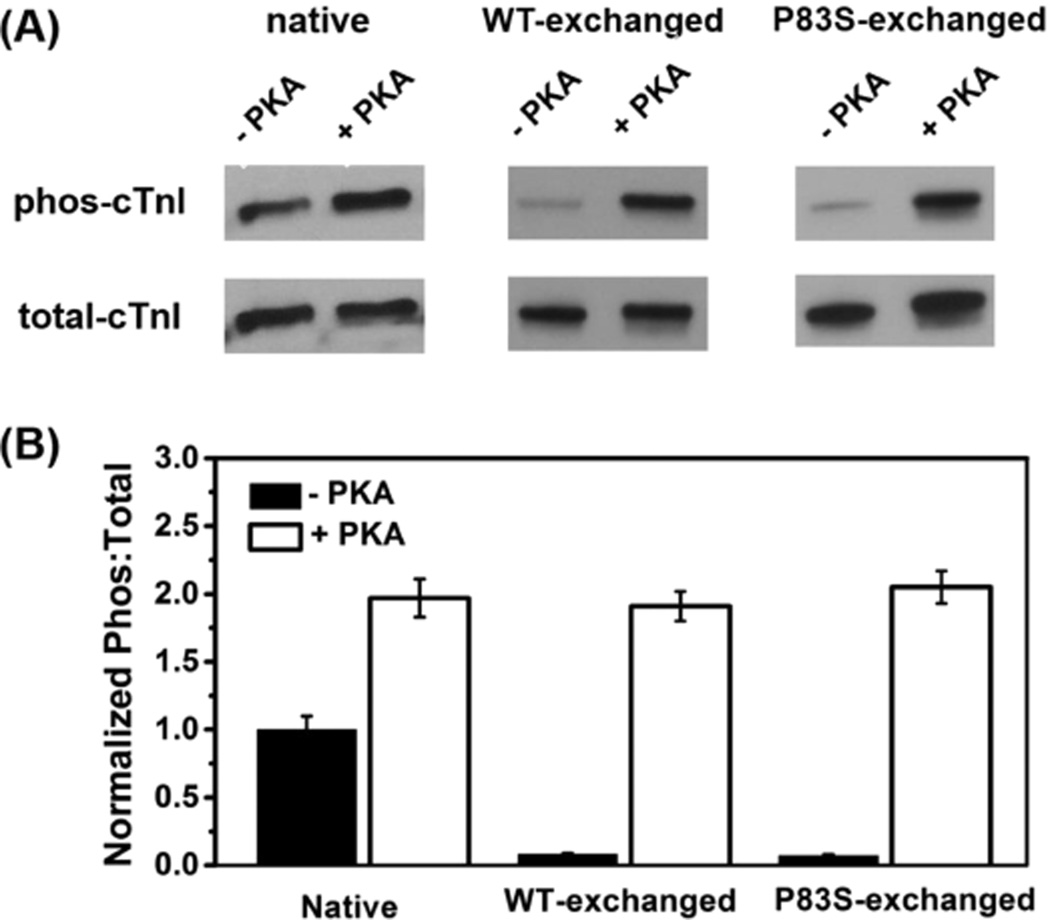
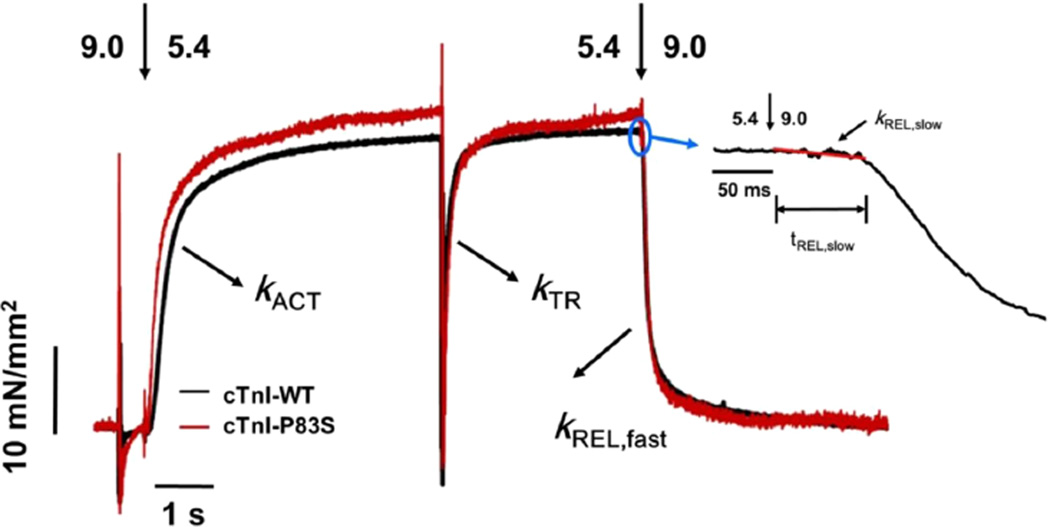
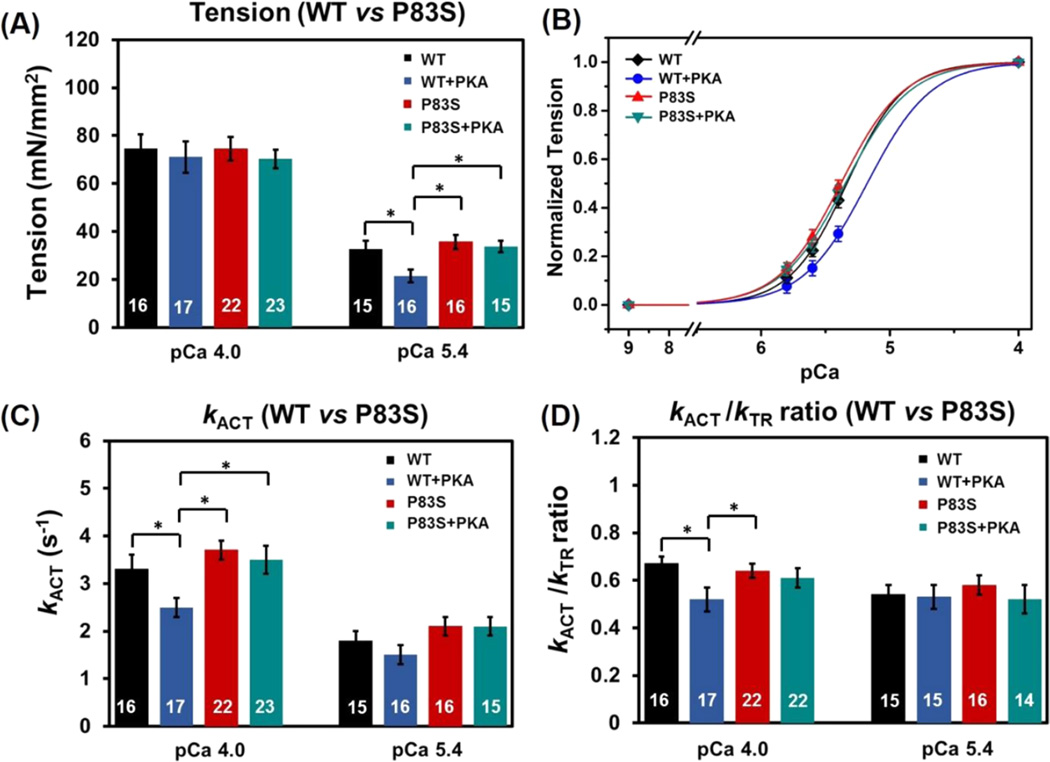
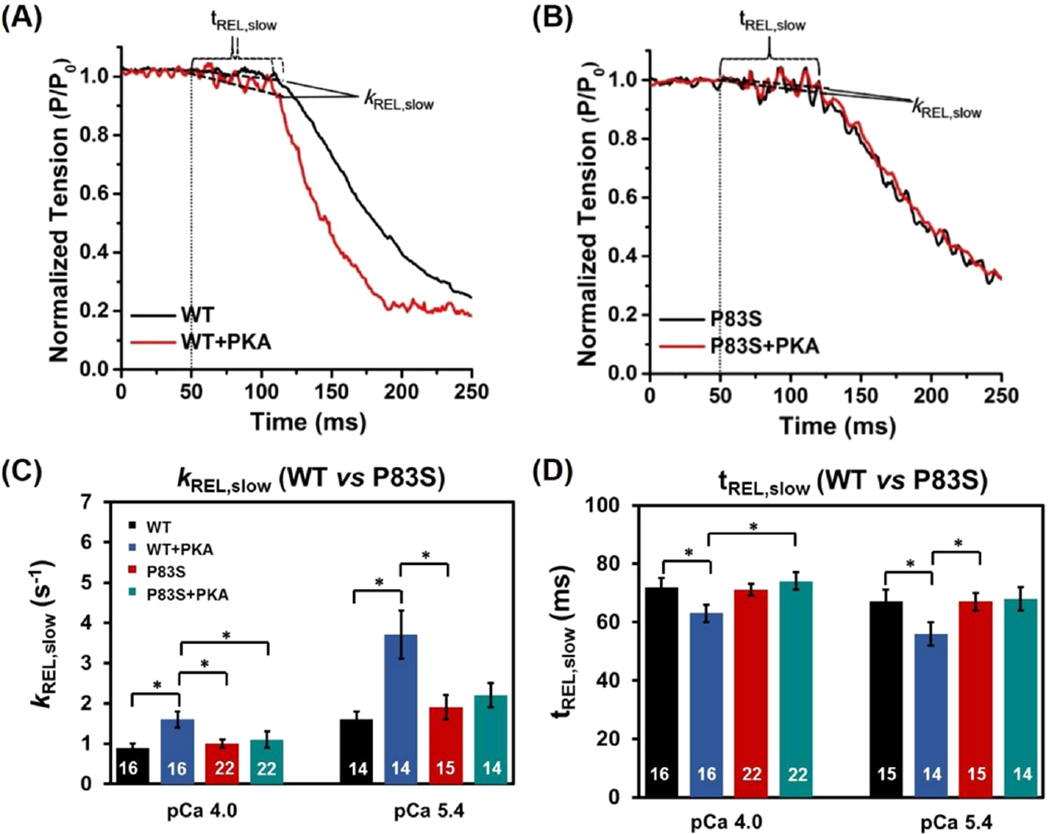
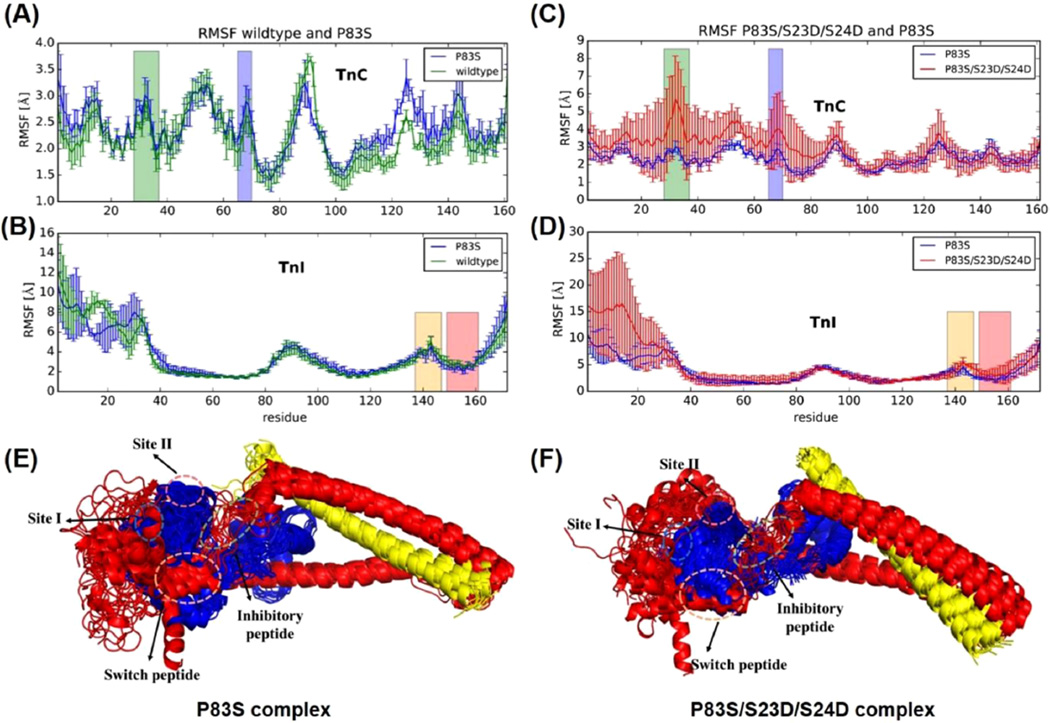
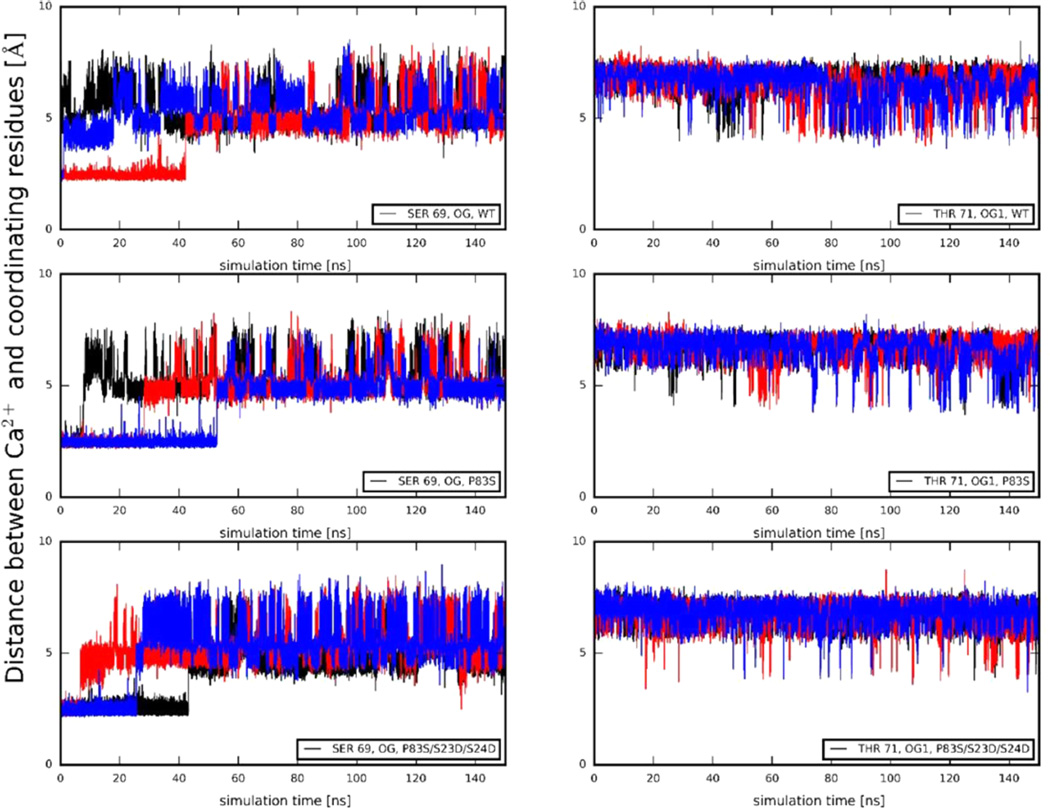
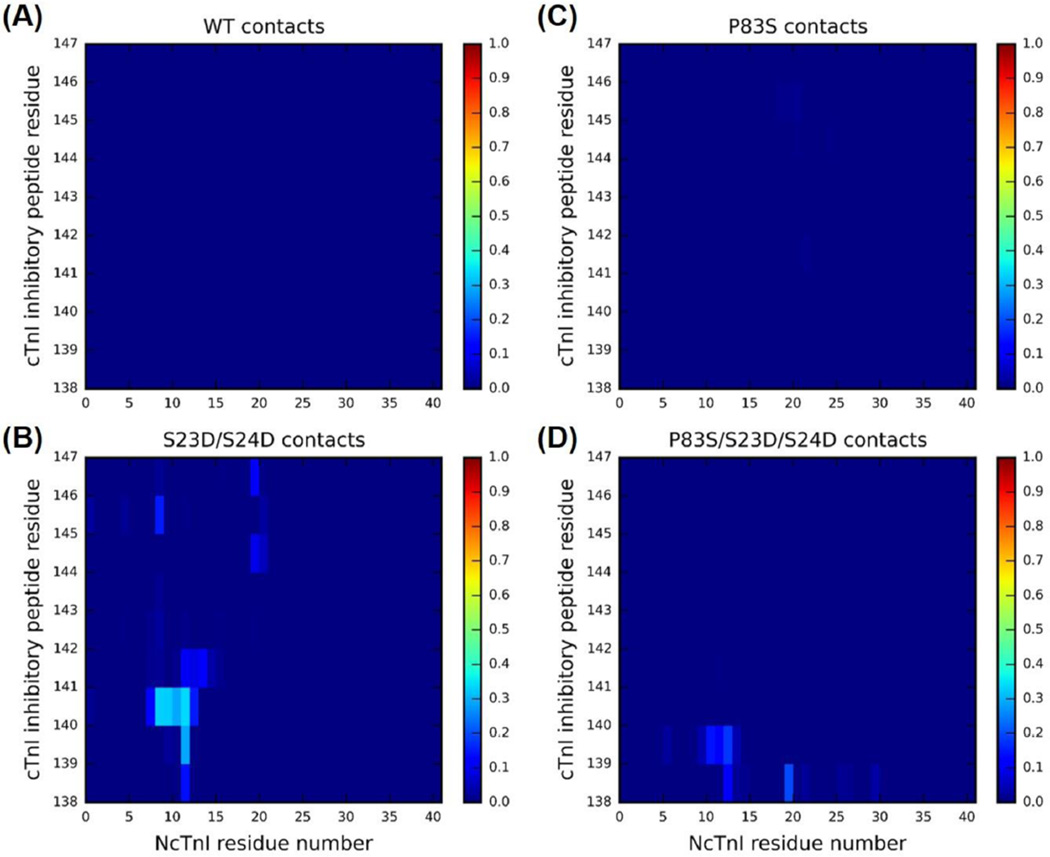
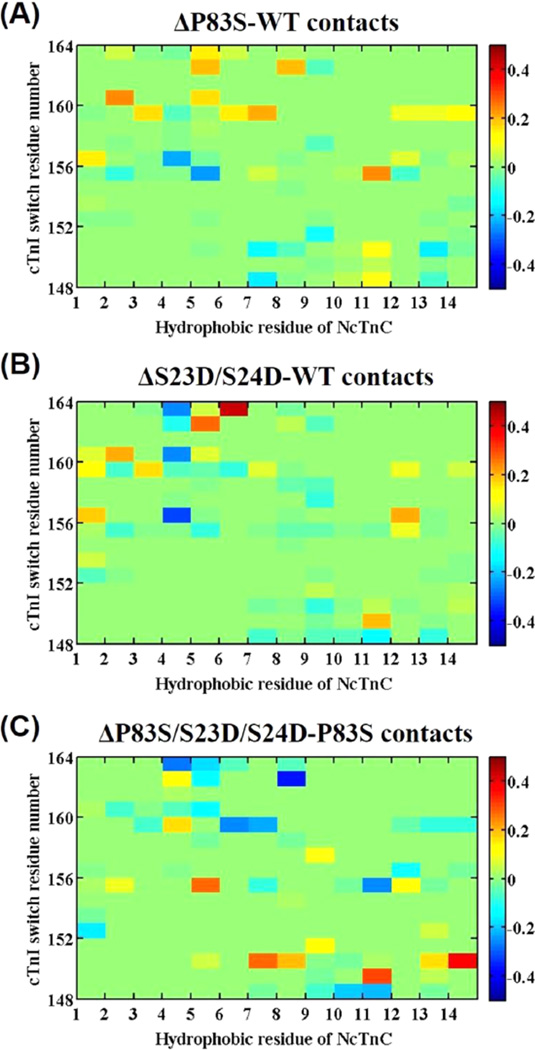
cTnI(P82S) (cTnI(P83S) in rodents) resides at the I-T arm of cardiac troponin I (cTnI) and was initially identified as a disease-causing mutation of hypertrophic cardiomyopathy (HCM). However, later studies suggested this may not be true. We recently reported that introduction of an HCM-associated mutation in either inhibitory-peptide (cTnI(R146G)) or cardiac-specific N-terminus (cTnI(R21C)) of cTnI blunts the PKA-mediated modulation on myofibril activation/relaxation kinetics by prohibiting formation of intrasubunit contacts between these regions. Here, we tested whether this also occurs for cTnI(P83S). cTnI(P83S) increased both Ca(2+) binding affinity to cTn (KCa) and affinity of cTnC for cTnI (KC-I), and eliminated the reduction of KCa and KC-I observed for phosphorylated-cTnI(WT). In isolated myofibrils, cTnI(P83S) maintained maximal tension (TMAX) and Ca(2+) sensitivity of tension (pCa50). For cTnI(WT) myofibrils, PKA-mediated phosphorylation decreased pCa50 and sped up the slow-phase relaxation (especially for those Ca(2+) conditions that heart performs in vivo). Those effects were blunted for cTnI(P83S) myofibrils. Molecular-dynamics simulations suggested cTnI(P83S) moderately inhibited an intrasubunit interaction formation between inhibitory-peptide and N-terminus, but this "blunting" effect was weaker than that with cTnI(R146G) or cTnI(R21C). In summary, cTnI(P83S) has similar effects as other HCM-associated cTnI mutations on troponin and myofibril function even though it is in the I-T arm of cTnI.
Figures
Similar articles
-
Troponin I Mutations R146G and R21C Alter Cardiac Troponin Function, Contractile Properties, and Modulation by Protein Kinase A (PKA)-mediated Phosphorylation.J Biol Chem. 2015 Nov 13;290(46):27749-66. doi: 10.1074/jbc.M115.683045. Epub 2015 Sep 21. J Biol Chem. 2015. PMID: 26391394 Free PMC article.
-
PKA phosphorylation of cardiac troponin I modulates activation and relaxation kinetics of ventricular myofibrils.Biophys J. 2014 Sep 2;107(5):1196-1204. doi: 10.1016/j.bpj.2014.07.027. Biophys J. 2014. PMID: 25185555 Free PMC article.
-
Generation and functional characterization of knock-in mice harboring the cardiac troponin I-R21C mutation associated with hypertrophic cardiomyopathy.J Biol Chem. 2012 Jan 13;287(3):2156-67. doi: 10.1074/jbc.M111.294306. Epub 2011 Nov 15. J Biol Chem. 2012. PMID: 22086914 Free PMC article.
-
Cardiac troponin structure-function and the influence of hypertrophic cardiomyopathy associated mutations on modulation of contractility.Arch Biochem Biophys. 2016 Jul 1;601:11-21. doi: 10.1016/j.abb.2016.02.004. Epub 2016 Feb 4. Arch Biochem Biophys. 2016. PMID: 26851561 Free PMC article. Review.
-
The Importance of Intrinsically Disordered Segments of Cardiac Troponin in Modulating Function by Phosphorylation and Disease-Causing Mutations.Front Physiol. 2016 Nov 2;7:508. doi: 10.3389/fphys.2016.00508. eCollection 2016. Front Physiol. 2016. PMID: 27853436 Free PMC article. Review.
Cited by
-
Umbrella Sampling Simulations Measure Switch Peptide Binding and Hydrophobic Patch Opening Free Energies in Cardiac Troponin.J Chem Inf Model. 2022 Nov 28;62(22):5666-5674. doi: 10.1021/acs.jcim.2c00508. Epub 2022 Oct 25. J Chem Inf Model. 2022. PMID: 36283742 Free PMC article.
-
Molecular Dynamics and Umbrella Sampling Simulations Elucidate Differences in Troponin C Isoform and Mutant Hydrophobic Patch Exposure.J Phys Chem B. 2018 Aug 16;122(32):7874-7883. doi: 10.1021/acs.jpcb.8b05435. Epub 2018 Aug 2. J Phys Chem B. 2018. PMID: 30070845 Free PMC article.
-
Multiscale Models of Cardiac Muscle Biophysics and Tissue Remodeling in Hypertrophic Cardiomyopathies.Curr Opin Biomed Eng. 2019 Sep;11:35-44. doi: 10.1016/j.cobme.2019.09.005. Epub 2019 Sep 18. Curr Opin Biomed Eng. 2019. PMID: 31886450 Free PMC article.
-
Computational Exploration and Characterization of Potential Calcium Sensitizing Mutations in Cardiac Troponin C.J Chem Inf Model. 2022 Dec 12;62(23):6201-6208. doi: 10.1021/acs.jcim.2c01132. Epub 2022 Nov 16. J Chem Inf Model. 2022. PMID: 36383927 Free PMC article.
-
Mechanistic complexity of contractile dysfunction in hypertrophic cardiomyopathy.J Gen Physiol. 2018 Aug 6;150(8):1051-1053. doi: 10.1085/jgp.201812091. Epub 2018 Jul 23. J Gen Physiol. 2018. PMID: 30037852 Free PMC article.
References
-
- Maron BJ, Gardin JM, Flack JM, Gidding SS, Kurosaki TT, Bild DE. Prevalence of Hypertrophic Cardiomyopathy in a General-Population of Young-Adults - Echocardiographic Analysis of 4111 Subjects in the Cardia Study. Circulation. 1995;92:785–789. - PubMed
-
- Elliott P, Andersson B, Arbustini E, Bilinska Z, Cecchi F, Charron P, Dubourg O, Hl UKR, Maisch B, McKenna WJ, et al. Classification of the Cardiomyopathies: A Position Statement from the European Society of Cardiology Working Group on Myocardial and Pericardial Diseases. Eur. Heart J. 2008;29:270–276. - PubMed
-
- Mogensen J, Murphy RT, Kubo T, Bahl A, Moon JC, Klausen IC, Elliott PM, McKenna WJ. Frequency and Clinical Expression of Cardiac Troponin I Mutations in 748 Consecutive Families with Hypertrophic Cardiomyopathy. J. Am. Coll. Cardiol. 2004;44:2315–2325. - PubMed
-
- Tester DJ, Ackerman MJ. Cardiomyopathic and Channelopathic Causes of Sudden Unexplained Death in Infants and Children. Annu. Rev. Med. 2009;60:69–84. - PubMed
-
- Willott RH, Gomes AV, Chang AN, Parvatiyar MS, Pinto JR, Potter JD. Mutations in Troponin That Cause Hcm, Dcm and Rcm: What Can We Learn About Thin Filament Function? J. Mol. Cell. Cardiol. 2010;48:882–892. - PubMed
Publication types
MeSH terms
Substances
Grants and funding
LinkOut - more resources
Full Text Sources
Other Literature Sources
Research Materials
Miscellaneous
