

Sitagliptin vs. placebo for non-alcoholic fatty liver disease: A randomized controlled trial
- PMID: 27151177
- PMCID: PMC5081213
- DOI: 10.1016/j.jhep.2016.04.021
Sitagliptin vs. placebo for non-alcoholic fatty liver disease: A randomized controlled trial
Abstract
Background & aims: Uncontrolled studies show sitagliptin, an oral DPP-4 inhibitor, may improve alanine aminotransferase and liver histology in non-alcoholic fatty liver disease (NAFLD) patients. We aimed to compare sitagliptin vs. the efficacy of a placebo in reducing liver fat measured by MRI-derived proton density-fat fraction (MRI-PDFF).
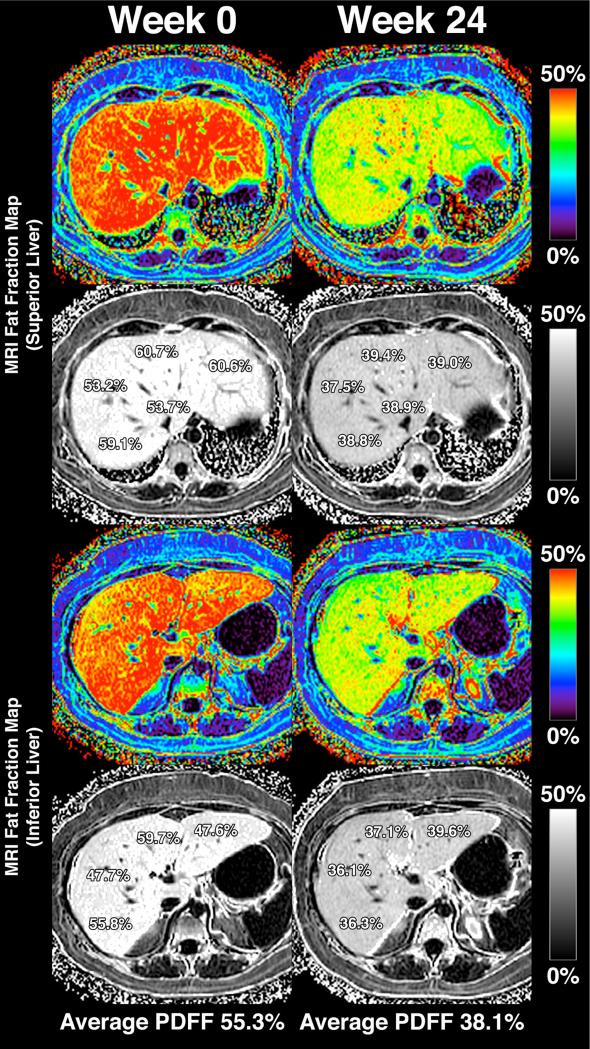
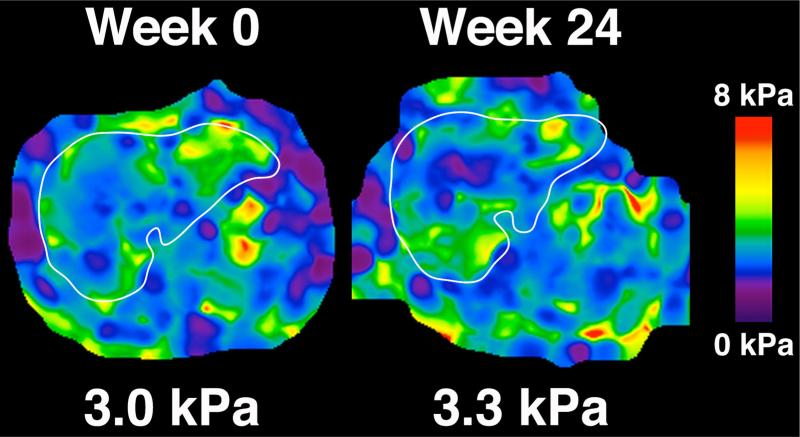
Methods: This randomized, double-blind, allocation-concealed, placebo-controlled trial included 50 NAFLD patients with prediabetes or early diabetes randomized to sitagliptin orally 100mg/day or placebo for 24weeks. Primary outcome was liver fat change measured by MRI-PDFF in colocalized regions of interest within each of nine liver segments. Additional advanced assessments included MR spectroscopy (MRS) for internal validation of MRI-PDFF's accuracy, and magnetic resonance elastography (MRE) and FIBROSpect® II to assess liver fibrosis.
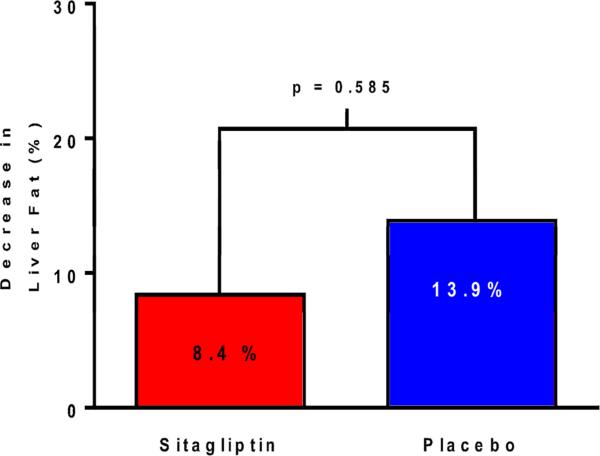
Results: Sitagliptin was not significantly better than placebo in reducing liver fat measured by MRI-PDFF (mean difference between sitagliptin and placebo arms: -1.3%, p=0.4). Compared to baseline, there were no significant differences in end-of-treatment MRI-PDFF for sitagliptin (18.1% to 16.9%, p=0.27) or placebo (16.6% to 14.0%, p=0.07). The groups had no significant differences for changes in alanine aminotransferase, aspartate aminotransferase, low-density lipoprotein, homeostatic model assessment insulin resistance, and MRE-derived liver stiffness. In both groups at baseline and post-treatment, MRI-PDFF and MRS showed robust correlation coefficients ranging from r(2)=0.96 to r(2)=0.99 (p<0.0001), demonstrating the strong internal validity of the findings. FIBROSpect® II showed no changes in the sitagliptin group but was significantly increased in the placebo group (p=0.03).
Conclusions: Sitagliptin was safe but not better than placebo in reducing liver fat in prediabetic or diabetic patients with NAFLD.
Lay summary: In a randomized, double-blind, placebo-controlled study, the anti-diabetic drug sitagliptin was no more effective than placebo for improving liver fat and liver fibrosis in patients with non-alcoholic fatty liver disease. This study demonstrates that non-invasive magnetic resonance imaging techniques, including magnetic resonance imaging-proton density-fat fraction and magnetic resonance elastography, can be used to assess treatment response in non-alcoholic fatty liver disease clinical trials.
Keywords: Biomarker; Fat mapping; Fibrosis; Hepatic steatosis; Imaging; Lipid lowering therapy; MRI-proton-density-fat-fraction (PDFF); Magnetic resonance elastography; NAFLD; Non-alcoholic steatohepatitis; Non-invasive assessment; Sitagliptin.
Copyright © 2016 European Association for the Study of the Liver. Published by Elsevier B.V. All rights reserved.
Figures
References
-
- Chalasani N, Younossi Z, Lavine JE, et al. The diagnosis and management of non-alcoholic fatty liver disease: practice guideline by the American Gastroenterological Association, American Association for the Study of Liver Diseases, and American College of Gastroenterology. Gastroenterology. 2012;142:1592–609. - PubMed
-
- Browning JD, Szczepaniak LS, Dobbins R, et al. Prevalence of hepatic steatosis in an urban population in the United States: impact of ethnicity. Hepatology. 2004;40:1387–95. - PubMed
-
- Williams CD, Stengel J, Asike MI, et al. Prevalence of nonalcoholic fatty liver disease and nonalcoholic steatohepatitis among a largely middle-aged population utilizing ultrasound and liver biopsy: a prospective study. Gastroenterology. 2011;140:124–31. - PubMed
-
- Loomba R, Sanyal AJ. The global NAFLD epidemic. Nat Rev Gastroenterol Hepatol. 2013;10:686–90. - PubMed
-
- Wong VW, Chu WC, Wong GL, et al. Prevalence of non-alcoholic fatty liver disease and advanced fibrosis in Hong Kong Chinese: a population study using proton-magnetic resonance spectroscopy and transient elastography. Gut. 2012;61:409–15. - PubMed
Publication types
MeSH terms
Substances
Grants and funding
LinkOut - more resources
Full Text Sources
Other Literature Sources
Medical
Miscellaneous
