. 2016 Aug;65(2):354-62.
doi: 10.1016/j.jhep.2016.04.025. Epub 2016 May 2.

Removal of acetaminophen protein adducts by autophagy protects against acetaminophen-induced liver injury in mice

Affiliations

Removal of acetaminophen protein adducts by autophagy protects against acetaminophen-induced liver injury in mice

Hong-Min Ni et al. J Hepatol. 2016 Aug.

Abstract

Background & aims: Acetaminophen (APAP)-induced liver injury is the most frequent cause of acute liver failure in the US and many other countries. Metabolism of APAP results in formation of APAP protein adducts (APAP-AD) in hepatocytes and triggers mitochondrial dysfunction and necrosis. However, the mechanisms for how APAP-AD are removed from hepatocytes remain unknown.

Methods: Mice or primary hepatocytes were treated with APAP. APAP-AD were determined by immunoblot, immunostaining and high pressure liquid chomatography with electrochemical detection analysis.

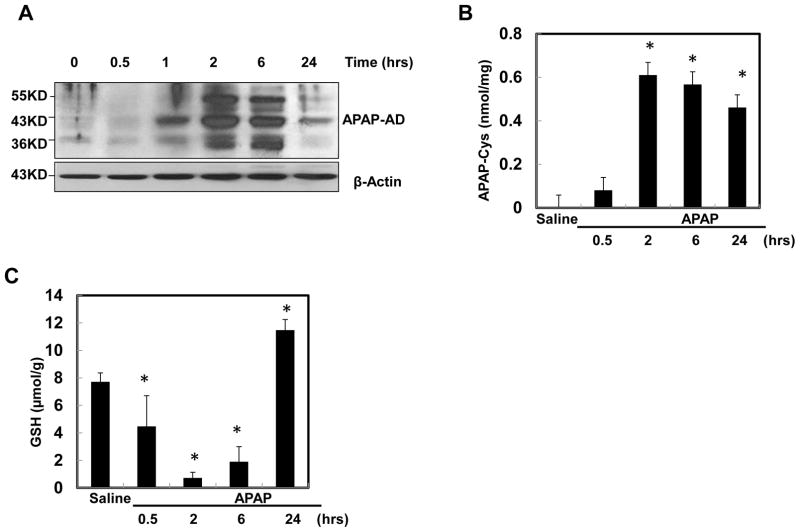
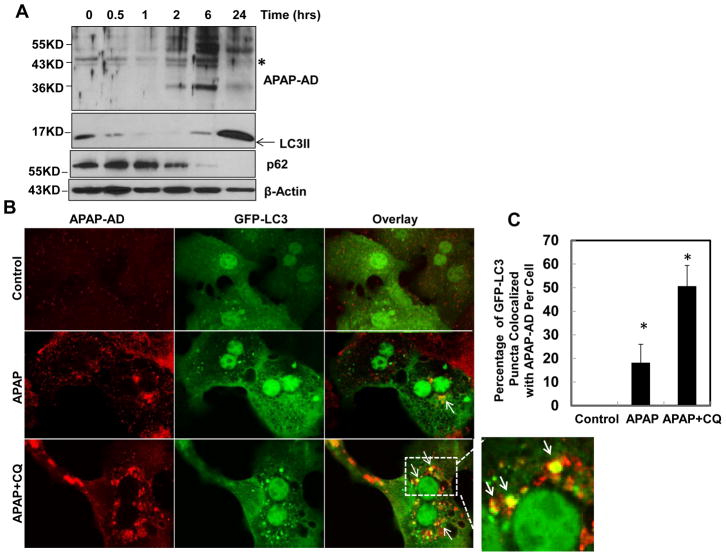
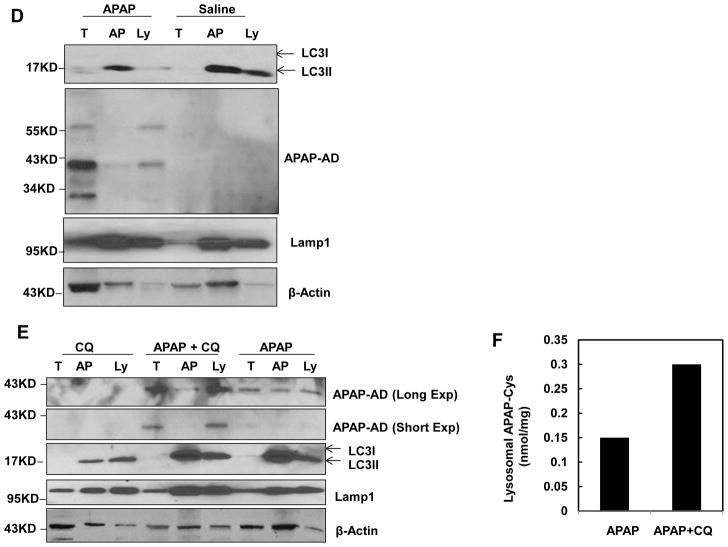
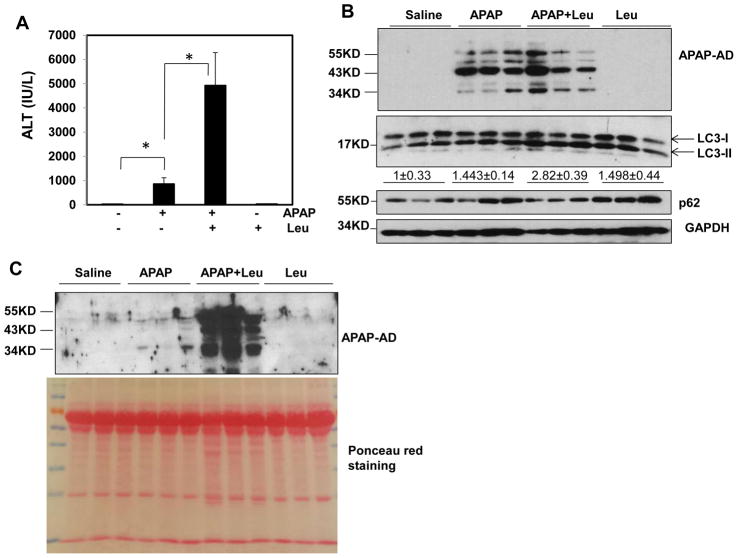
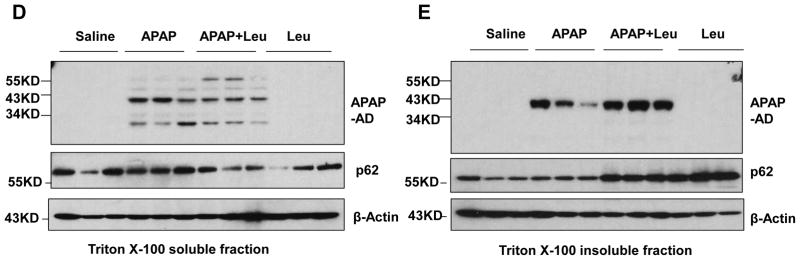
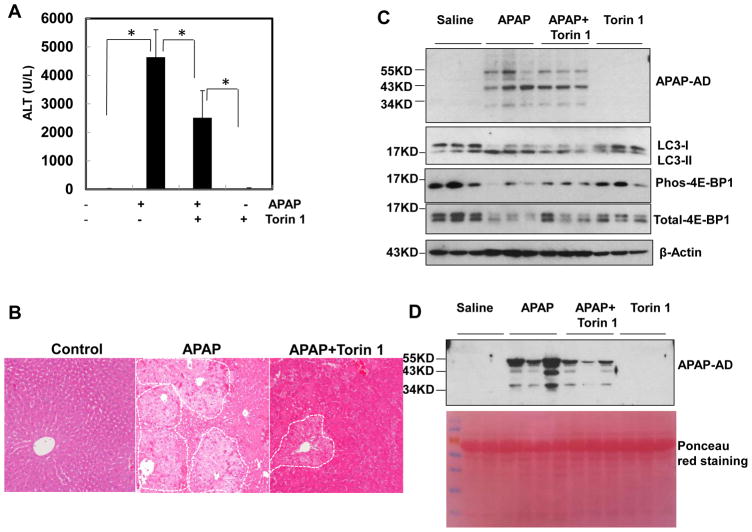
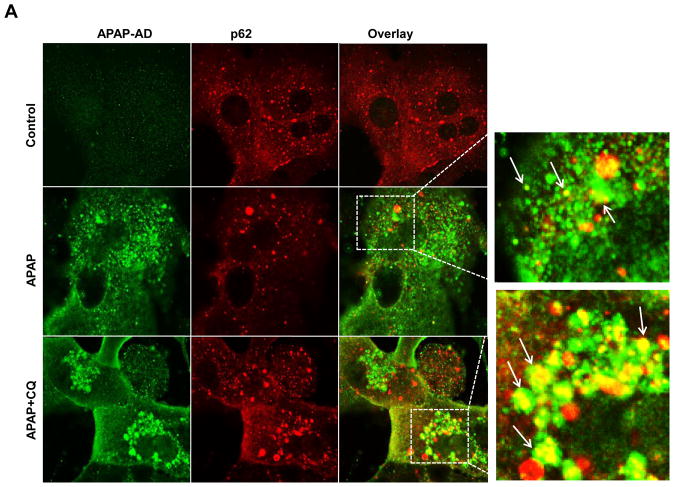
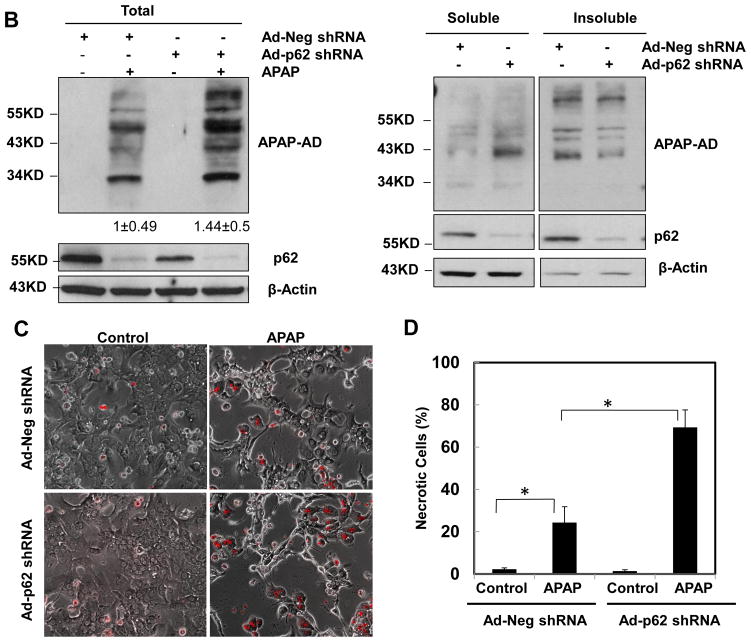
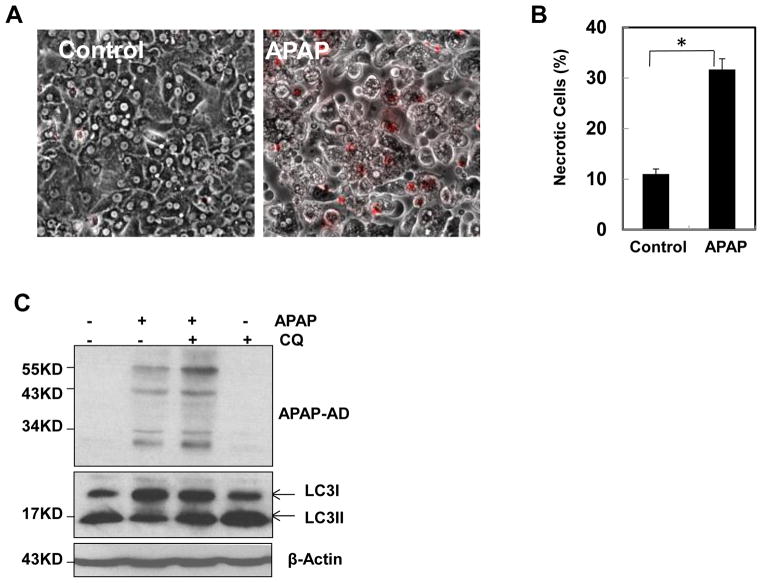
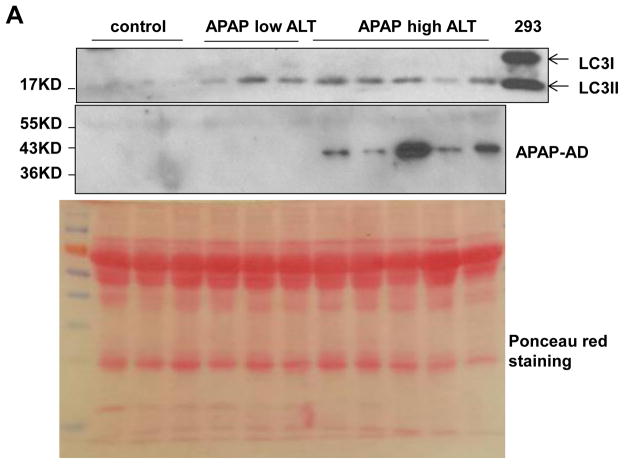
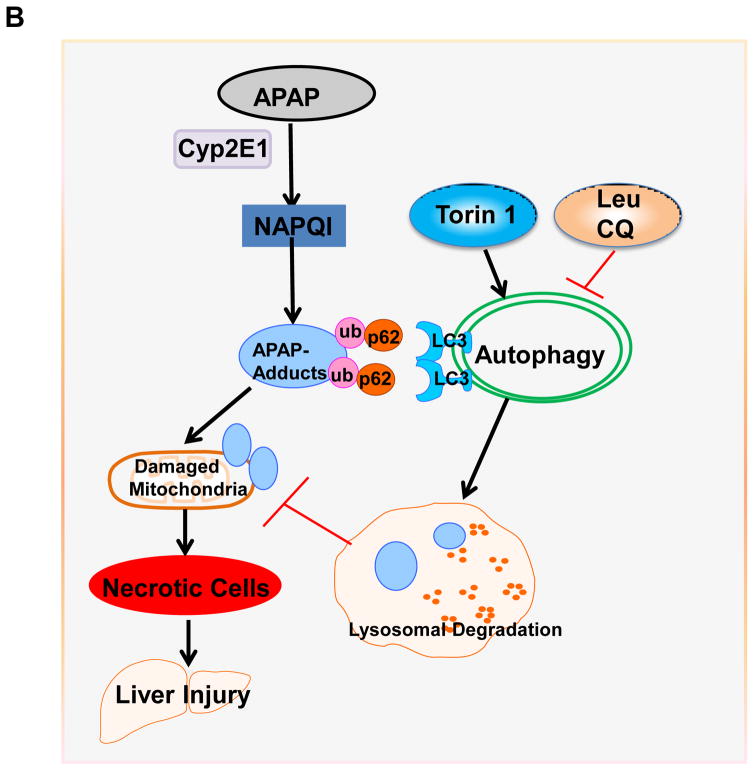
Results: We found that APAP-AD were detected at 1h, peaked at approximately 2h, declined at 6h and almost full removed at 24h post treatment with APAP in mouse livers and in primary mouse hepatocytes. APAP-AD displayed a punctate pattern and were colocalized with GFP-LC3 positive autophagosomes and Lamp1 positive lysosomes in APAP-treated primary hepatocytes. Moreover, isolated autophagosomes and autolysosomes from APAP-treated mouse livers contained APAP-AD, suggesting autophagy may selectively remove APAP-AD. APAP-AD were detected in both detergent soluble and insoluble pools in APAP-treated mouse livers and hepatocytes. More importantly, pharmacological inhibition of autophagy by leupeptin or chloroquine increased whereas induction of autophagy by Torin 1 decreased serum APAP-AD levels in APAP-treated mice, which correlated with alanine aminotransferase levels and liver necrosis. Furthermore, SQSTM1/p62, an autophagy receptor protein, was recruited to APAP-AD. Adenovirus-mediated shRNA knockdown of SQSTM1/p62 led to increased APAP-AD and necrosis in primary hepatocytes.

Conclusions: Our data indicate that APAP-AD are removed though selective autophagy. Pharmacological induction of autophagy may be a novel promising approach for treating APAP-induced liver injury.

Lay summary: Acetaminophen overdose can form acetaminophen protein adducts and mitochondria damage in hepatocytes resulting in liver injury. Activation of autophagy-lysosomal degradation pathway can help to remove acetaminophen protein adducts. Pharmacological induction of autophagy may be a novel promising approach for treating APAP-induced liver injury.

Keywords: Acetaminophen; Acetaminophen protein adducts; Autophagy; Liver injury; p62/SQSTM1.


Figures

Figure 1
Figure 1. The dynamic change of APAP-AD levels in mouse livers
Male C57BL/6J mice were treated with APAP (500 mg/kg) for different time points and pooled liver lysates from 3–4 mice of each group were subjected to western blot analysis (A) or HPLC-ED analysis (B) for APAP-AD (means ± SE, n=3–4). (C) Mice were treated as in (A) and total hepatic GSH contents were determined and data are presented as means ± SE (n=3–5). * P<0.05. One way anova analysis with Scheffé’s post hoc test.
Figure 2
Figure 2. Autophagy compartments are associated with APAP-AD
(A) Primary cultured mouse hepatocytes were treated with APAP (5 mM) for different time points and total cell lysates were subjected to western blot analysis. (B) Primary mouse hepatocytes were infected with adenovirus GFP-LC3 (10 moi) overnight and then treated with APAP (5 mM) in the presence or absence of CQ (20 μM) for 6 hrs. Cells were fixed and immunostained for APAP-AD followed by confocal microscopy. Representative images are shown. The right panel image was an enlarged photograph from the boxed area. Arrows denote the colocalization of GFP-LC3 positive puncta with APAP-AD. GFP-LC3 puncta that were colocalized with APAP-AD per cell were quantified and data are presented as means ± SE (n=3 independent experiments, more than 15 cells were counted) (C). * P<0.05. One way anova analysis with Scheffé’s post hoc test. (D & E) Male C57BL/6J mice were treated with saline, APAP (300 mg/kg), CQ (60 mg/kg) or APAP (300 mg/kg)+CQ (60 mg/kg) for 4 hrs. Mice were sacrificed and subjected to Nycodenz gradient centrifugation. Total lysates and isolated AP and Ly fractions were subjected to WB analysis. (F) Ly factions (200 μg) were combined from two mice and were further digested with proteinase K followed by HPLC analysis for APAP-Cys adducts.
Figure 3
Figure 3. Inhibition of autophagy by Leu increases serum APAP-AD levels and liver injury in mice
Male C57BL/6J mice were treated with APAP (500 mg/kg), or APAP+Leu (40 mg/kg) or Leu (40 mg/kg) for 6 hrs. (A) Serum ALT levels were analyzed and data are presented as means ± SE (n=3–5). * P<0.05. One way anova analysis with Scheffé’s post hoc test. (B) Total liver lysates and (C) serum were subjected to western blot analysis for APAP-AD. Data (means ± SE) were from the densitometry analysis of LC3-II levels compared to the control groups. The membrane for the serum samples was further stained with Poncea red to serve as the loading control. Detergent soluble (D) and insoluble fractions (E) were prepared from the liver tissues and subjected to western blot analysis for APAP-AD.
Figure 4
Figure 4. Activation of autophagy by Torin 1 decreases serum APAP-AD levels and liver injury in a post-APAP mouse model
Male C57BL/6J mice were first treated with APAP (500 mg/kg) for 2 hrs, then some mice were further treated with Torin 1 (2 mg/kg) or vehicle (4% methyl-β-cylcodextran in saline, i.p.) for another 6 hrs. (A) Serum ALT levels were analyzed and data are presented as means ± SE (n=4–5). * P<0.05. One way anova analysis with Scheffé’s post hoc test. (B) Representative H & E staining images were shown. (C) Total liver lysates and (D) serum were subjected to western blot analysis for APAP-AD. The membrane for the serum samples was further stained with Poncea red to serve as the loading control.
Figure 5
Figure 5. p62 is associated with APAP-AD and knockdown of p62 impairs the clearance of APAP-AD and enhanced APAP-induced hepatotoxicity
(A) Primary cultured mouse hepatocytes were treated with APAP (5 mM) in the presence or absence of CQ (20 μM) for 6 hrs. Cells were fixed and immunostained for APAP-AD and p62 followed by confocal microscopy. Representative images are shown. The right panel images were enlarged photographs from the boxed areas. Arrows denote the co-localization of p62 proteins with APAP-AD. (B) Primary cultured mouse hepatocytes were infected with either an adenovirus negative shRNA or adenovirus p62 shRNA for 24 hrs and then treated with APAP (5 mM) for 6 hrs. Total cell lysates, detergent soluble and insoluble fractions were subjected to western blot analysis. The levels of APAP-AD were quantified by densitometry analysis and showed below the blot (n=3 independent experiments). (C) Experiments were performed as in (B) and the cells were further treated with APAP (5 mM) for 24 hrs. The cells were stained with PI (1 μg/mL) followed by fluorescence microscopy. Representative images for the overlayed phase-contrast and PI stained images are shown. The number of PI positive cells were quantified and data are presented as means ± SE (n=3 independent experiments, more than 100 cells were counted in each experiment) (D). * P<0.05. One way anova analysis with Scheffé’s post hoc test.
Figure 6
Figure 6. Autophagy regulates APAP-AD in human hepatocytes
Primary cultured human hepatocytes were treated with APAP (10 mM) for 24 hrs. The cells were further stained with PI (1 μg/mL) followed by fluorescence microscopy. Representative images for the overlayed phase-contrast and PI stained images are shown (A). The number of PI positive necrotic cells were quantified and data are presented as means ± SE (n=3 independent experiments, more than 100 cells were counted in each experiment) (B). * P<0.05. One way anova analysis with Scheffé’s post hoc test. (C) Primary cultured human hepatocytes were treated with APAP (10 mM) in the presence or absence of CQ for 24 hrs. Total cell lysates were subjected to western blot analysis.
Figure 7
Figure 7. Serum levels of APAP-AD and autophagy proteins in humans
(A) Forty micrograms of serum from healthy volunteers or APAP overdose patients with either low or high ALT values were subjected to western blot analysis. The membrane was further stained with Poncea red to serve as the loading control. Lysates from 293 cells were used as a positive control for LC3-II. (B) A proposed model for the regulation of APAP-AD and APAP-induced hepatotoxicity by autophagy. In hepatocytes, APAP is first metabolized through the cytochrome P450 enzymes (mainly via CYP2E1) and generates reactive metabolites NAPQI, which bind to cellular and mitochondrial proteins to form APAP-AD. Mitochondrial APAP-AD can trigger mitochondrial damage. Damaged mitochondria can lead to necrotic cell death and subsequent liver injury. The autophagy receptor protein p62 is recruited to APAP-AD, which may facilitate APAP-AD transition to the detergent insoluble form and allow their recognition and enwrappment by autophagosomes. Pharmacological induction of autophagy (Torin 1) or inhibition of autophagy (Leu or CQ) improves or impairs autophagic removal of APAP-AD and results in protection or exacerbation of APAP-induced necrosis and liver injury, respectively.

References

    1. Larson AM. Acetaminophen hepatotoxicity. Clin Liver Dis. 2007;11:525–548. vi. - PubMed
    1. McGill MR, Jaeschke H. Metabolism and disposition of acetaminophen: recent advances in relation to hepatotoxicity and diagnosis. Pharm Res. 2013;30:2174–2187. - PMC - PubMed
    1. Hinson JA, Roberts DW, James LP. Mechanisms of acetaminophen-induced liver necrosis. Handb Exp Pharmacol. 2010:369–405. - PMC - PubMed
    1. Nelson SD. Molecular mechanisms of the hepatotoxicity caused by acetaminophen. Semin Liver Dis. 1990;10:267–278. - PubMed
    1. Mitchell JR, Jollow DJ, Potter WZ, Davis DC, Gillette JR, Brodie BB. Acetaminophen-induced hepatic necrosis. I. Role of drug metabolism. J Pharmacol Exp Ther. 1973;187:185–194. - PubMed