Modulation of gut microbiota dysbioses in type 2 diabetic patients by macrobiotic Ma-Pi 2 diet
- PMID: 27151248
- PMCID: PMC4894062
- DOI: 10.1017/S0007114516001045
Modulation of gut microbiota dysbioses in type 2 diabetic patients by macrobiotic Ma-Pi 2 diet
Abstract
The gut microbiota exerts a role in type 2 diabetes (T2D), and deviations from a mutualistic ecosystem layout are considered a key environmental factor contributing to the disease. Thus, the possibility of improving metabolic control in T2D by correcting gut microbiome dysbioses through diet has been evaluated. Here, we explore the potential of two different energy-restricted dietary approaches - the fibre-rich macrobiotic Ma-Pi 2 diet or a control diet recommended by Italian professional societies for T2D treatment - to correct gut microbiota dysbioses in T2D patients. In a previous 21-d open-label MADIAB trial, fifty-six overweight T2D patients were randomised to the Ma-Pi 2 or the control diet. For the present study, stools were collected before and after intervention from a subset of forty MADIAB participants, allowing us to characterise the gut microbiota by 16S rRNA sequencing and imputed metagenomics. To highlight microbiota dysbioses in T2D, the gut microbiota of thirteen normal-weight healthy controls were characterised. According to our findings, both diets were effective in modulating gut microbiome dysbioses in T2D, resulting in an increase of the ecosystem diversity and supporting the recovery of a balanced community of health-promoting SCFA producers, such as Faecalibacterium, Roseburia, Lachnospira, Bacteroides and Akkermansia. The Ma-Pi 2 diet, but not the control diet, was also effective in counteracting the increase of possible pro-inflammatory groups, such as Collinsella and Streptococcus, in the gut ecosystem, showing the potential to reverse pro-inflammatory dysbioses in T2D, and possibly explaining the greater efficacy in improving the metabolic control.
Keywords: CTR control diet; Dysbiosis; FBG fasting blood glucose; Fibre-rich diets; GM gut microbiota; Gut microbiota; KO KEGG Orthology; Macrobiotic diets; PCoA principal coordinates analysis; T2D type 2 diabetes; Type 2 diabetes.
Figures

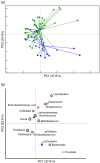
 , Healthy controls;
  ,
T2D patients. P<0·001; permutation test with pseudo
F ratios. (b) Superimposition of microbial genera on the PCoA
plot in order to identify the genera involved in this separation. Sphere width is
proportional to the mean relative abundance of the genus across all samples. The two
components explain 37·8 and 23·9 % of the variance, respectively.
  ,
,
 , Centroids for each group with indication
of standard errors on each coordinate axis; uncl, unclassified.
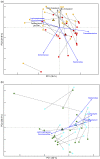
 , Ma-Pi 2 diet group at T0;
 , control (CTR) diet group at T0;
 , healthy controls;
  ,
Ma-Pi 2 diet group at T1;
  , CTR diet group at T1. For each group,
average (±
 )
and T1 (
 ). The two components explain 35·0 and
24·8 % of the variance, respectively. P=0·01; permutation test with
pseudo F ratios. (b) PCoA based on weighted UniFrac distances for
T2D subjects following the control (CTR) diet (n 19).
 , T0;
, T0;  , T1. The two
components explain 32·0 and 20·2 % of the variance, respectively.
P=0·04; permutation test with pseudo F ratios.
Lines connect T0 and T1 samples from the same patient.
  ,
,
 responding bacterial genera and
biochemical parameters, respectively;
  , direction of
significant correlations;
  ,
,  ,
,  ,
,
 , centroids for each time point.
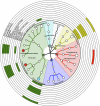
 ). T2D patients following the Ma-Pi 2
diet (n 21); T2D patients following the CTR diet
(n 19); healthy controls (n 13).
 , Firmicutes;
  ,
Bacteroidetes;
  , Proteobacteria;
  ,
Actinobacteria;
  , Verrucomicrobia;
  ,
Synergistetes). Families with relative abundance of at least 0·5 % in at least two
samples are plotted. Larger circles identify bacterial families having a positive
correlation with at least one dietary component; the names of these families are
reported. Filled circles identify bacterial families that showed significantly
higher abundance in T1 samples of the Ma-Pi 2 diet group (
 )
or the CTR diet group (
 ). Bacterial family-food component
correlations are indicated by filled boxes in the external rings of the plot,
referring to the list of dietary components. T2D patients following the Ma-Pi 2 diet
(n 21); T2D patients following the CTR diet (n
19).
 , Healthy controls (n
13);
  , T2D patients (n 40).
Sphere width is proportional to the mean relative abundance of the function across
all samples. The two components explain 14·0 and 9·2 % of the variance,
respectively. P=0·03; permutation test with pseudo
F ratios.
  ,
,  , Centroids for each
group with indication of standard errors on each coordinate axis.
 ) and after (T1,
  )
the Ma-Pi 2 diet (n 21). The two components explain 22·3 and 14·9 %
of the variance, respectively. P=0·007; permutation test with
pseudo F ratios.
  ,
,  ,
Centroids for each group with indication of standard errors on each coordinate
axis.
,
Centroids for each group with indication of standard errors on each coordinate
axis.References
Publication types
MeSH terms
LinkOut - more resources
Full Text Sources
Other Literature Sources
Medical
Research Materials
Miscellaneous

