. 2016 May 6:7:11485.
doi: 10.1038/ncomms11485.

MNase titration reveals differences between nucleosome occupancy and chromatin accessibility

Affiliations

MNase titration reveals differences between nucleosome occupancy and chromatin accessibility

Jakub Mieczkowski et al. Nat Commun. .

Abstract

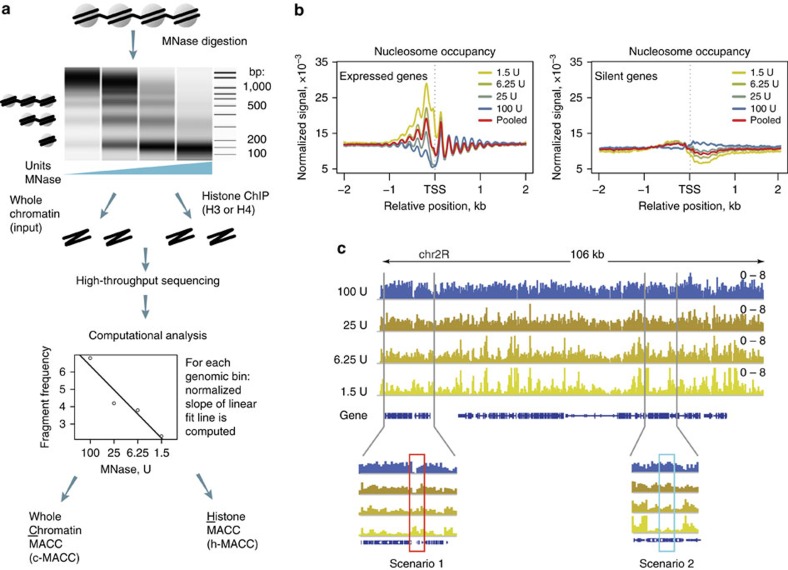
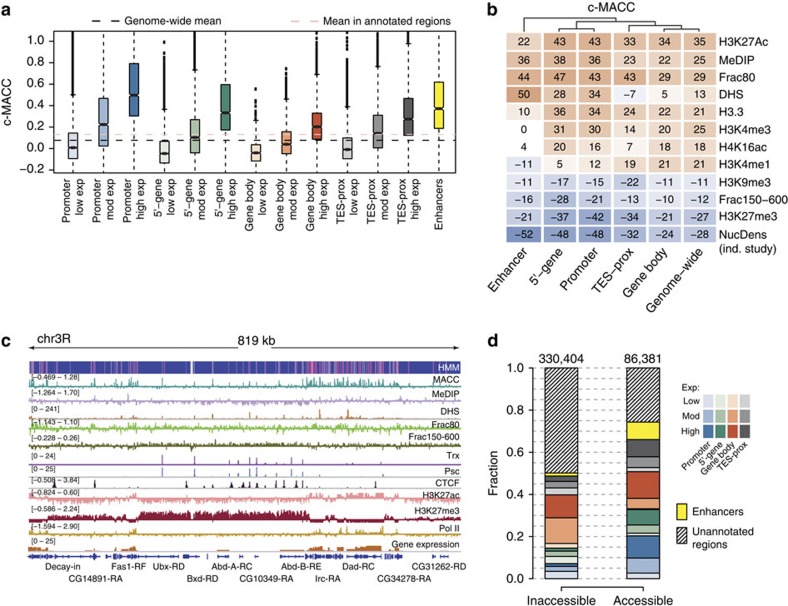
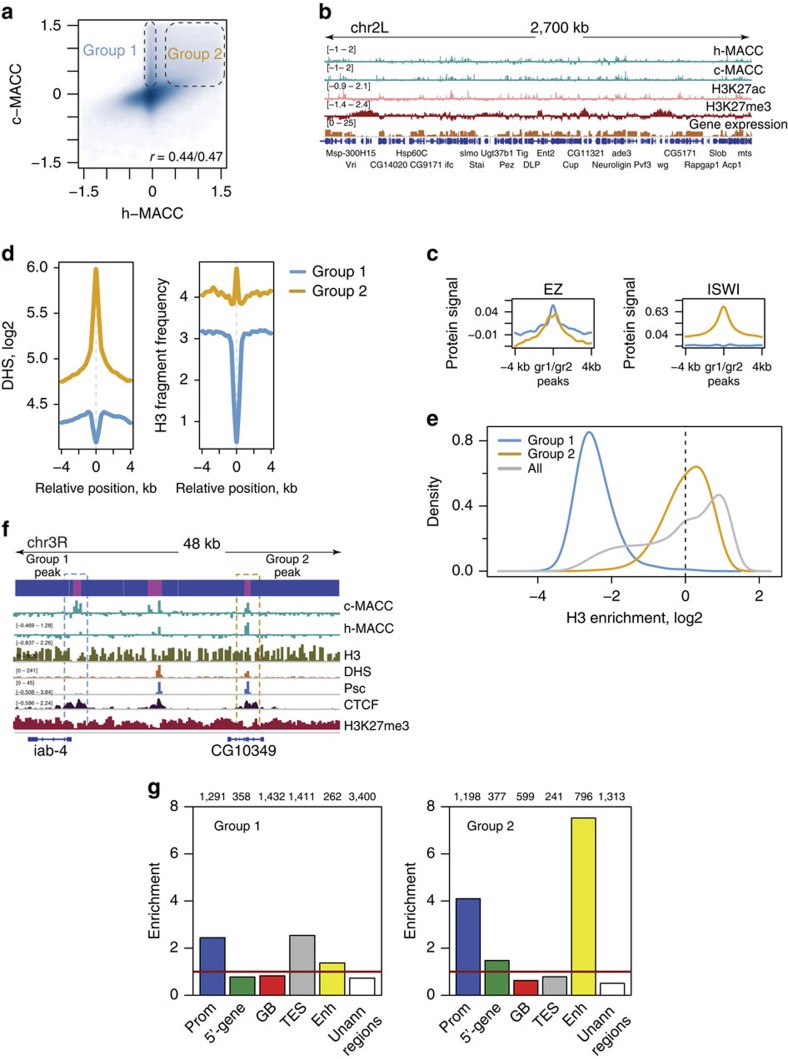
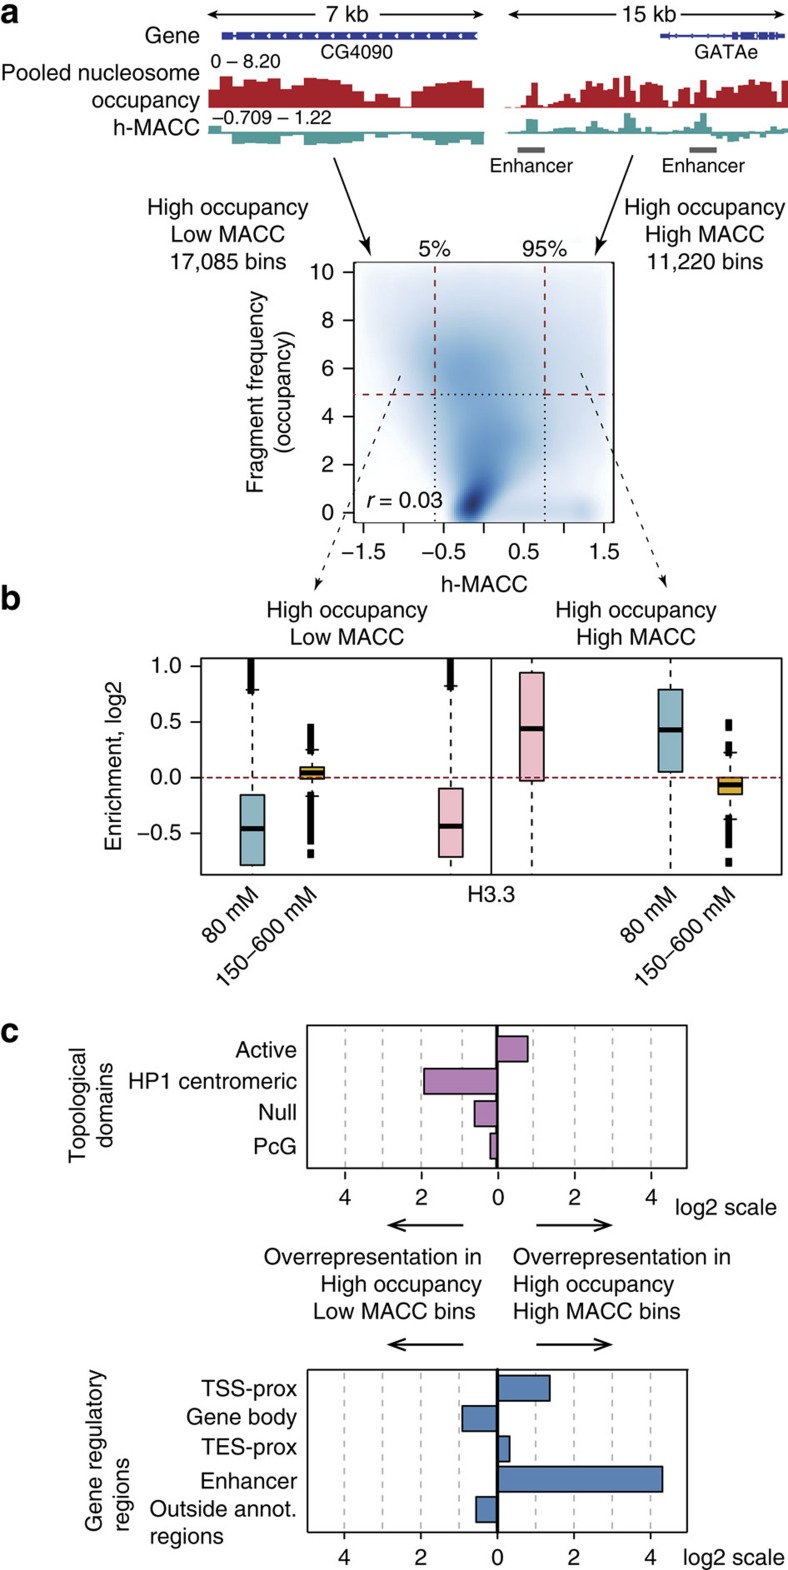
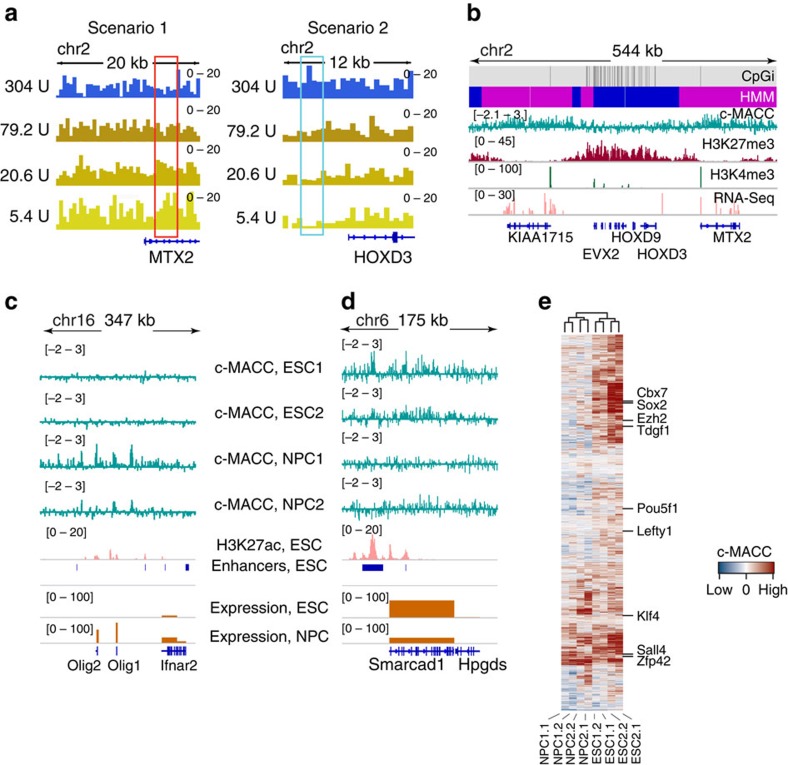
Chromatin accessibility plays a fundamental role in gene regulation. Nucleosome placement, usually measured by quantifying protection of DNA from enzymatic digestion, can regulate accessibility. We introduce a metric that uses micrococcal nuclease (MNase) digestion in a novel manner to measure chromatin accessibility by combining information from several digests of increasing depths. This metric, MACC (MNase accessibility), quantifies the inherent heterogeneity of nucleosome accessibility in which some nucleosomes are seen preferentially at high MNase and some at low MNase. MACC interrogates each genomic locus, measuring both nucleosome location and accessibility in the same assay. MACC can be performed either with or without a histone immunoprecipitation step, and thereby compares histone and non-histone protection. We find that changes in accessibility at enhancers, promoters and other regulatory regions do not correlate with changes in nucleosome occupancy. Moreover, high nucleosome occupancy does not necessarily preclude high accessibility, which reveals novel principles of chromatin regulation.


Figures

Figure 1
Figure 1. MNase concentration affects the results of nucleosome occupancy profiling.
(a) The workflow of the MNase accessibility (MACC) assay. Upper panel: capillary electrophoresis of digestion products from a typical MNase titration experiment. Middle: the digestion fragments are separated into two samples, those sequenced as whole-chromatin extract, and those sequenced after additional enrichment for histone-associated DNA using chromatin immunoprecipitation. Lower panel: quantification of the chromatin response measured in a four point MNase titration at a single location in the genome. Linear regression is fitted to the fragment frequencies obtained for a 300-bp bin at each MNase titration point. The logarithmic scale of MNase concentrations was used to obtain equidistant distribution of experimental points. The regression slope is used as a measure of DNA accessibility for MNase at this locus. Additional data-correction step was used to normalize MACC for GC content of underlying DNA sequence to address possible bias due to MNase sequence preferences (see Supplementary Information for detail). (b) MNase-seq profiles around TSS (transcription start sites) for expressed (left) and silent (right) genes. Yellow-blue colour scheme indicates MNase concentration levels (1.5, 6.25, 25 and 100 U), with bright yellow corresponding to the lowest concentration and dark blue corresponding to the highest. The red line depicts an averaged profile. (c) An example locus showing frequency profiles of the digestion fragments obtained from MNase titration. The colour scheme is the same as in b. Gene structure is indicated at the bottom of the plot. Two regions are expanded to illustrate the major scenarios of the chromatin response to MNase titration, with scenario 1 (‘open', red box) showing increasing nucleosome signal with decreasing MNase levels, and scenario 2 (‘closed', blue box) showing decreasing nucleosome signal with decreasing MNase levels.
Figure 2
Figure 2. Relation of MACC to other markers of chromatin structure and annotated regions of the genome.
(a) Distribution of MACC values within annotated regions. The results are shown for promoters (1 kb upstream of TSS, blue), 5′-ends of genes (1 kb downstream of TSS, green), gene bodies (red), regions around transcription end sites (±1 kb, grey), and enhancers (identified by modENCODE consortium for S2 cells, yellow). The shade of the colour within each group of regions indicates the magnitude of expression level. For overlapping regions the category was selected using the following priority rule: enhancer>promoters>5′-gene>TES-prox>gene bodies. (b) A heatmap depicting relation between MACC and chromatin markers computed genome wide and within annotated regions. The data on histone marks and DNaseI hypersensitivity (DHS) were taken from Kharchenko et al.. The data on salt fractionation of chromatin, H3.3 and nucleosome density (NucDens) were taken from Henikoff et al.. Also, the chromatin accessibility accessed using an independent method was used for comparison (MeDIP). The values appearing in the heatmap cells represent Pearson's correlation coefficients multiplied by 100. Colour scale encodes the same values, with red and blue colours standing for positive and negative correlations, respectively. (c) Profiles of MACC, histone marks, chromatin-modifying proteins and physical properties of chromatin at a ∼800-kb locus on chromosome 3R of the fly genome. The blue and magenta track at the top of the snapshot shows assignment of the 2-state Hidden Markov Model (HMM) generated using the MACC profile. The magenta and blue colours correspond to the accessible and inaccessible states, respectively. (d) Distribution of MACC states in genomic regions. Accessible and inaccessible states were identified with HMM for 300-bp bins. Stacked bars represent fractions of the bins assigned to each state in the corresponding regions, defined as in a. The numbers of bins in each state are shown above the bars.
Figure 3
Figure 3. Chromatin accessibility is modulated through DNA protection by histone and non-histone factors.
(a,b) Comparison of h-MACC (based on histone enrichment data) and c-MACC (based on whole-chromatin digestion data). (a) Scatterplot showing h- and c-MACC values in all analysed bins. Ovals indicate the sets of genomic loci characterized by either high values of c-MACC and low values of h-MACC (group 1) or by high values of both h- and c-MACC (group 2). (b) A genome browser screenshot featuring a ∼2.5 Mb region from chromosome 2 L. (c) Overlap of the MACC peaks from group 1 or group 2 (blue and orange lines respectively) with protein binding. The results for two proteins are shown as examples (see Supplementary Figs 7–9 for a more comprehensive analysis). (d) Distributions of DHS and H3 signals around the MACC peaks from groups 1 or 2. (e) Distribution of the H3 enrichment levels at the sites associated with group 1 (blue), group 2 (orange) and all genomic bins (grey). The dashed vertical line provides reference of no ‘enrichment'. (f) An example of the protein binding reflected in the MACC profiles, featuring protein binding with (blue rectangle) and without (orange rectangle) nucleosome displacement. (g) Genomic distribution of the MACC peaks from groups 1 and 2. The enrichments were computed relative to the expected values for each type of genomic regions. See Methods for region definitions. The horizontal red lines provide reference of 1 (‘no enrichment').
Figure 4
Figure 4. MACC is a better predictor of DNA accessibility than nucleosome occupancy.
(a) Examples (upper panels) and scatterplot (lower panel) showing association between MACC and ‘pooled' nucleosome occupancy. A single point on the scatterplot corresponds to one 300-bp bin (all bins for which MACC was estimated were included in this analysis). The Pearson's correlation coefficient between MACC and nucleosome occupancy is shown at the bottom. The dashed horizontal line indicates the high nucleosome occupancy cutoff (top 20% of bins), and the vertical dashed lines indicate MACC value thresholds for top and bottom 5% of bins. The numbers of genomic bins in each region are indicated on the plot. (b) Enrichment of salt-extracted chromatin fractions and H3.3 histone variant in the high occupancy bins shown in a. The 80 mM ‘active nucleosome' fraction is blue, the 150–600 mM ‘stable' or ‘repressed' fraction is orange, and the H3.3 enrichment is pink. The boxplots on the left and right sides of the figure (separated by the vertical black line) correspond to the bins with low and high MACC values respectively. Enrichment is plotted on a log2 scale and red horizontal line is placed at 0. (c) Comparison of the enrichment of two selected sets of bins in topological domains (upper panel, purple) and annotated genomic regions (lower panel, blue): TSS proximal (±1 kb), gene body, TES-proximal (±1 kb), and enhancers. For each bin set we calculated the fraction of bins overlapping a given region and the ratio of these fractions is shown on the plot.
Figure 5
Figure 5. MACC profiling in the mammalian genomes.
(a) A snapshot of digestion fragment frequency profiles obtained with four MNase concentrations. A colour scheme represents MNase concentration levels as in Fig. 1 (see legend of Fig. 1c for details). (b) Properties of chromatin around HOXD cluster in the human genome (∼540 Kb locus on chromosome 2). The grey and black track (CpGi) at the top of the plot indicates locations of CpG islands. The blue and magenta track (HMM) represents the distribution of inaccessible (blue) and accessible (magenta) states assigned by the 2-state HHM model based on the c-MACC profile (cyan). Other tracks show corresponding data as indicated on the plot. (c,d) MACC profiles ‘predict' active and silenced regions in mouse ESCs and NPCs. c-MACC (cyan) has increased levels in NPCs around genes Olig1 and Olig2, which are active in this cell type (c). An opposite pattern of c-MACC is observed around gene Smarcad1, which has higher expression in ESCs (d). c-MACC is also increased at the active enhancers characterized by the high levels of H3K27ac (pink). (e) Heatmap representing c-MACC values at ESC enhancers. c-MACC values computed for independent replicates were used for this analysis (marked with additional numbering at the samples names). Examples of the genes closest to the shown enhancers are given on the right. The analysed samples clustered according to their cell types (see dendrogram at the top).

References

    1. Kornberg R. D. Chromatin structure: a repeating unit of histones and DNA. Science 184, 868–871 (1974). - PubMed
    1. Luger K., Mader A. W., Richmond R. K., Sargent D. F. & Richmond T. J. Crystal structure of the nucleosome core particle at 2.8 Å resolution. Nature 389, 251–260 (1997). - PubMed
    1. Almer A., Rudolph H., Hinnen A. & Horz W. Removal of positioned nucleosomes from the yeast PHO5 promoter upon PHO5 induction releases additional upstream activating DNA elements. EMBO J. 5, 2689–2696 (1986). - PMC - PubMed
    1. Wolffe A. P. & Brown D. D. Developmental regulation of two 5S ribosomal RNA genes. Science 241, 1626–1632 (1988). - PubMed
    1. Li B., Carey M. & Workman J. L. The role of chromatin during transcription. Cell 128, 707–719 (2007). - PubMed

Publication types