. 2016 May 5;17(1):202.
doi: 10.1186/s12859-016-1065-y.

DrugGenEx-Net: a novel computational platform for systems pharmacology and gene expression-based drug repurposing

Affiliations

DrugGenEx-Net: a novel computational platform for systems pharmacology and gene expression-based drug repurposing

Naiem T Issa et al. BMC Bioinformatics. .

Abstract

Background: The targeting of disease-related proteins is important for drug discovery, and yet target-based discovery has not been fruitful. Contextualizing overall biological processes is critical to formulating successful drug-disease hypotheses. Network pharmacology helps to overcome target-based bottlenecks through systems biology analytics, such as protein-protein interaction (PPI) networks and pathway regulation.

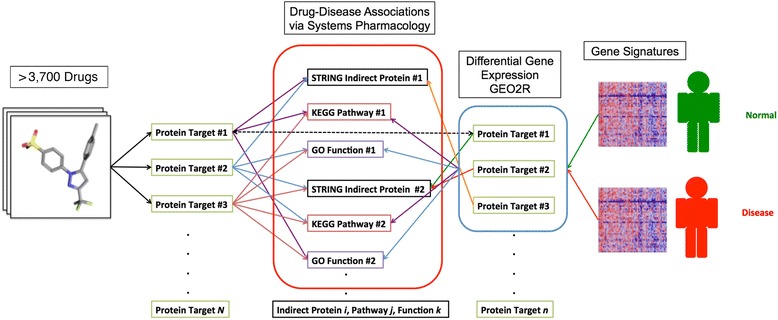
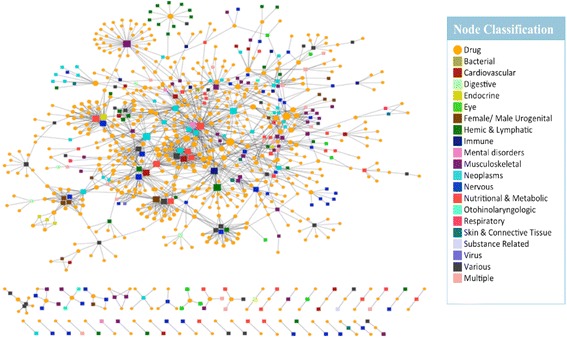
Results: We present a systems polypharmacology platform entitled DrugGenEx-Net (DGE-NET). DGE-NET predicts empirical drug-target (DT) interactions, integrates interaction pairs into a multi-tiered network analysis, and ultimately predicts disease-specific drug polypharmacology through systems-based gene expression analysis. Incorporation of established biological network annotations for protein target-disease, -signaling pathway, -molecular function, and protein-protein interactions enhances predicted DT effects on disease pathophysiology. Over 50 drug-disease and 100 drug-pathway predictions are validated. For example, the predicted systems pharmacology of the cholesterol-lowering agent ezetimibe corroborates its potential carcinogenicity. When disease-specific gene expression analysis is integrated, DGE-NET prioritizes known therapeutics/experimental drugs as well as their contra-indications. Proof-of-concept is established for immune-related rheumatoid arthritis and inflammatory bowel disease, as well as neuro-degenerative Alzheimer's and Parkinson's diseases.

Conclusions: DGE-NET is a novel computational method that predicting drug therapeutic and counter-therapeutic indications by uniquely integrating systems pharmacology with gene expression analysis. DGE-NET correctly predicts various drug-disease indications by linking the biological activity of drugs and diseases at multiple tiers of biological action, and is therefore a useful approach to identifying drug candidates for re-purposing.

Keywords: Alzheimer’s disease; DrugGenEx-NET; Gene expression analysis; Inflammatory bowel disease; Parkinson’s disease; Polypharmacology; Rheumatoid arthritis; TMFS.


Figures

Fig. 1
Fig. 1
Workflow for predicting drug-target signatures and relating network pharmacology
Fig. 2
Fig. 2
Schematic of DGE-NET used to associate drugs with diseases. Differential gene expression analysis of diseased versus non-diseased states is used to establish a disease-related gene set. DAVID and STRING analysis of this gene set provides disease-related pathways, functions, and protein-protein-interactions
Fig. 3
Fig. 3
Hypergeometric test schematic for drug-disease association at each level of biological activity. Each drug is associated with a given disease at each level of biological action by the hypergeometric test. a Given a gene, pathway, function, or indirect protein ‘universe’, the hypergeometric test allows one to determine the probability that coincident drawings between two samples drawn from that universe is due to random chance. Therefore, the statistical significance of having hits (common items) between drug-associated biological factors and disease-associated factors is derived. b Computation of hypergeometric p-values and subsequent normalization for integration into cumulative score. c Computation of drug-disease association Z-score. d Ranking scheme by drug-disease association Z-score in descending order. That is, Zi exhibits the highest system-wide statistical association (highest-magnitude Z-score), followed by Zi + 1, Zi + 2, Zi + 3, and so forth
Fig. 4
Fig. 4
Formation of drug-target (DT) disease networks. A random sample of drugs with predicted protein targets known to be associated with a disease in OMIM were selected to illustrate the process of associating drugs with diseases. a Drugs (orange circle nodes) are connected using a charcoal dashed edge to predicted protein targets (square nodes); the protein targets are connected using a solid tan edge to a disease if the protein has disease genes associated with the disease. Pink nodes represent proteins associated with multiple diseases, while green nodes represent proteins associated with a single. These interactions were used to form a drug-target disease network. b The drugs (orange circle nodes) are connected to a disease if a predicted drug-target has disease genes associated with the disease
Fig. 5
Fig. 5
Predicted drug-target (DT) disease network. The DT disease bipartite network is generated using the top 1-ranked DT predictions and disorder-disease gene associations from OMIM. Drug nodes (circles) are connected to disease nodes (squares) if a drug is predicted to target a protein that has disease genes associated with the disease. Disease nodes are colored according to their MeSH disease category; color classification given in legend. The size of node is proportional to the number of degrees (connections)
Fig. 6
Fig. 6
Predicted drug-cancer network from top-scoring DT interactions
Fig. 7
Fig. 7
Waterfall plot for the predicted number of KEGG pathways affected by each drug
Fig. 8
Fig. 8
Waterfall plot for the predicted number of GO molecular functions affected by each drug. Inset highlights four anti-neoplastic drugs predicted to disrupt the greatest number of functions from the anti-neoplastic drug class
Fig. 9
Fig. 9
Ezetimibe protein-protein interaction (PPI) network. Direct targets (green nodes) predicted for ezetimibe from TMFS were used to establish interactions between direct targets as well as indirect targets (light purple nodes) using the ExPASy STRING database with a confidence score cutoff greater than 0.95
Fig. 10
Fig. 10
Predicted sunitinib drug action network on AD. Direct protein targets predicted by DGE-NET for sunitinib that are also significantly AD-modulated are in large orange and blue circles. Blue circles are genes overexpressed in AD with statistical significance, while orange circles are protein partners of those genes. Pink circles are KEGG pathways, and purple circles are GO cellular functions, enriched at p-value < .01 in the up-regulated genes of AD. The top 10 significantly enriched cellular functions and pathways are detailed in large ovals

References

    1. Paul SM, Mytelka DS, Dunwiddie CT, Persinger CC, Munos BH, Lindborg SR, et al. How to improve R&D productivity: the pharmaceutical industry’s grand challenge. Nat Rev Drug Discov. 2010;9:203–14. - PubMed
    1. Bajorath J. Rational drug discovery revisited: interfacing experimental programs with bio- and chemo-informatics. Drug Discov Today. 2001;6:989–95. doi: 10.1016/S1359-6446(01)01961-4. - DOI - PubMed
    1. Chanda SK, Caldwell JS. Fulfilling the promise: drug discovery in the post- genomic era. Drug Discov Today. 2003;8:168–74. doi: 10.1016/S1359-6446(02)02595-3. - DOI - PubMed
    1. Pujol A, et al. Unveiling the role of network and systems biology in drug discovery. Trends Pharmacol Sci. 2010;31(3):115–123. doi: 10.1016/j.tips.2009.11.006. - DOI - PubMed
    1. Anighoro A, Bajorath J, Rastelli G. Polypharmacology: challenges and opportunities in drug discovery. J Med Chem. 2014;57:7874–7887. doi: 10.1021/jm5006463. - DOI - PubMed