. 2016 Apr 21;62(2):222-236.
doi: 10.1016/j.molcel.2016.03.010. Epub 2016 Apr 14.

PRDM16 Suppresses MLL1r Leukemia via Intrinsic Histone Methyltransferase Activity

Affiliations

PRDM16 Suppresses MLL1r Leukemia via Intrinsic Histone Methyltransferase Activity

Bo Zhou et al. Mol Cell. .

Abstract

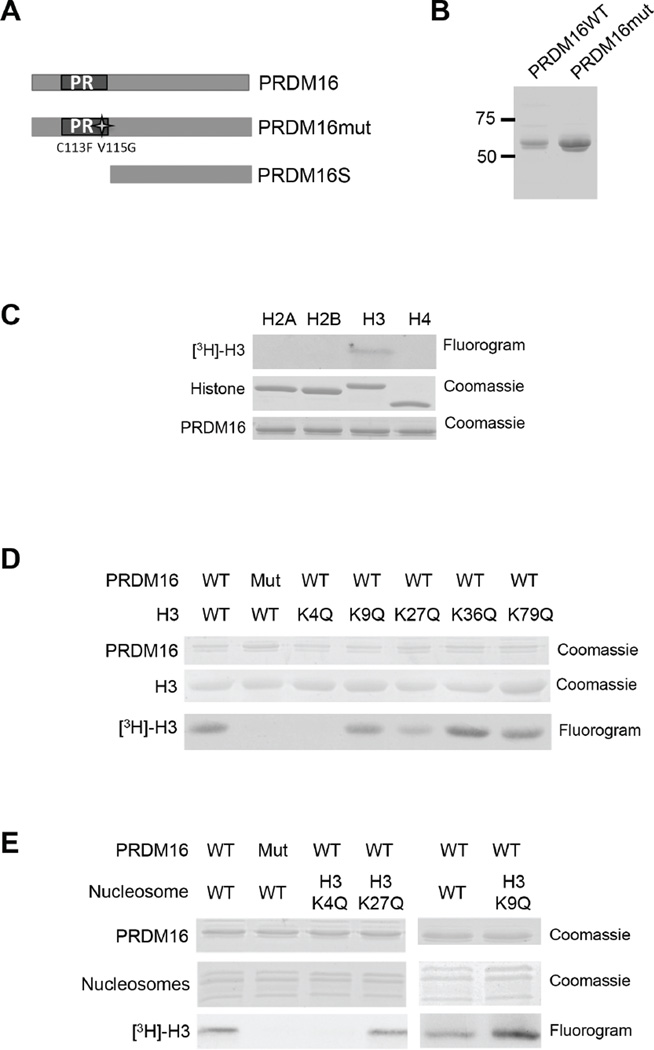
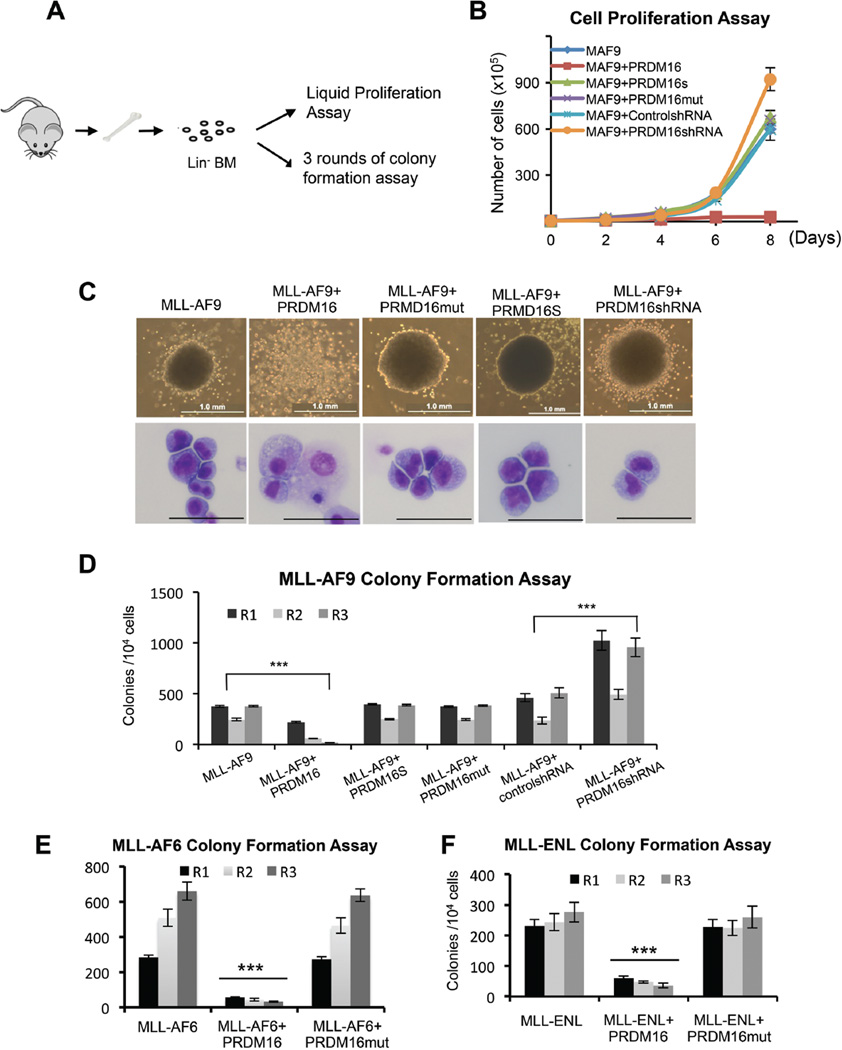
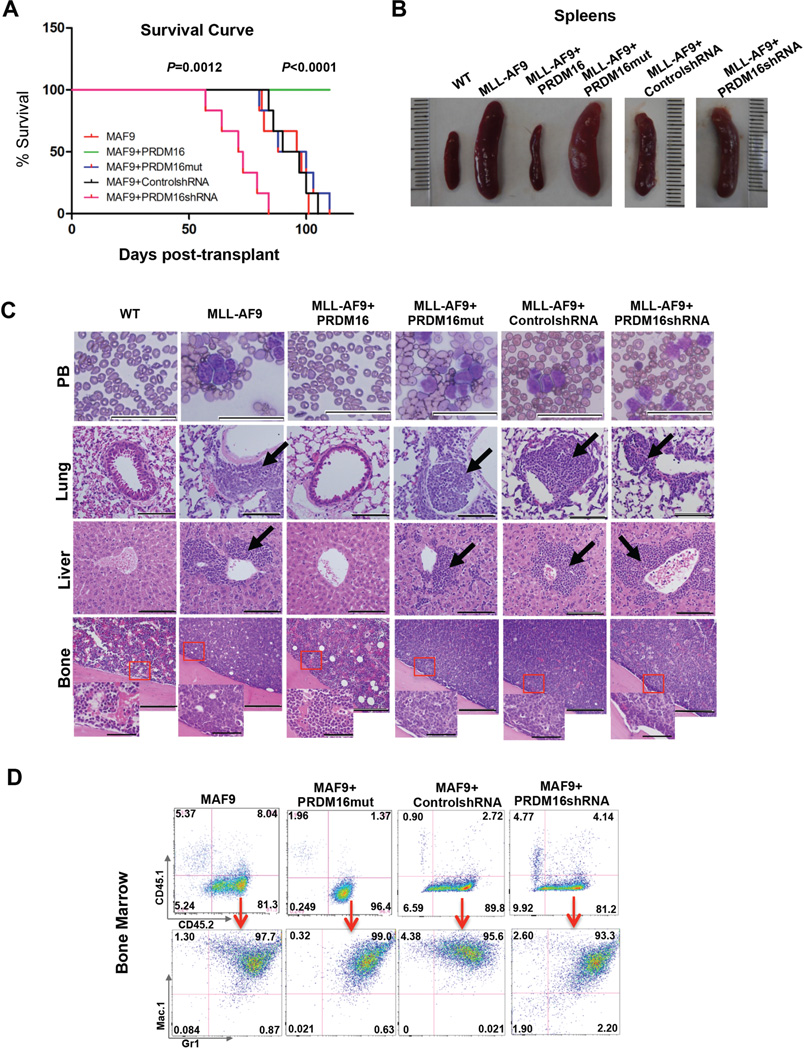
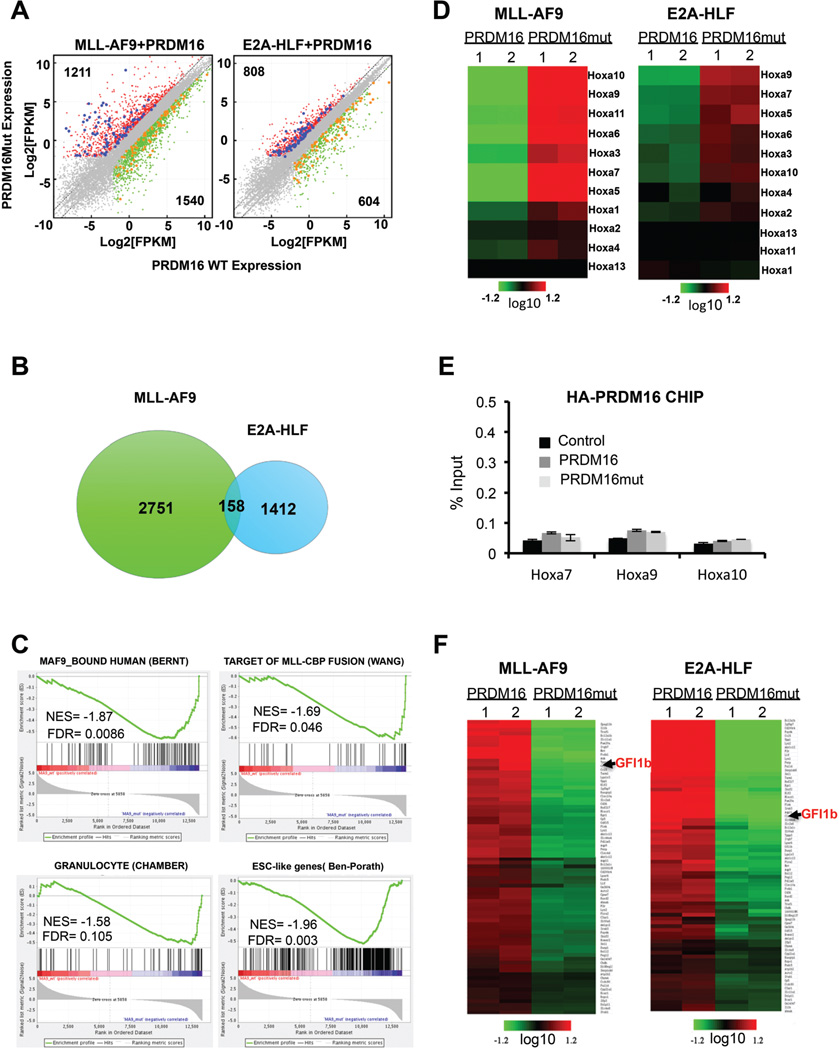
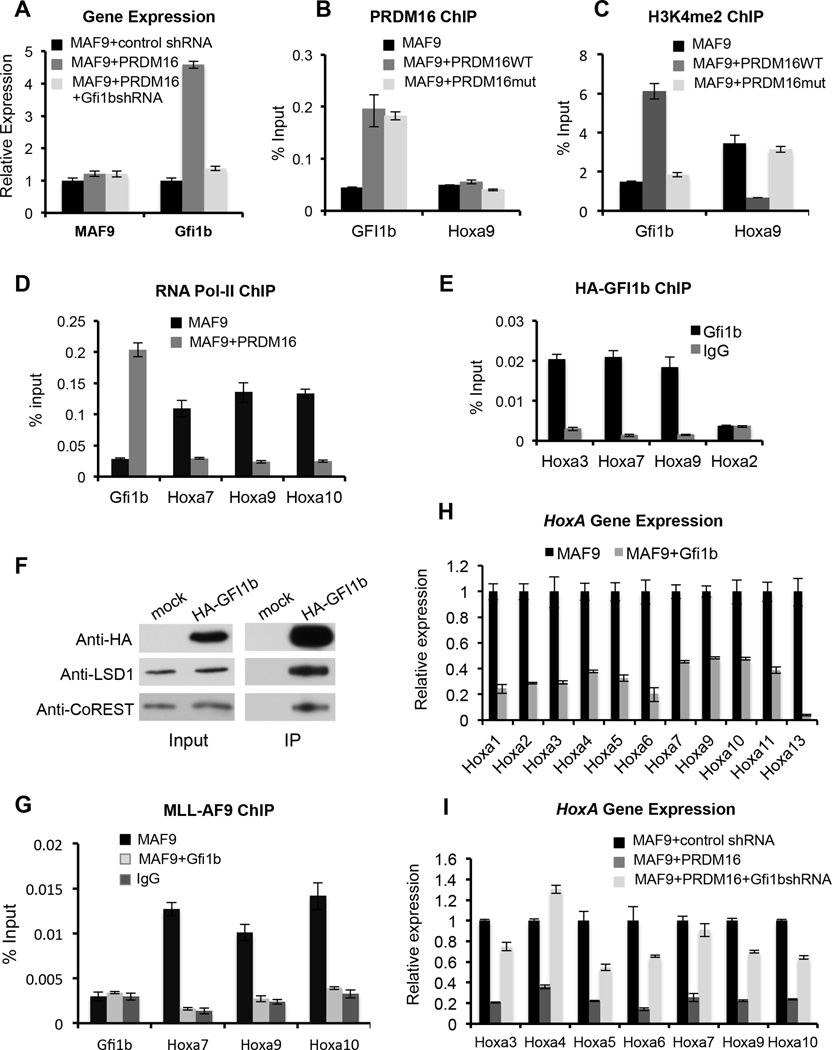
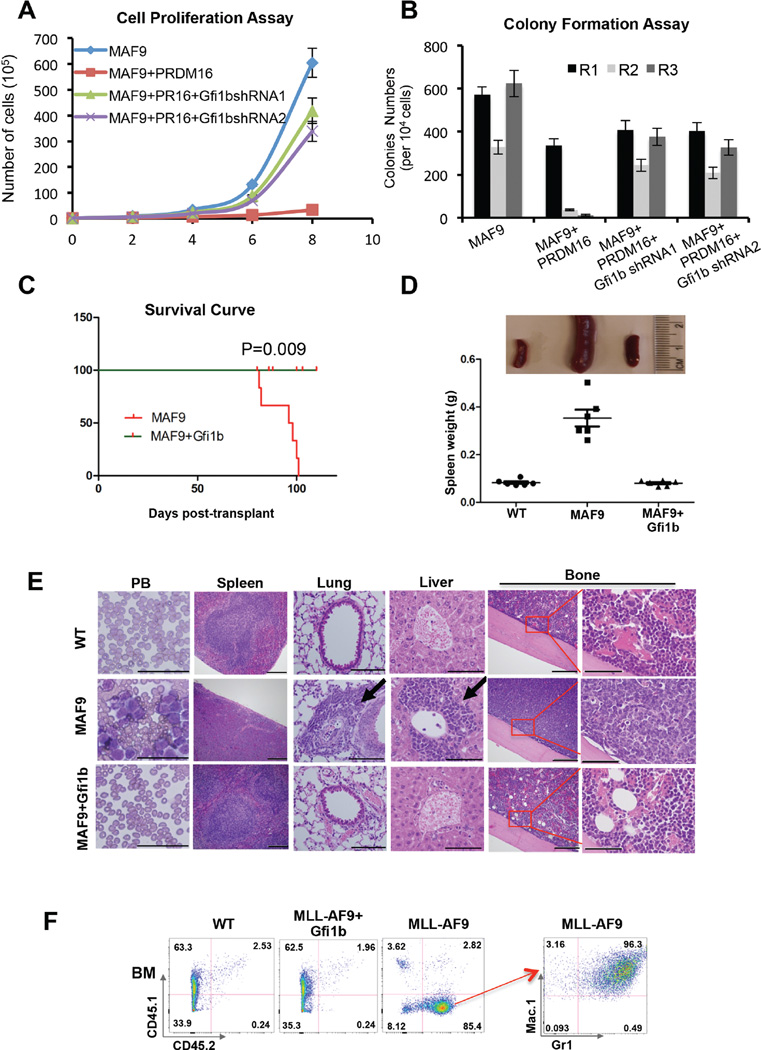
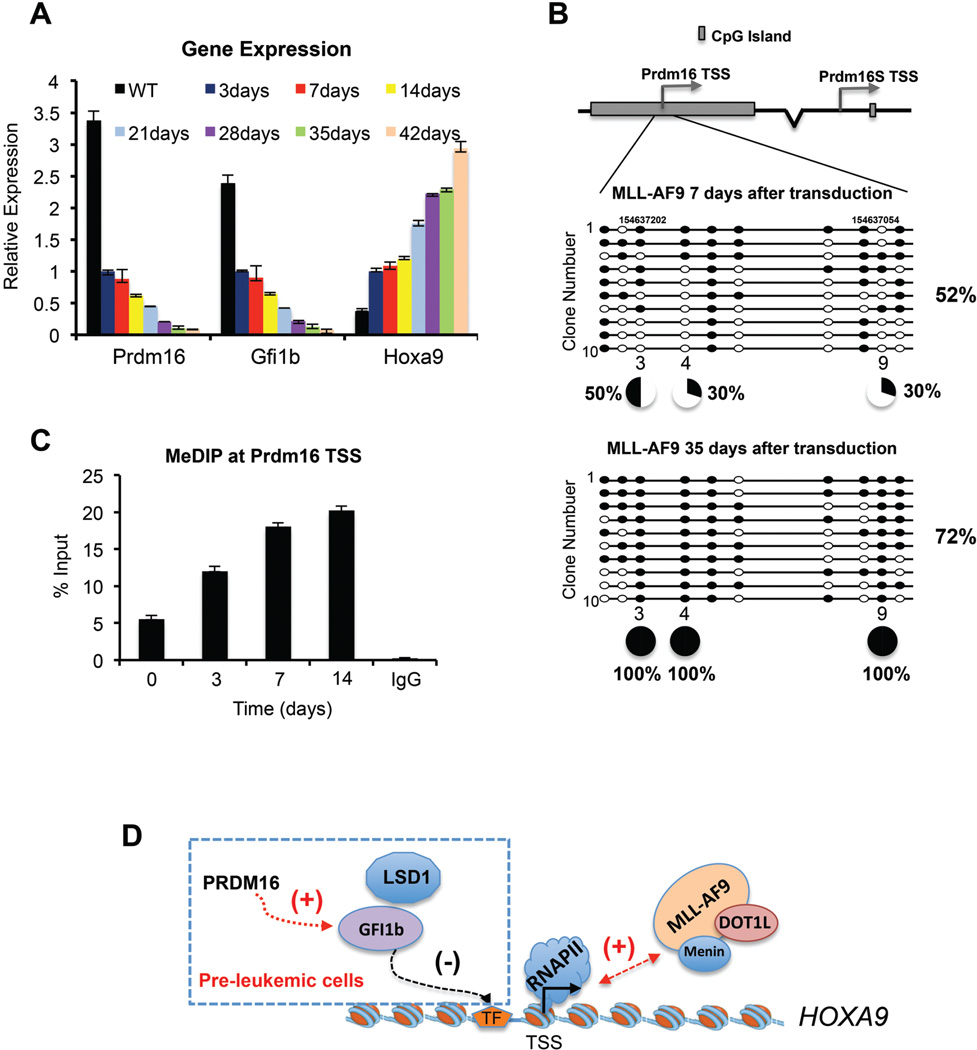
PRDM16 is a transcription co-factor that plays critical roles in development of brown adipose tissue, as well as maintenance of adult hematopoietic and neural stem cells. Here we report that PRDM16 is a histone H3K4 methyltransferase on chromatin. Mutation in the N-terminal PR domain of PRDM16 abolishes the intrinsic enzymatic activity of PRDM16. We show that the methyltransferase activity of PRDM16 is required for specific suppression of MLL fusion protein-induced leukemogenesis both in vitro and in vivo. Mechanistic studies show that PRDM16 directly activates the SNAG family transcription factor Gfi1b, which in turn downregulates the HOXA gene cluster. Knockdown Gfi1b represses PRDM16-mediated tumor suppression, while Gfi1b overexpression mimics PRDM16 overexpression. In further support of the tumor suppressor function of PRDM16, silencing PRDM16 by DNA methylation is concomitant with MLL-AF9-induced leukemic transformation. Taken together, our study reveals a previously uncharacterized function of PRDM16 that depends on its PR domain activity.


Figures

Figure 1
Figure 1. PRDM16 specifically methylates histone H3 K4 on nucleosomes
(See also Figure S1). A. Schematic representation of PRDM16, PRDM16mut and PRDM16S. The mutations in PRDM16mut are shown on bottom of the PR domain. B. Coomassie-stained SDS-PAGE gel of the His-tagged PR-domains of PRDM16 and PRDM16mut purified from insect cells. C, D, E. In vitro HMT assays using free recombinant histones (C), recombinant wild type histone H3 or H3 mutants with individual lysine to glutamine mutations (D), or recombinant nucleosomes (E) as the substrates. The fluorograms for [3H]-H3 methylation as well as coomassie gels for loading controls were included as indicated on right.
Figure 2
Figure 2. PRDM16 methyltransferase activity inhibits MLL-AF9 transformation in vitro
(See also Figure S1, S2). A. Schematic for the in vitro proliferation and colony formation experiments. B. Cell proliferation assay for MLL-AF9 (MAF9) with or without overexpression of PRDM16, PRDM16mut, PRDM16S as well as MLL-AF9 with or without PRDM16 shRNA mediated depletion. Error bars indicate standard deviation (SD) from duplicates. The results were repeated at least three times. C. Representative colonies (top) and Wright-Giemas-stained cells (bottom) from the tertiary plating were shown. Scan bar: 50µm. Genes used in co-transduction were indicated on top. D. Myeloid colony formation assay for co-transduced bone marrow cells as indicated on bottom. Colony counts were summarized from primary, secondary and tertiary plating on methycellulose medium in the presence of IL3, IL6, SCF and GM-CSF. Error bars indicate SD from duplicates. The results were repeated at least three times. (E, F). Myeloid colony formation assay for co-transduced bone marrow cells as indicated on bottom. Means and standard deviations (as error bars) were derived from at least three experiments. For (D–F), ***, p<0.0001, two-way ANOVA test.
Figure 3
Figure 3. PRDM16 represses MLL-AF9 leukemia in vivo
(See also Figure S2). A. Kaplan-Meier survival curves for recipient mice engrafted with cells as indicated (n=6). Mantel-Cox test was performed to obtain p values for overexpression (p<0.0001) and knockdown (p=0.0012) experiments, respectively. B. The representative images of the spleens from recipient mice at the end point of the study. C. Representative Wright-Giemsa staining of peripheral blood (PB) smear (Scan bar: 50µm) and H&E staining of lung (Scan bar: 100µm), liver (Scan bar: 100µm) and bone (Scan bar: 200um and 50µm) as indicated on right. Co-transduced genes were indicated on top. D. Representative flow cytometry analyses of bone marrow cells isolated for each group of recipient mice as indicated on top. Top row: antibodies against CD45.1 and CD45.2 surface markers to separate supporter cells and donor cells. Bottom row: antibodies against myeloid surface markers Mac-1 and Gr-1 to identify leukemic cell population. Percentage of cells for each immnophenotype was indicated in each quadrant.
Figure 4
Figure 4. PRDM16 regulates broad transcriptome in MLL-AF9 and E2A-HLF cells
(See also Figure S3 and Table S1–3). A. Left, scatter plot for transcripts in MLL-AF9+Prdm16mut down regulated (X-axis) and MLL-AF9+Prdm16mut up regulated (Y-axis). Right, scatter plot for transcripts in E2A-HLF+Prdm16 down regulated (X-axis) and E2A-HLF+PRDM16mut up regulated (Y-axis). Transcripts levels were presented as log2 FPKM (fragments per kilobase of transcript per Million mapped reads). Genes that have > 2 fold differences in expression as well as <=0.05 FDR corrected p-value in each cell type are represented by red and green dots for up and down regulated genes, respectively. Grey, genes with no expression change in either cell type. Blue dots, genes expressed higher in both MLL-AF9+Prdm16mut and E2A-HLF/Prdm16mut co-transduced cells. Orange dots, genes expressed higher in both MLL-AF9+Prdm16 and E2A-HLF+Prdm16 co-transduced cells. B. Venn diagram for the differentially expressed genes upon inactivation of PRDM16 in co-transduced MLL-AF9 or E2A-HLF cells. C. Gene set enrichment analysis (GSEA) on genes regulated by PRDM16 methyltransferase activity in MLL-AF9 co-transduced cells. NES: normalized enrichment score. FDR: false discovery rate. References see text. D. Heat map for Hox A genes (indicated on right) in MLL-AF9 and E2A-HLF cells as indicated on top. Color bar indicates scale of log2 fold change after centering of expression values. Duplicate RNA-seq data sets were used. E. ChIP for exogenous PRDM16 at Hox A genes (X-axis). Anti-HA antibody is used. Signals for each experiment were normalized to 1% input. Means and standard deviations (as error bars) from at least three independent experiments were presented. F. Heat map for genes that have lower expression in PRDM16mut+MLL-AF9 and PRDM16mut+E2A-HLF cells as indicated on top. Color bar indicates scale of log2 fold change after centering of expression values.
Figure 5
Figure 5. Gfi1b is the key intermediate in PRDM16 regulation of Hox A genes
(See also Figure S4, S5). A. Real-time PCR for MLL-AF9 and Gfi1b with or without PRDM16 overexpression and Gfi1b knock-down. Gene expression was normalized against GAPDH and presented as fold change against the level in MLL-AF9/control shRNA cells, which is arbitrarily set at 1. (B-E and G). ChIP experiments using antibodies as indicated on top. Signals for each experiment were normalized to 1% input. B, E, anti-HA antibody was used to detect exogenous PRDM16 or GFI1b. G, anti-Flag antibody was used to detect FLAG-MLL-AF9. F) Immunoprecipitation of exogenous HA-GFI1b using anti-HA antibody in MLL-AF9+Gfi1b cells. Antibodies were indicated on left. (H). Real-time PCR for Hox A genes in MLL-AF9 cells with or without Gfi1b overexpression. (I). Real-time PCR for Hox A genes in MLL-AF9 or MLL-AF9+PRDM16 cells treated with control or Gfi1b shRNAs as indicated. For H and I, gene expression was normalized against GAPDH and presented as fold change against the level in MLL-AF9, which is arbitrarily set at 1. For A–G and I, means and standard deviations (as error bars) from at least three independent experiments were presented.
Figure 6
Figure 6. Gfi1b overexpression inhibits MLL-AF9 leukemogenesis
(See also Figure S6). A. Liquid cell proliferation assays. Cell number (Y-axis) is counted every two days (X-axis). Error bars indicate SD from duplicates. The results were repeated at least three times. B. Myeloid colony formation assay. Colony counts from primary (R1), secondary (R2), and tertiary (R3) plating were summarized for each co-transduction as indicated on bottom. Means and SD (error bars) from duplicates were presented. The results were repeated at least three times. C. Kaplan-Meier survival curve of cohorts of recipient mice (n=6). p-value was calculated using the Mantel-Cox test. D. Top, representative image of spleens from the recipient mice. Bottom, the distribution of the spleen weight for each cohort. The MLL-AF9 cohort was the same as shown in Figure 3 since the experiments were performed at the same time. E. Wright-Giemsa staining of peripheral blood (PB) smear and histology of organs (H&E staining) of recipient mice (as indicated on top) at the end point of the study. Scan bars: 50µm for PB, 200µm for spleen, 100µm for lung and liver, 200µm and 50µm for bones. F. Representative flow cytometry analysis of BM cells in each cohort. Antibodies included CD45.1 vs. CD45.2 (left panels) and Mac-1 vs. Gr-1 (right panel) as indicated. Percentage of cell population was indicated in each quadrant.
Figure 7
Figure 7. PRDM16 is regulated by DNA methylation
(See also Figure S7). A. Real-time PCR for Prdm16, Gfi1b and Hoxa9 gene expression in pre-leukemic MLL-AF9 cells. Gene expression was normalized against GAPDH and presented as fold change against their respective levels in cells 3-day after transduction, which was arbitrarily set at 1. B. Top, schematic of CGIs at PRDM16 and PRDM16S. Bottom, bisulfite-sequencing results for 10 clones in each experimental group as indicated on top. Percentage of total methylated CpG sites was indicated on right and percentage of methylation at selected CpG sites were indicated on bottom. C. MeDIP was performed at different time after MLL-AF9 transduction as indicated on bottom. DNA corresponding to TSS of PRDM16 was amplified by real-time PCR. Signals for IP were normalized to 1% input. Means and standard deviations (as error bars) from at least three independent experiments were presented. D. Schematic for the PRDM16 mediated regulation in pre-leukemic cells. See text for detail.

References

    1. Aguilo F, Avagyan S, Labar A, Sevilla A, Lee DF, Kumar P, Lemischka IR, Zhou BY, Snoeck HW. Prdm16 is a physiologic regulator of hematopoietic stem cells. Blood. 2011;117:5057–5066. - PMC - PubMed
    1. Argiropoulos B, Humphries RK. Hox genes in hematopoiesis and leukemogenesis. Oncogene. 2007;26:6766–6776. - PubMed
    1. Artinger EL, Mishra BP, Zaffuto KM, Li BE, Chung EK, Moore AW, Chen Y, Cheng C, Ernst P. An MLL-dependent network sustains hematopoiesis. Proc Natl Acad Sci U S A. 2013;110:12000–12005. - PMC - PubMed
    1. Ayton PM, Cleary ML. Molecular mechanisms of leukemogenesis mediated by MLL fusion proteins. Oncogene. 2001;20:5695–5707. - PubMed
    1. Ben-Porath I, Thomson MW, Carey VJ, Ge R, Bell GW, Regev A, Weinberg RA. An embryonic stem cell-like gene expression signature in poorly differentiated aggressive human tumors. Nat Genet. 2008;40:499–507. - PMC - PubMed

LinkOut - more resources