. 2016 May 5;5(5):e003046.
doi: 10.1161/JAHA.115.003046.

Role of Mitochondrial Oxidative Stress in Glucose Tolerance, Insulin Resistance, and Cardiac Diastolic Dysfunction

Affiliations

Role of Mitochondrial Oxidative Stress in Glucose Tolerance, Insulin Resistance, and Cardiac Diastolic Dysfunction

Euy-Myoung Jeong et al. J Am Heart Assoc. .

Abstract

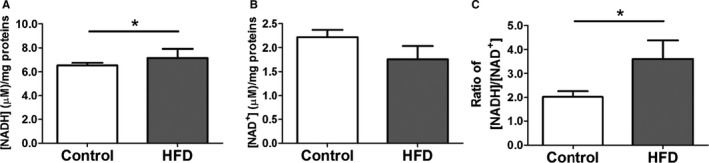
Background: Diabetes mellitus (DM) is associated with mitochondrial oxidative stress. We have shown that myocardial oxidative stress leads to diastolic dysfunction in a hypertensive mouse model. Therefore, we hypothesized that diabetes mellitus could cause diastolic dysfunction through mitochondrial oxidative stress and that a mitochondria-targeted antioxidant (MitoTEMPO) could prevent diastolic dysfunction in a diabetic mouse model.

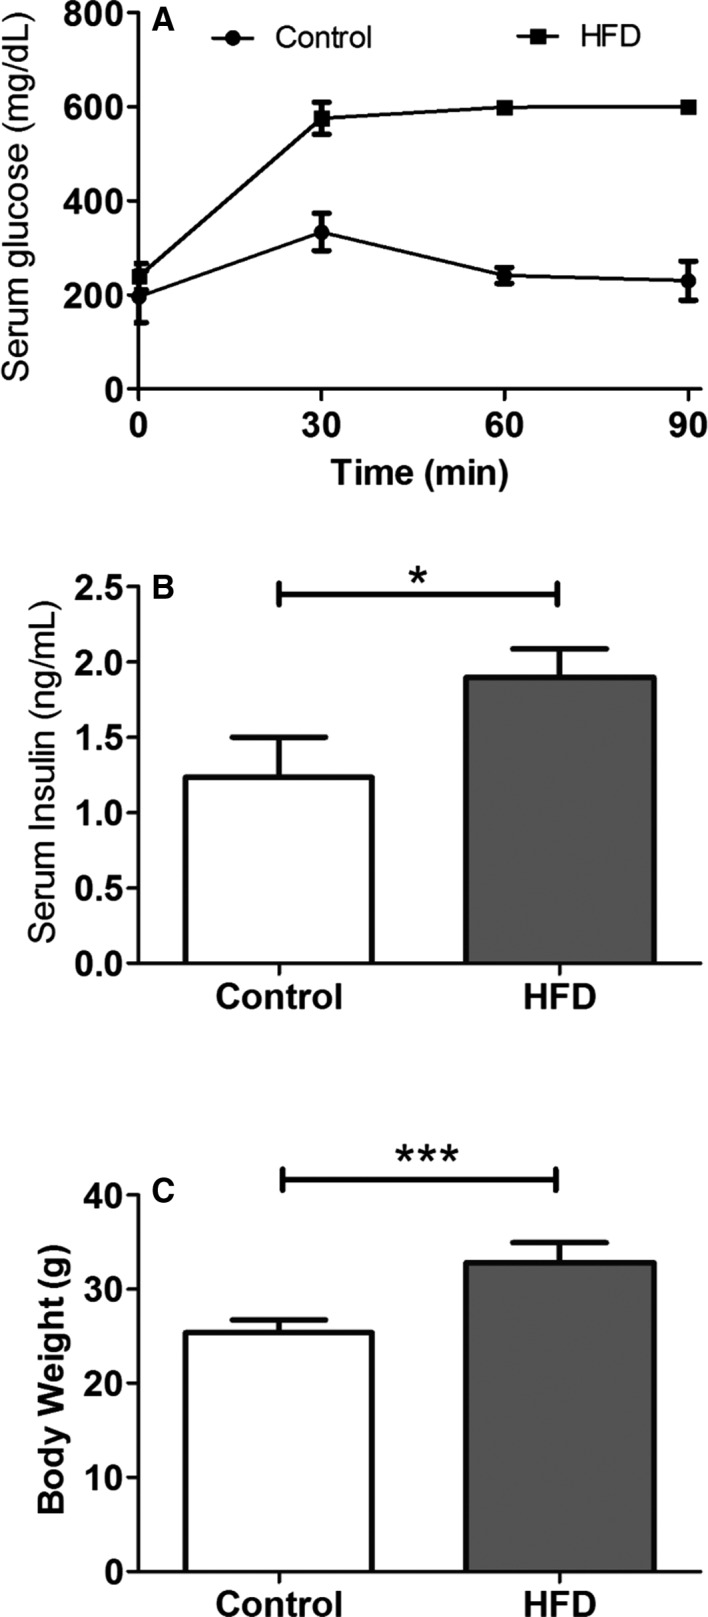
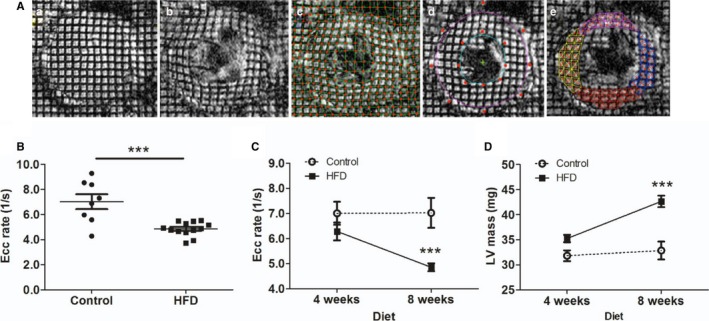
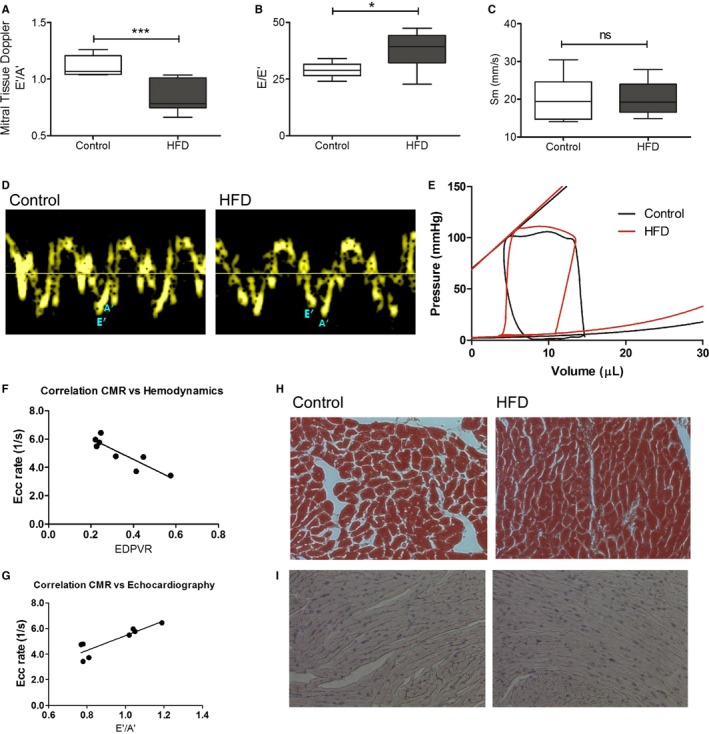
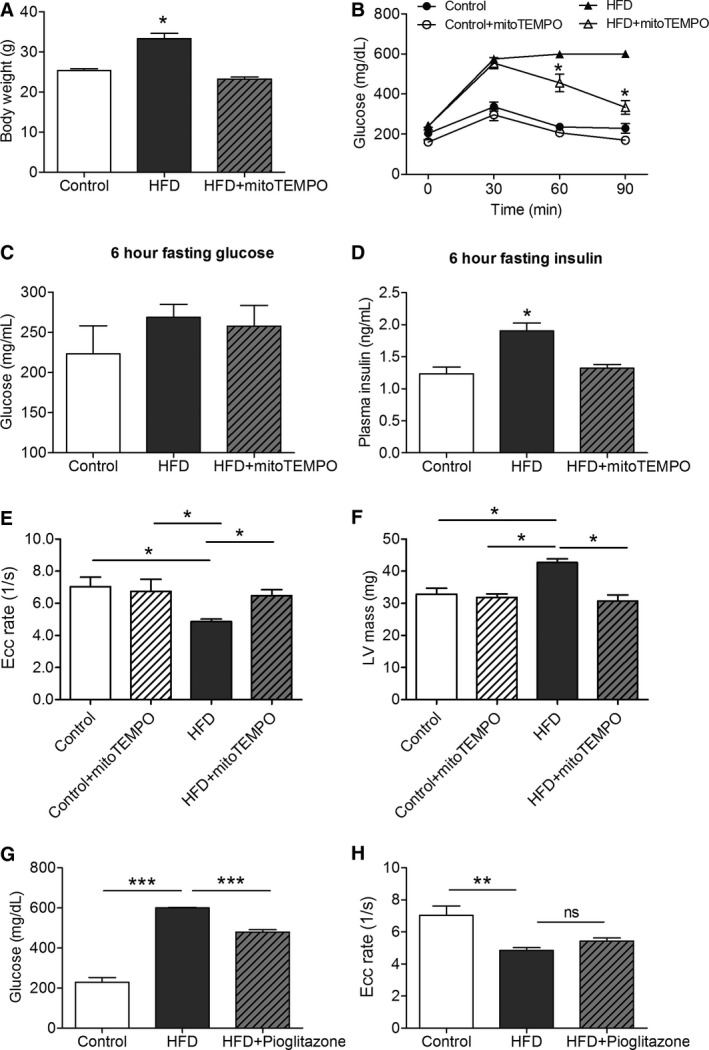
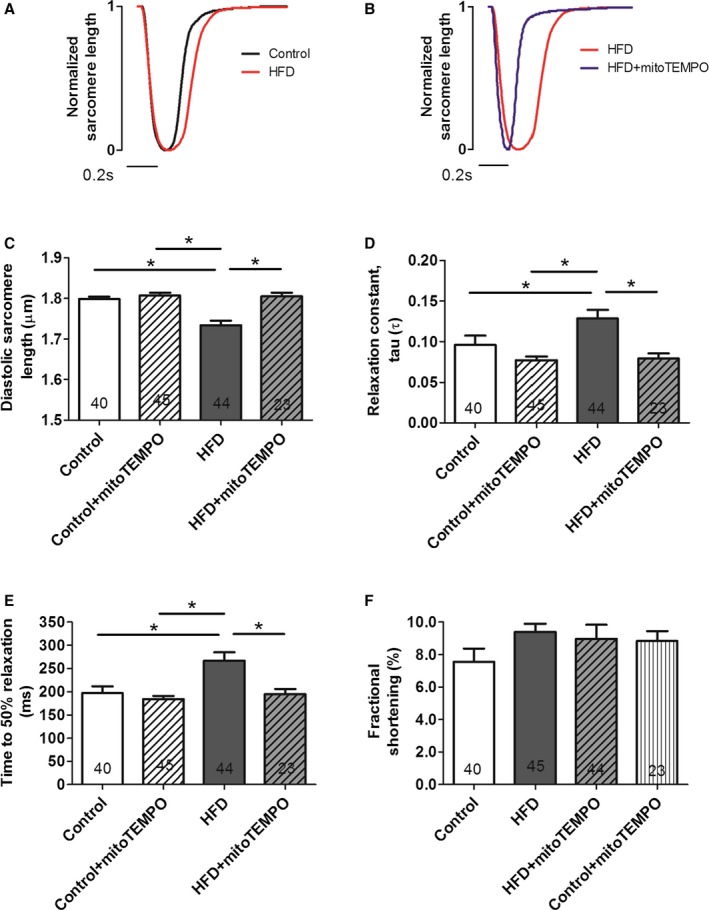
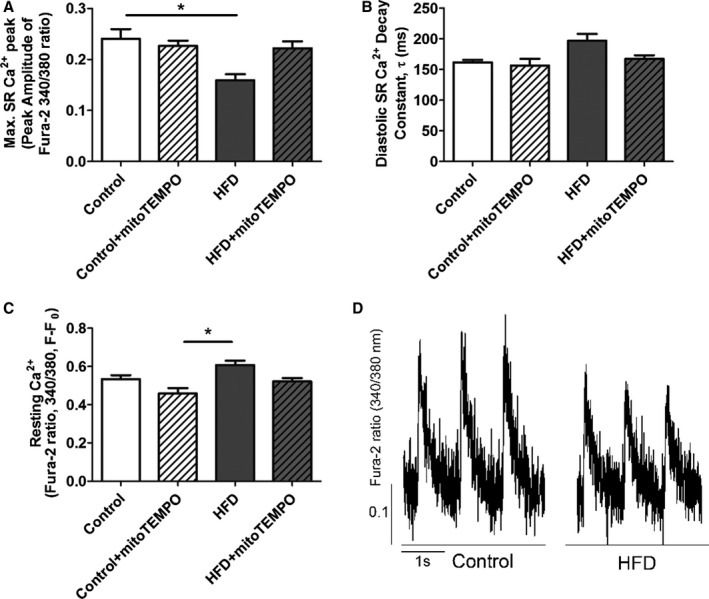
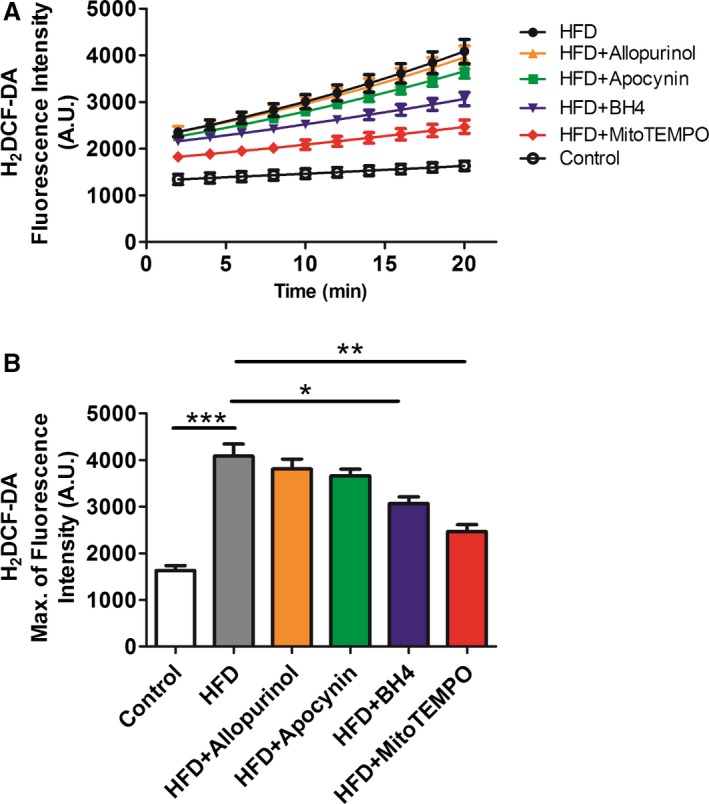
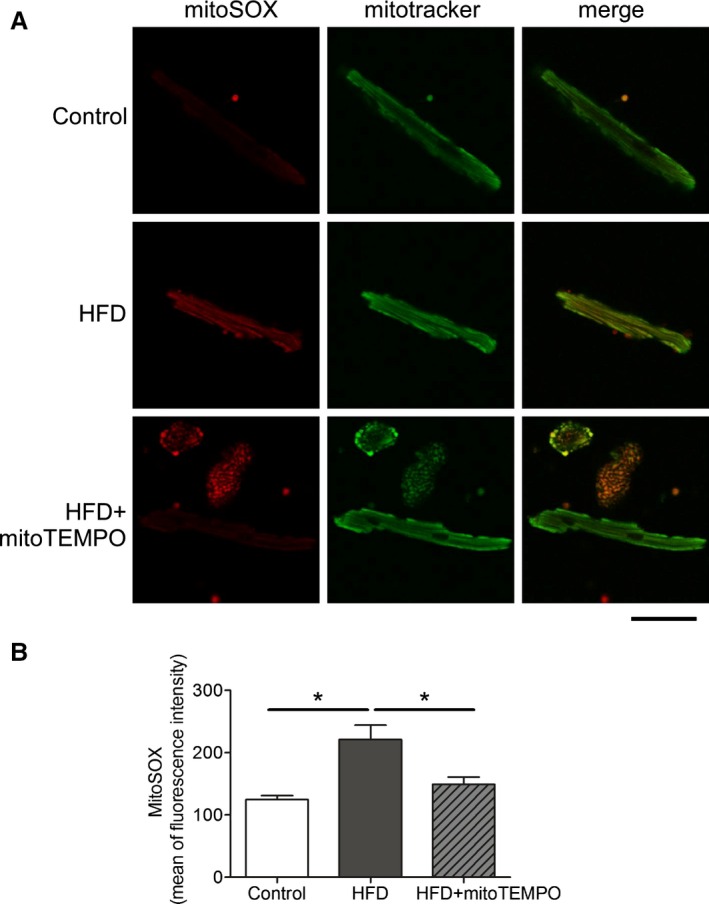
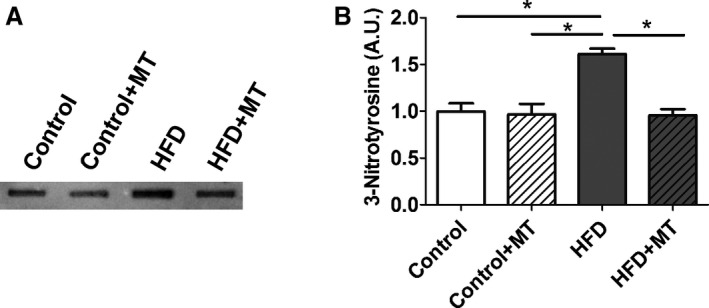
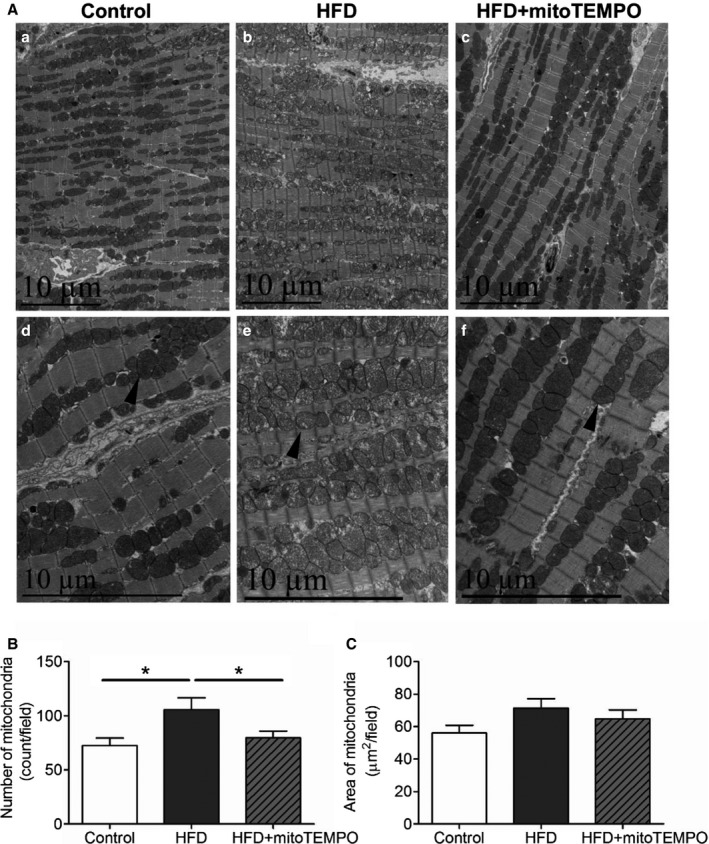
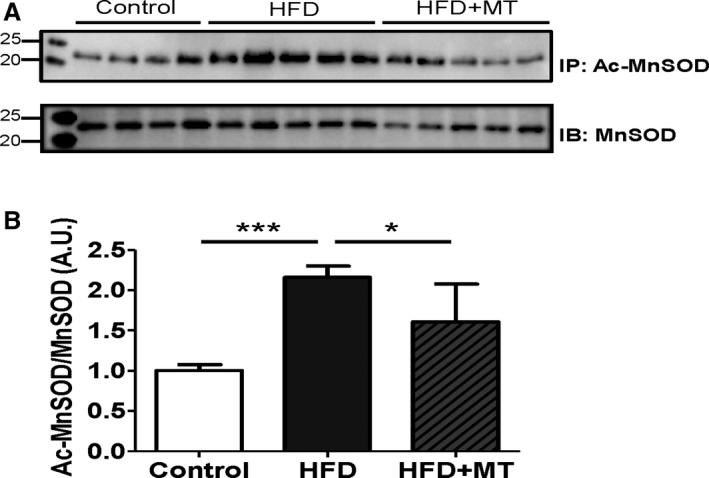
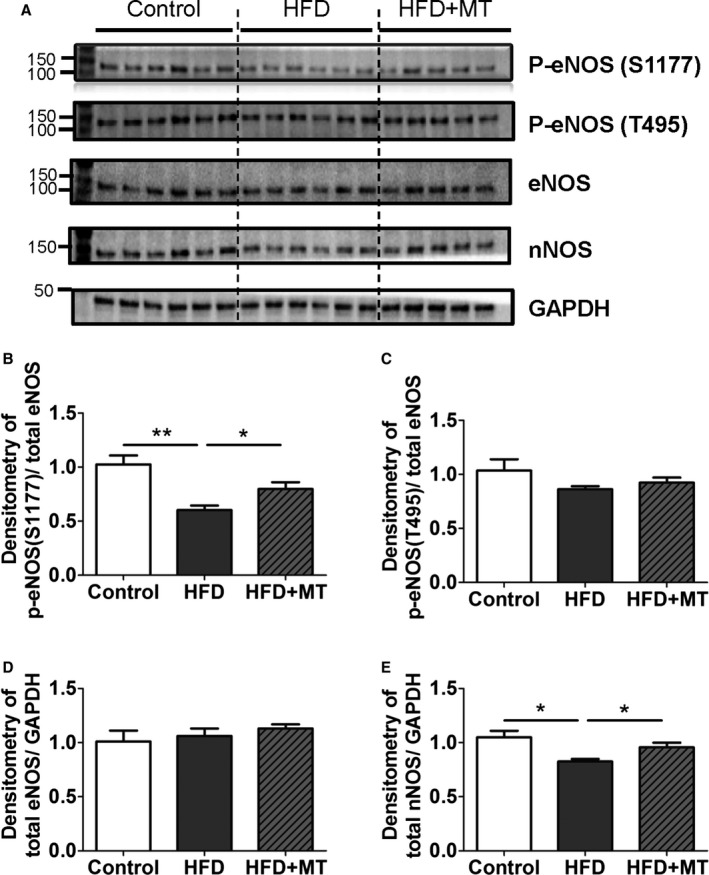
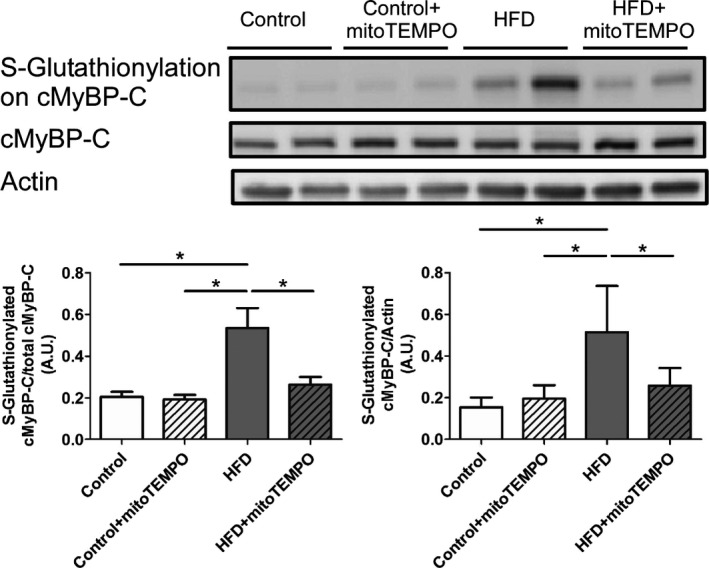
Methods and results: C57BL/6J mice were fed either 60 kcal % fat diet (high-fat diet [HFD]) or normal chow (control) for 8 weeks with or without concurrent MitoTEMPO administration, followed by in vivo assessment of diastolic function and ex vivo studies. HFD mice developed impaired glucose tolerance compared with the control (serum glucose=495±45 mg/dL versus 236±30 mg/dL at 60 minutes after intraperitoneal glucose injection, P<0.05). Myocardial tagged cardiac magnetic resonance imaging showed significantly reduced diastolic circumferential strain (Ecc) rate in the HFD mice compared with controls (5.0±0.3 1/s versus 7.4±0.5 1/s, P<0.05), indicating diastolic dysfunction in the HFD mice. Systolic function was comparable in both groups (left ventricular ejection fraction=66.4±1.4% versus 66.7±1.2%, P>0.05). MitoTEMPO-treated HFD mice showed significant reduction in mitochondria reactive oxygen species, S-glutathionylation of cardiac myosin binding protein C, and diastolic dysfunction, comparable to the control. The fasting insulin levels of MitoTEMPO-treated HFD mice were also comparable to the controls (P>0.05).

Conclusions: MitoTEMPO treatment prevented insulin resistance and diastolic dysfunction, suggesting that mitochondrial oxidative stress may be involved in the pathophysiology of both conditions.

Keywords: diastolic dysfunction; insulin resistance; mitochondrial oxidative stress.


Figures

Figure 1
Figure 1
Intraperitoneal glucose tolerance test and insulin level in HFD mice. A, Serial measurements of serum glucose level following intraperitoneal challenge of glucose at 2 g/kg of body weight. B, Random serum insulin level at 8 weeks of HFD (N=5 in control, N=7 in the HFD group). C, Body weight. (N=9 in each group; Data are mean±SD). *P<0.05, and ***P<0.001 using the Mann–Whitney test. HFD indicates high‐fat diet.
Figure 2
Figure 2
Measurement of diastolic function in HFD mice by CMR imaging. A, Myocardial tagging CMR imaging. Tagged images were obtained from end‐systole (a) to end‐diastole (b) at 5‐ms intervals. Intersections of tagging‐grid lines were traced manually (c). Endocardium and epicardium were contoured by the B‐spline method (d). Triangulation of grid lines enabled harmonic phase analyses for circumferential and radial strain calculations (e). B, Circumferential strain (Ecc) rate during the rapid filling phase in control and HFD mice (8 weeks; N=8 in control, N=13 in the HFD group). C, Longitudinal assessment of Ecc rate at 4 and 8 weeks (N=10 in control, N=13 in the HFD group). D, Longitudinal assessment of LV mass. N=10 to 13 in each group. ***P<0.001. CMR indicates cardiac magnetic resonance; Ecc, circumferential strain rate; HFD, high‐fat diet; LV, left ventricular.
Figure 3
Figure 3
Echocardiography and hemodynamics in the HFD mice. A through D, Noninvasive transthoracic echocardiography. Tissue Doppler imaging and pulse‐wave Doppler measured mitral inflow from the apical four‐chamber view. A, E′/A′ ratio. B, E/E′ ratio. C, peak systolic velocity of the myocardial segment, Sm. D, Representative tissue Doppler images in control and HFD mice. *P<0.05. ***P<0.001 using an unpaired Student t test (N=6–10). E, Invasive hemodynamic measurement of multiple loops of EDPVR (N=5 in control, N=6 in the HFD group). F, Spearman correlation of CMR imaging strain rate, Ecc rate, and hemodynamics, EDPVR (N=8). G, Spearman correlation of CMR imaging strain rate, Ecc rate, and echocardiography, E′/A′ ratio (N=8). H, Trichrome staining (N=4 each). I, Advanced glycosylation end products immunohistochemistry staining. (N=4 each). CMR indicates cardiac magnetic resonance; Ecc, circumferential strain rate; EDPVR, end‐diastolic pressure‐volume relationship; HFD, high‐fat diet; Sm, peak systolic motion of the myocardial segment; ns,not significant.
Figure 4
Figure 4
MitoTEMPO effect on insulin resistance and diastolic function. A, Body weight. B, Glucose tolerance test. C, Serum glucose after 6 hours fasting. D, Serum insulin after 6 hours fasting. E, CMR strain rate. F, LV mass measured by CMR. G, Effect of pioglitazone on serum glucose 90 min after challenge. H, Pioglitazone effect on Ecc strain rate. (N=4 in control, N=9 in the HFD and mitoTEMPO groups). *P<0.05, **P<0.01, ***P<0.001. CMR indicates cardiac magnetic resonance; Ecc, circumferential strain rate; HFD, high‐fat diet; LV, left ventricular; MitoTEMPO, 2‐(2,2,6,6‐tetramethyl‐piperidin‐1‐oxyl‐4‐ylamino)‐2‐oxoethyl‐triphenylphosphonium chloride); ns, not significant.
Figure 5
Figure 5
MitoTEMPO effects on relaxation in isolated cardiomyocytes. A and B, Representative normalized sarcomere contraction and relaxation traces in control (black) vs HFD mice (red) (A); HFD mice vs mitoTEMPO‐treated mice (blue) (B). Bar represents 0.2 seconds. C, Basal diastolic sarcomere length. D, Relaxation constant, τ. E, time to 50% relaxation. F, Fractional shortening. N=4 mice in control, N=6 mice in the HFD and mitoTEMPO groups. Five to 10 myocytes were studied from each mouse. Total cardiomyocytes are indicated in each bar graph. *P<0.05. HFD indicates high‐fat diet; MitoTEMPO, 2‐(2,2,6,6‐tetramethyl‐piperidin‐1‐oxyl‐4‐ylamino)‐2‐oxoethyl‐triphenylphosphonium chloride).
Figure 6
Figure 6
Ca2+ transient data from isolated cardiomyocytes. A, Amplitude of the Ca2+ transient. B, Diastolic Ca2+ decay constant τ (ms). C, Resting Ca2+ (F/F0) in each group. D, Representative Ca2+ transients from HFD and control myocytes. Isolated cardiomyocytes were loaded with Fura‐2AM and paced at 1.0 Hz. *P<0.05. N=18 to 21 cells in each group. N=4 mice in each group. HFD indicates high‐fat diet; SR, sarcoplasmic reticulum.
Figure 7
Figure 7
Cytoplasmic ROS measured by H2 DCFDA. A and B, Isolated cardiomyocytes from HFD and matched controls with or without in vivo treatment with mitoTEMPO, BH 4, apocynin, or allopurinol to inhibit mitochondrial, uncoupled nitric oxide synthase, NADPH oxidase, or xanthine oxidase‐dependent ROS. Data were represent as mean±SEM. *P<0.05,**P<0.01, ***P<0.001. N=5 for each treatment. DCFDA indicates 2',7'‐dichlorofluorescin diacetate; HFD, high‐fat diet; ROS, reactive oxygen species; MitoTEMPO, 2‐(2,2,6,6‐tetramethyl‐piperidin‐1‐oxyl‐4‐ylamino)‐2‐oxoethyl‐triphenylphosphonium chloride).
Figure 8
Figure 8
Mitochondrial ROS scavenged by mitoTEMPO. A, Confocal microscopy showing mitochondrial ROS. MitoSOX was used to probe for mitochondrial superoxide, and MitoTracker green was used to identify mitochondria. Bar represents 20 μm. B, Flow cytometry with mitoSOX staining. Mean of fluorescence intensity was recorded on the red channel. N=3 in control, N=4 in HFD and mitoTEMPO groups. *P<0.05. HFD indicates high‐fat diet; MitoTEMPO, 2‐(2,2,6,6‐tetramethyl‐piperidin‐1‐oxyl‐4‐ylamino)‐2‐oxoethyl‐triphenylphosphonium chloride); ROS, reactive oxygen species.
Figure 9
Figure 9
[NADH] and [NAD +] levels in HFD hearts. A, [NADH] level. B, [NAD +] level. C, ratio of [NADH]/[NAD +]. Data represent mean±SEM. *P<0.05. N=8 in each group. HFD indicates high‐fat diet.
Figure 10
Figure 10
3‐Nitrotyrosine (3‐NT) level in HFD heart. A, Slot blots were performed using a 3‐ NT antibody. B, Representative densitometry analysis. Data represent mean±SEM. *P<0.05. N=6 in each group. HFD indicates high‐fat diet; MT, mitoTEMPO.
Figure 11
Figure 11
Electron microscopy of mitochondrial morphology with HFD. A, Transmission electron micrographs of hearts from control, HFD mice, and HFD mice treated with mitoTEMPO. a and d, control; b and e, HFD; c and f, mitoTEMPO‐treated HFD mice. a, b, and c, ×5780. d, e, and f, ×11 600 magnification. Arrowhead indicates typical mitochondria in each group. Bar indicates 10 μm. B, Averaged numbers of mitochondria in each field. C, Quantification of total mitochondrial areas in each field. N=3 to 5 in each group. *P<0.05. HFD indicates high‐fat diet; MitoTEMPO, 2‐(2,2,6,6‐tetramethyl‐piperidin‐1‐oxyl‐4‐ylamino)‐2‐oxoethyl‐triphenylphosphonium chloride).
Figure 12
Figure 12
MnSOD and its acetylation in HFD heart. A, Immunoprecipitation (IP) was performed using a MnSOD antibody, and then immunoblotted (IB) with an acetylated‐lysine antibody. Acetylation of MnSOD was normalized by the total expression level of MnSOD. B, Densitometry was normalized by MnSOD. Data represent mean±SEM. *P<0.05, ***P<0.001. N=4 to 5. Ac‐MnSOD indicates acetylated manganese superoxide dismutase; HFD, high‐fat diet; MT, mitoTEMPO.
Figure 13
Figure 13
Changes in nitric oxide synthases (NOSs) with HFD. A, Immunoblot images shown as phospho‐eNOS (Ser1177), phospho‐eNOS (Thr495), total eNOS, total nNOS, and GAPDH. B and C, Densitometry data of stimulatory phospho‐eNOS (Ser1177) (B) and inhibitory phospho‐eNOS (Thr495) (C) were normalized by total eNOS, (D and E). Densitometry data of total eNOS (D) and total nNOS were normalized by GAPDH. Data represent mean±SEM. *P<0.05, **P<0.01. N=5 to 6. HFD indicates high‐fat diet; MT, mitoTEMPO.
Figure 14
Figure 14
NO donor effect on diastolic impairment in HFD cardiomyocytes. Single isolated cardiomyocytes were treated with SNAP, an NO donor (1 mmol/L). A and B, Sarcomere length before and after treatment with SNAP are shown in (A) and averaged in (B). C, Resting sarcomere length; (D) 50% of diastolic relaxation time; and (E) fractional shortening as a function of SNAP. Data represent mean±SEM. *P<0.05, **P<0.01. N=8. HFD indicates high‐fat diet; SNAP, S‐Nitroso‐N‐Acetyl‐D,L‐Penicillamine.
Figure 15
Figure 15
Immunoblotting for S‐glutathionylated cMyBP‐C. S‐Glutathionylation of cMyBP‐C in control, HFD, and HFD mice treated with mitoTEMPO. N=4 to 7 in each group. *P<0.05. cMyBP‐C indicates cardiac myosin binding protein‐C; HFD, high‐fat diet; MitoTEMPO, 2‐(2,2,6,6‐tetramethyl‐piperidin‐1‐oxyl‐4‐ylamino)‐2‐oxoethyl‐triphenylphosphonium chloride).

References

    1. Schocken DD, Benjamin EJ, Fonarow GC, Krumholz HM, Levy D, Mensah GA, Narula J, Shor ES, Young JB, Hong Y. Prevention of heart failure: a scientific statement from the American Heart Association Councils on Epidemiology and Prevention, Clinical Cardiology, Cardiovascular Nursing, and High Blood Pressure Research; Quality of Care and Outcomes Research Interdisciplinary Working Group; and Functional Genomics and Translational Biology Interdisciplinary Working Group. Circulation. 2008;117:2544–2565. - PubMed
    1. Owan TE, Hodge DO, Herges RM, Jacobsen SJ, Roger VL, Redfield MM. Trends in prevalence and outcome of heart failure with preserved ejection fraction. N Engl J Med. 2006;355:251–259. - PubMed
    1. Redfield MM, Jacobsen SJ, Burnett JC Jr, Mahoney DW, Bailey KR, Rodeheffer RJ. Burden of systolic and diastolic ventricular dysfunction in the community: appreciating the scope of the heart failure epidemic. JAMA. 2003;289:194–202. - PubMed
    1. Patil VC, Patil HV, Shah KB, Vasani JD, Shetty P. Diastolic dysfunction in asymptomatic type 2 diabetes mellitus with normal systolic function. J Cardiovasc Dis Res. 2011;2:213–222. - PMC - PubMed
    1. Silberman GA, Fan TH, Liu H, Jiao Z, Xiao HD, Lovelock JD, Boulden BM, Widder J, Fredd S, Bernstein KE, Wolska BM, Dikalov S, Harrison DG, Dudley SC Jr. Uncoupled cardiac nitric oxide synthase mediates diastolic dysfunction. Circulation. 2010;121:519–528. - PMC - PubMed

Publication types

MeSH terms