. 2016 Apr 13:S0960-9822(16)30179-8 10.1016/j.cub.2016.02.068.
doi: 10.1016/j.cub.2016.02.068. Online ahead of print.

A Mutation Associated with Stuttering Alters Mouse Pup Ultrasonic Vocalizations

Affiliations

A Mutation Associated with Stuttering Alters Mouse Pup Ultrasonic Vocalizations

Terra D Barnes et al. Curr Biol. .

Abstract

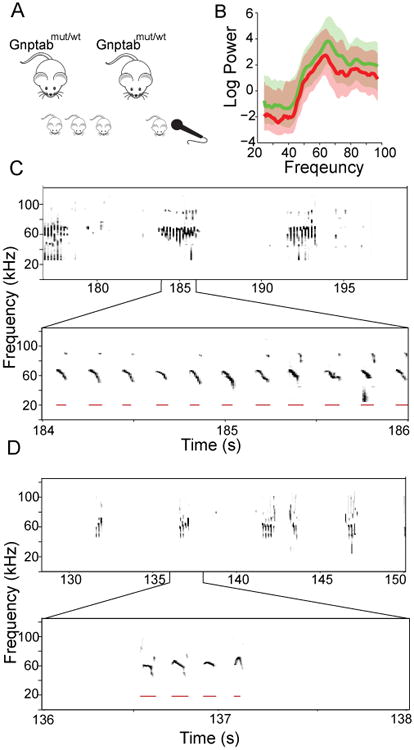
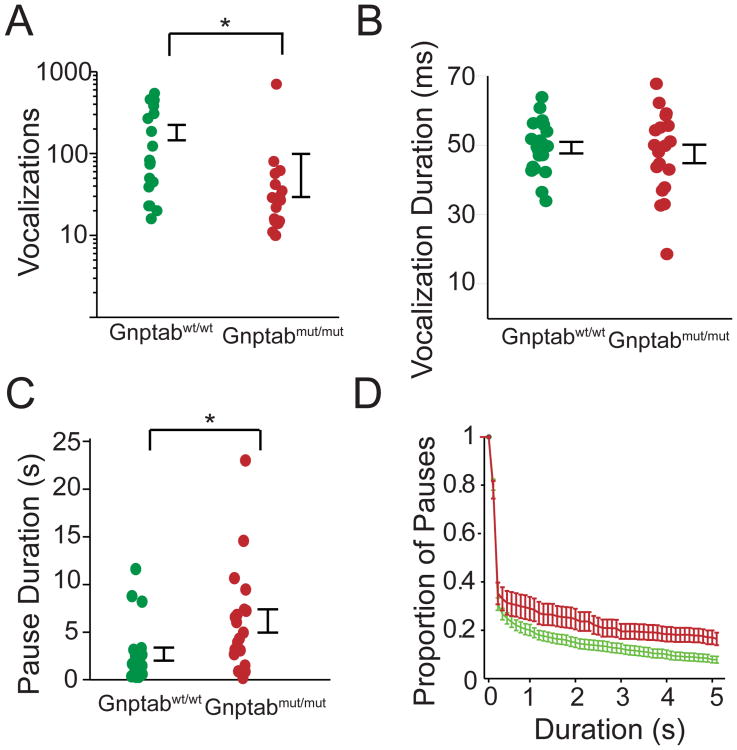
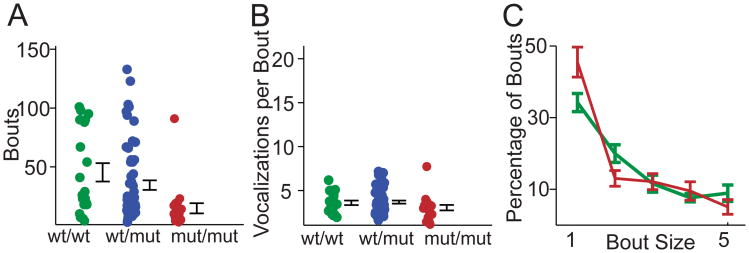
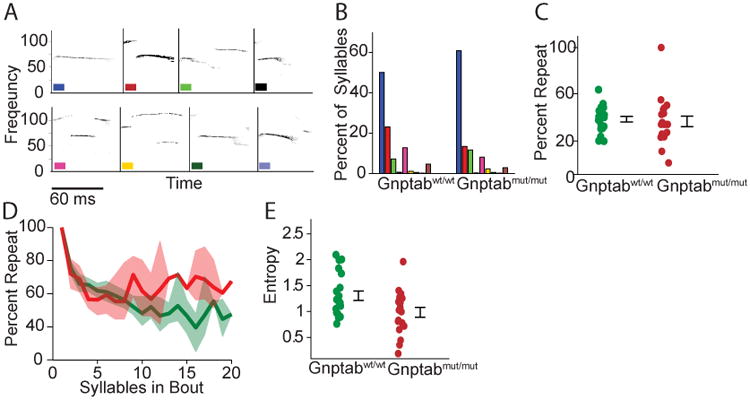
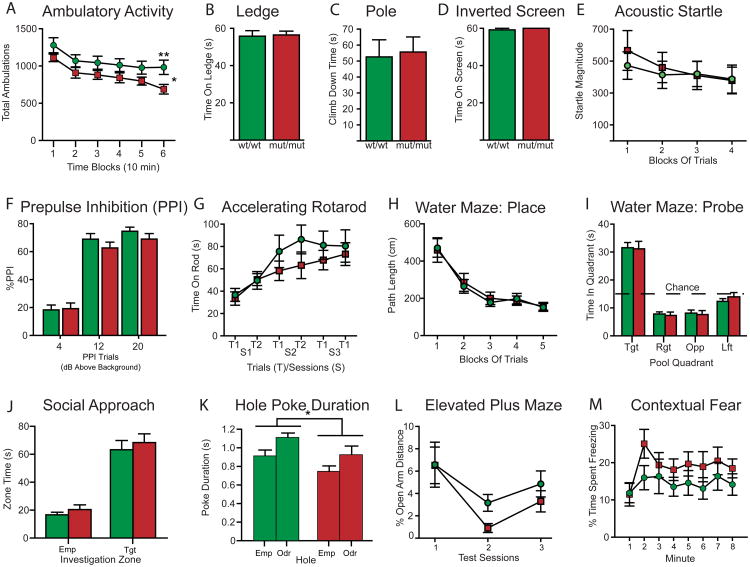
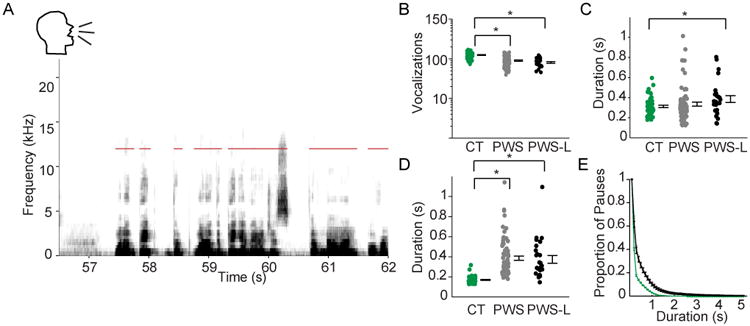
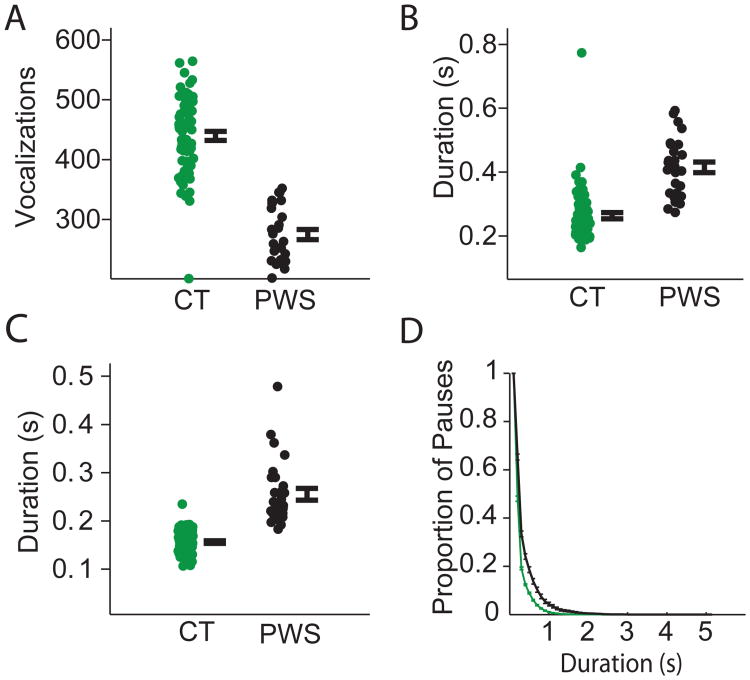
A promising approach to understanding the mechanistic basis of speech is to study disorders that affect speech without compromising other cognitive or motor functions. Stuttering, also known as stammering, has been linked to mutations in the lysosomal enzyme-targeting pathway, but how this remarkably specific speech deficit arises from mutations in a family of general "cellular housekeeping" genes is unknown. To address this question, we asked whether a missense mutation associated with human stuttering causes vocal or other abnormalities in mice. We compared vocalizations from mice engineered to carry a mutation in the Gnptab (N-acetylglucosamine-1-phosphotransferase subunits alpha/beta) gene with wild-type littermates. We found significant differences in the vocalizations of pups with the human Gnptab stuttering mutation compared to littermate controls. Specifically, we found that mice with the mutation emitted fewer vocalizations per unit time and had longer pauses between vocalizations and that the entropy of the temporal sequence was significantly reduced. Furthermore, Gnptab missense mice were similar to wild-type mice on an extensive battery of non-vocal behaviors. We then used the same language-agnostic metrics for auditory signal analysis of human speech. We analyzed speech from people who stutter with mutations in this pathway and compared it to control speech and found abnormalities similar to those found in the mouse vocalizations. These data show that mutations in the lysosomal enzyme-targeting pathway produce highly specific effects in mouse pup vocalizations and establish the mouse as an attractive model for studying this disorder.


Figures

Figure 1
Figure 1. Experimental scheme
(A) Knock-in mice with a Glu1179Lys mutation in exon 19 of the Gnptab gene were constructed on a BALB/c background. Recordings were performed on mice pups separated from dam for recording on postnatal day 3, 5 and 8. (B) Frequency distribution of mouse pup vocalizations on day 8 in wild type littermates from the Gnptab wt/wt mice (green, n=20) and Gnptab mut/mut mice (red, n=19) (C) Sonogram of a wild type mouse pup vocalizing in isolation. Lower window is an expanded version of one portion, showing the repeated structure in the mouse vocalizations. Red bars indicate a detected vocalization. (D) Sonogram of a Gnptab mut/mut as in c. See also Figure S1.
Figure 2
Figure 2. Differences in the vocalizations of mice with a mutation in the LETP compared to wild type littermates
(A) Vocalizations per recording in mouse pup vocalizations in wild type littermates (Gnptab wt/wt, green, n=20), and mice homozygous for the Glu1179Lys mutation (Gnptab mut/mut, red, n=19). Note the significant decrease in the Gnptab mut/mut mice compared Gnptab wt/wt littermates (t-test, p < 0.034). (B) Duration of vocalization in Gnptab wt/wt and Gnptab mut/mut mice. No significant difference was found. (C) Pause duration between vocalizations, with a significant increase in the duration of pauses in the Gnptab wt/wt compared to the Gnptab mut/mut mice (t-test p<0.020). (D) Proportion of long pauses with a steadily increasing criterion for criterion for ‘long pauses’. Gnptab mut/mut mice had significantly more long pauses. Each dot represents the mean of one subject. Error bars represent standard error of the mean across individuals. Color scheme as in panels A-C. See also Figure S2 and S3.
Figure 3
Figure 3. Number of bouts in Gnptab wt/mut mice vocalizations compared to Gnptab mut/mut and Gnptab wt/wt mice across days
(A) Number of bouts per recording in mouse pup vocalizations in wild type littermates (Gnptab wt/wt, green), (Gnptab wt/mut, blue) and mice homozygous for the Glu1179Lys mutation (Gnptab mut/mut, red). Note there was a significant difference between Gnptab wt/wt and Gnptab mut/mut mice (t-test p < .0023). Error bars represent standard error of the mean across individuals. (B) No significant difference was found in the number of vocalizations per bout. (C) Percentage of bouts containing 1 (Gnptab mut/mut, red, 45.5% ± .04%, Gnptab wt/wt, green, 34.2% ± .03%, p < .029), 2 (Gnptab mut/mut 13.0 % ± .02% Gnptab wt/wt 20.0% ± .03, p<.05), 3, 4 or 5 vocalizations.
Figure 4
Figure 4. Mouse vocalizations from Gnptab wt/wt compared to vocalizations of Gnptab mut/mut
(A) Syllable identification scheme showing examples of each type of syllable. (B) Percentage of each type of syllable in wild type and knock-in mice. Differences were not statistically significant. Each color represents one syllable type. (C) Percentage of times that one syllable type was followed by the same syllable type. Differences were not statistically significant. (D) Percentage of syllables that were of the same type as the mode of each bout, for bout sizes ranging from 1 to 20. Data from Gnptab wt/wt and Gnptab mut/mut . Shaded areas represent 95% confidence intervals. (E) Diversity of vocalization sequences as quantified by the entropy of the corresponding first order Markov process (t-test, p<0.022). See also Figure S4 and S5.
Figure 5
Figure 5. Non-vocal behavioral test results from Gnptab wt/wt and Gnptab mut/mut mice
(A) Ambulatory activity was significantly decreased (*p<0.05) in mice homozygous for the Glu1179Lys mutation (Gnptab mut/mut, red, n=15) compared to wild type (Gnptab wt/wt, green, n=15) mice with differences being greatest during block 6 (**p=0.017). (B-D) The two groups of mice did not differ on several sensorimotor tests such as the time spent on an elevated ledge (B), the time to climb down a pole (C), or the time spent hanging upside down on an inverted screen before falling (D). (E-F) The Gnptab wt/wt and Gnptab mut/mut mice also exhibited similar magnitudes of the acoustic startle response (arbitrary units) (E) and PPI (F). (G) Time spent on accelerating rotorod before falling. No significant differences were found. (H) Path length on Morris Water maze for place trials. (I-J) The performance of the Gnptab mut/mut mice was not impaired during the spatial learning (place) trials (I) nor in terms of retention performance during a probe trial where each group showed spatial bias for the target quadrant by spending significantly more time in it versus the times spent in each of the other quadrants (p<0.00005). (J) The Gnptab wt/wt and Gnptab mut/mut mice showed comparable levels of sociability in that each group spent significantly more time in an investigation zone surrounding a stimulus mouse that remained inside a withholding cage compared to levels exhibited toward an empty cage (p<0.00005), although there were no differences between the two groups for either of the two conditions. (K) For each group, the duration of hole pokes was significantly greater for the odorant-containing versus the empty holes (p<0.024), although the Gnptab wt/wt mice had significantly higher poke durations on average across the two hole types (*p=0.028). (L) The two groups did not differ in levels of anxiety-related behaviors in the elevated plus maze as exemplified by the lack of significant effects involving genotype on the percentage of distance traveled in the open arms out of the total distances traveled in all of the arms. (M) The absence of any significant effects involving genotype suggested that there were no differences in contextual fear conditioning between the groups.
Figure 6
Figure 6. Vocalizations of human controls, PWS, and PWS with a known mutation in the LETP, as measured by a language agnostic analysis
(A) Sonogram of a person saying, “(Breath) One of big…the…one of the big advantages of nylon over” while reading from a standard diagnostic script. Red bars indicate detected vocalization intervals. (B) Vocalizations per minute in the control subjects reading the script (CT; green, n=51), PWS (PWS; gray, n=74), and PWS with a known mutation in the LETP reading the same script (PWS-L; black, n=26). Each dot represents the mean of one subject. Error bars represent standard error of the mean across individuals. Brackets and stars indicate significance. There was a significant decrease in the number of vocalizations in PWS group (t-test, p<10-11), and in the PWS-L (t-test, p<10-11) group compared to the CT group. Data on log scale. (C) Duration of vocalizations. Note there was no significant difference in the duration of vocalizations between the CT and PWS groups while there was a significant difference between the CT and PWS-L groups (t-test, p<0.02). (D) Mean pause duration between vocalizations, with a significant increase in the PWS group (t-test, p< 10-12) as well as in the PWS-L group (t-test, p< 10-9) compared to the CT group. (E) Proportion of long pauses, with a steadily increasing criterion for ‘long pauses’, in the recordings of the subjects reading the script using the same color scheme as in panels B-D showing that over a range of criteria, PWS in both categories had more ‘long’ pauses. Bars indicate standard error of mean. See also Table S1.
Figure 7
Figure 7. Extemporaneous vocalizations of human controls and PWS
(A) Vocalizations per minute in podcast segments from controls (CT; green, n=68), and PWS (PWS; black, n=28, t-test; p<10-21). Each dot represents the mean of one subject. Error bars represent standard error of the mean across individuals. (B) Duration of vocalization periods. Note the significant increase in PWS group (t-test, p< p<10-12) compared to the CT group. (C) Pause duration between vocalizations, with a significant increase in the duration of pauses in the PWS group (t-test, p<10-17) compared to the CT group. (D) Proportion of long pauses with a steadily increasing criterion for ‘long pauses’, in the recordings of the controls subjects reading the script (CT; green), and PWS (ST; black). Bars indicate standard error of the mean. These results are similar to that of reading a script Figure 6.

References

    1. Bloodstein O, Bernstein Ratner N, editors. A Handbook on Stuttering. 6th 2008.
    1. Conture EG. Stuttering: Its Nature, Dignosis, and Treatment. Allyn and Bacon; 2001.
    1. Fisher SE, Lai CSL, Monaco AP. Deciphering the Genetic Basis of Speech and Language Disorders. Annual Review of Neuroscience. 2003;26:57–80. - PubMed
    1. MacDermot KD, Bonora E, Sykes N, Coupe AM, Lai CSL, Vernes SC, Vargha-Khadem F, McKenzie F, Smith RL, Monaco AP, et al. Identification of FOXP2 Truncation as a Novel Cause of Developmental Speech and Language Deficits. The American Journal of Human Genetics. 2005;76:1074–1080. - PMC - PubMed
    1. Fedorenko E, Morgan A, Murray E, Cardinaux A, Mei C, Tager-Flusberg H, Fisher SE, Kanwisher N. A highly penetrant form of childhood apraxia of speech due to deletion of 16p11. 2. European Journal of Human Genetics 2015 - PMC - PubMed

LinkOut - more resources