. 2016 May 6;352(6286):717-21.
doi: 10.1126/science.aad7701.

Single-molecule decoding of combinatorially modified nucleosomes

Affiliations

Single-molecule decoding of combinatorially modified nucleosomes

Efrat Shema et al. Science. .

Abstract

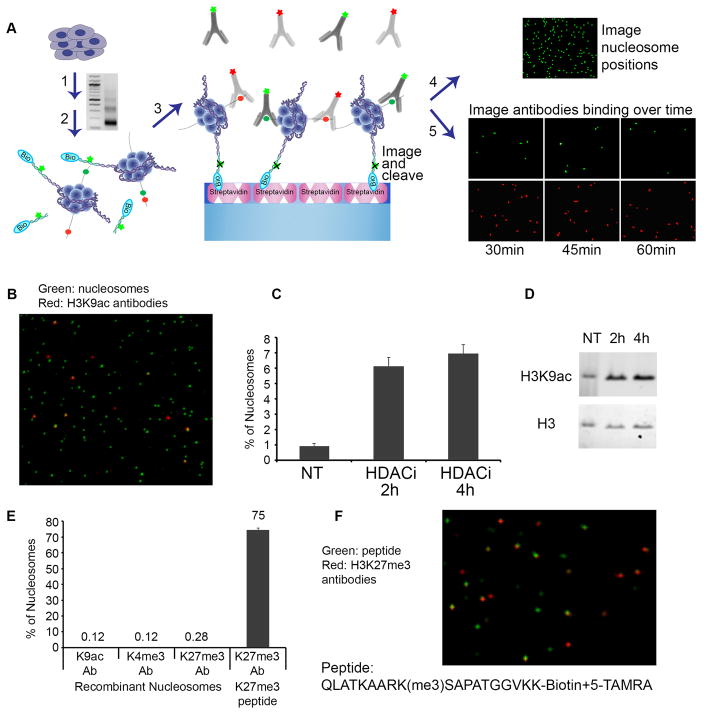
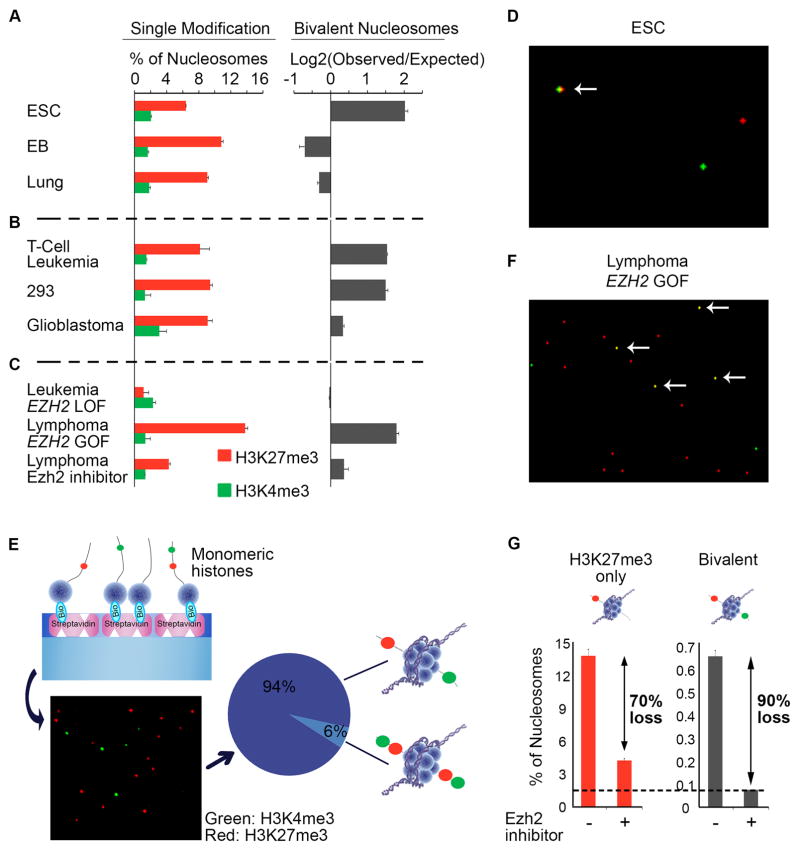
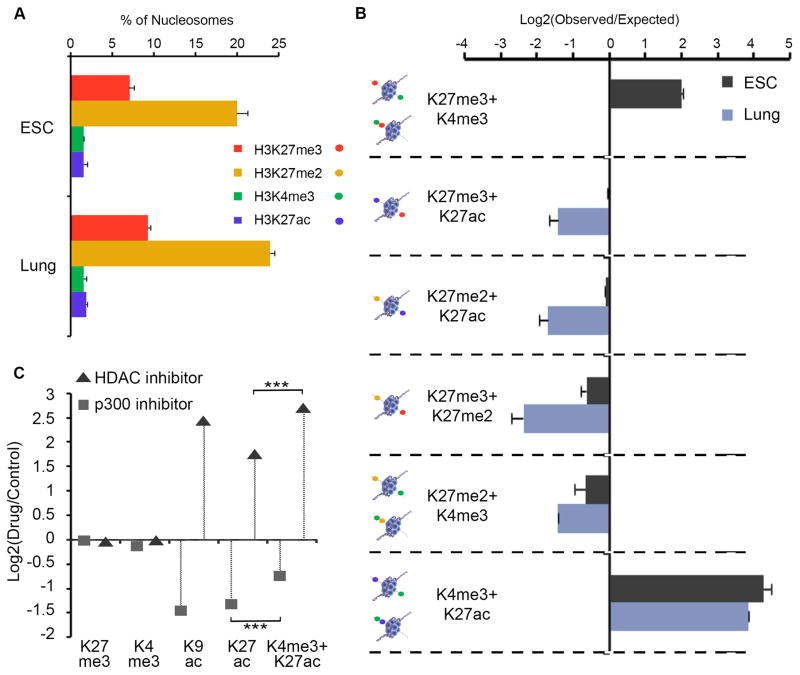
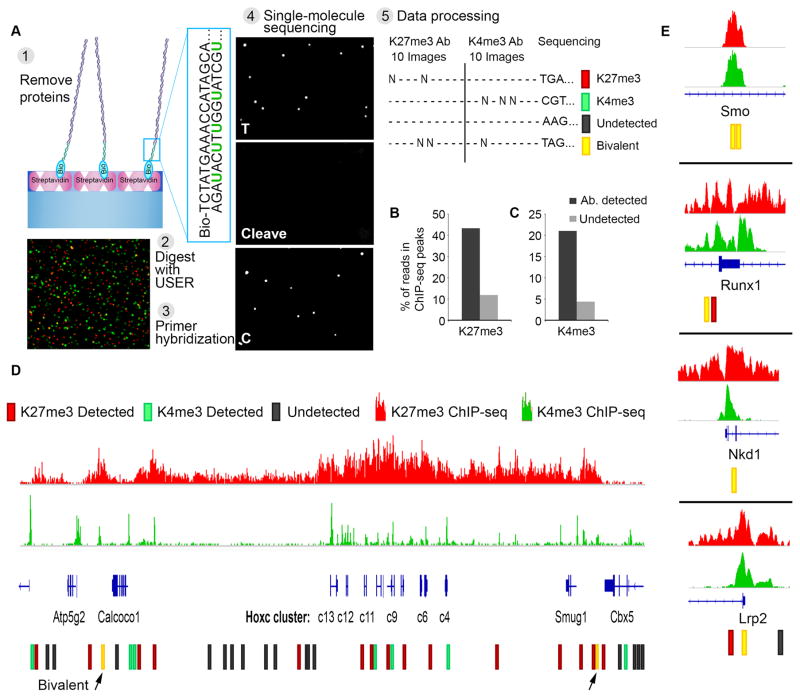
Different combinations of histone modifications have been proposed to signal distinct gene regulatory functions, but this area is poorly addressed by existing technologies. We applied high-throughput single-molecule imaging to decode combinatorial modifications on millions of individual nucleosomes from pluripotent stem cells and lineage-committed cells. We identified definitively bivalent nucleosomes with concomitant repressive and activating marks, as well as other combinatorial modification states whose prevalence varies with developmental potency. We showed that genetic and chemical perturbations of chromatin enzymes preferentially affect nucleosomes harboring specific modification states. Last, we combined this proteomic platform with single-molecule DNA sequencing technology to simultaneously determine the modification states and genomic positions of individual nucleosomes. This single-molecule technology has the potential to address fundamental questions in chromatin biology and epigenetic regulation.


Figures

Fig. 1
Fig. 1. Single-molecule detection of post-translational modifications on nucleosomes
(A) Experimental scheme: (1) Nucleosomes from cells are prepared by Micrococcal Nuclease (MNase) digestion. Gel depicts nucleosomal DNA fragments of expected lengths; (2) Free DNA ends are ligated to fluorescent, biotinylated oligonucleotide adaptors; (3) Adaptor-ligated mono-nucleosomes are purified on a glycerol gradient and captured on PEG-streptavidin coated slides. (4) Nucleosome positions on the surface are imaged by TIRF microscopy, and then the fluorophore is cleaved from the adaptor. (5) Attached nucleosomes are incubated with fluorescently-labeled antibodies to histone modifications. Time-lapse images detect repeated binding and dissociation events and are integrated to score modified nucleosomes. (B-D) HEK293 cells were treated with HDAC inhibitor. (B) Single-Molecule detection of labeled nucleosomes (Alexa555, green) bound by labeled H3K9ac antibodies (Alexa647, red). (C) Proportion of nucleosomes marked by H3K9ac under each condition is determined by single-molecule counting. (D) Western blot confirms increased H3K9ac in treated cells. (E–F) Recombinant unmodified nucleosomes and H3K27me3-modified peptide were probed with the indicated antibodies. (F) Single-molecule detection of labeled H3K27me3 peptide (TAMRA, green) with labeled H3K27me3 antibodies (Alexa647, red) at a single time point.
Fig. 2
Fig. 2. Single-molecule imaging of symmetric and asymmetric bivalent nucleosomes
(A) We queried modifications on nucleosomes from pluripotent ESCs, EBs and lung fibroblasts (lung). Left: Colored bars indicate proportions of nucleosomes with H3K27me3 (red) or H3K4me3 (green). Right: Black bars indicate relative over- or under-representation of bivalent nucleosomes. Results are presented as the Log2 ratio of the observed proportion of bivalent nucleosomes divided by the expected random association of these two marks (random = fraction H3K27me3 * fraction H3K4me3; Fig. S10). (B) Nucleosomes from a T-cell acute lymphoblastic leukemia line, HEK293 cells and glioblastoma stem cells were decoded as in (A). (C) Nucleosomes from an acute leukemia line with a loss-of-function EZH2 mutation, a lymphoma line with a gain-of-function EZH2 mutation, and the lymphoma cells treated with EZH2 inhibitor GSK126. (D) Magnified TIRF image overlay reveals three nucleosomes, one with H3K27me3 (red), one with H3K4me3 (green), and one with concomitant bivalent modifications (arrow). (E) Image depicts H3K27me3 and H3K4me3 antibody binding to individual histones isolated from ESCs. (F–G) The lymphoma cell line with gain-of-function EZH2 was treated with GSK126 for 3 days. (F) Nucleosomes were decoded for H3K27me3 and H3K4me3. Shown is image for pre-treated samples, with arrows highlighting bivalent nucleosomes. (G) Plot depicts proportions of H3K4me3-negative (left, H3K27me3 only) and H3K4me3-positive (right, bivalent) nucleosomes that carry H3K27me3. Bivalent nucleosomes are more likely to lose H3K27me3 following treatment with GSK126.
Fig. 3
Fig. 3. Higher-order modification states across cellular states and inhibitor treatments
(A) Individual nucleosomes from ESCs and lung fibroblasts decoded for H3K4me3, H3K27me3, H3K27me2 and H3K27ac, as described in Fig. 1. Bars depict fraction of nucleosomes with the indicated modification. (B) Bars indicate, for each possible modification pair, relative over- or under-representation, compared to random expectation, as in Fig. 2A. Opposing modifications are relatively more likely to co-exist in ESCs than lung fibroblasts. (C) ESCs were treated with DMSO (control), HDAC inhibitor (Sodium butyrate) or p300 inhibitor (C646). Nucleosomes were isolated and decoded for H3K27me3, H3K4me3, H3K9ac and H3K27ac. Plot shows effects of inhibitors on each single modification or the combination of H3K27ac and H3K4me3.
Fig. 4
Fig. 4. Single-molecule sequencing determines genomic positions of modified nucleosomes
(A) Experimental scheme: (1) Nucleosomes are captured and probed for their modification state, as in Fig. 1A. Histones are evicted by increasing salt concentration. (2) The enzyme USER is applied to excise uracil bases incorporated into the non-biotinylated adaptor strand and expose a known sequence (3) Complementary primer is hybridized to the adaptor. Image shows single molecule detection of nucleosomal DNA (Alexa647, red) and primer (Alexa555, green). (4) Direct single-molecule DNA sequencing-by-synthesis (22). Images reflect two sequencing cycles: incorporation of thymine, cleavage of fluorophore and terminator, and incorporation of cytosine. (5) Data processing: for each x-y coordinate on the surface, sequence data is analyzed and integrated with the initial images scoring antibody binding and modification states of the corresponding nucleosomes. (B) Single-molecule reads were aligned to the genome. Plot indicates proportions of H3K27me3-modified nucleosome reads (‘detected’) or un-modified nucleosome reads (‘undetected’) that aligned to H3K27me3-enriched regions per conventional ChIP-seq. (C) Proportions of H3K4me3-modified nucleosome reads that aligned to H3K4me3-enriched regions per conventional ChIP-seq. (D) The HOXC gene cluster is shown along with H3K27me3 and H3K4me3 ChIP-seq tracks. Single-molecule reads that aligned to these regions are indicated, along with the modification status of the corresponding nucleosome. (E) Analogous data shown for other developmental loci for which bivalent nucleosomes were definitively identified.

Comment in

References

    1. Rivera CM, Ren B. Mapping human epigenomes. Cell. 2013;155:39. - PMC - PubMed
    1. Bannister AJ, Kouzarides T. Regulation of chromatin by histone modifications. Cell Res. 2011;21:381. - PMC - PubMed
    1. Jenuwein T, Allis CD. Translating the histone code. Science. 2001;293:1074. - PubMed
    1. Lee JS, Smith E, Shilatifard A. The language of histone crosstalk. Cell. 2010;142:682. - PMC - PubMed
    1. Sidoli S, Garcia BA. Properly reading the histone code by MS-based proteomics. Proteomics. 2015;15:2901. - PubMed

Publication types