Review
. 2016 Aug 8;11(8):1472-1483.
doi: 10.2215/CJN.13841215. Epub 2016 May 5.

Climate Change and the Emergent Epidemic of CKD from Heat Stress in Rural Communities: The Case for Heat Stress Nephropathy

Affiliations
Review

Climate Change and the Emergent Epidemic of CKD from Heat Stress in Rural Communities: The Case for Heat Stress Nephropathy

Jason Glaser et al. Clin J Am Soc Nephrol. .

Abstract

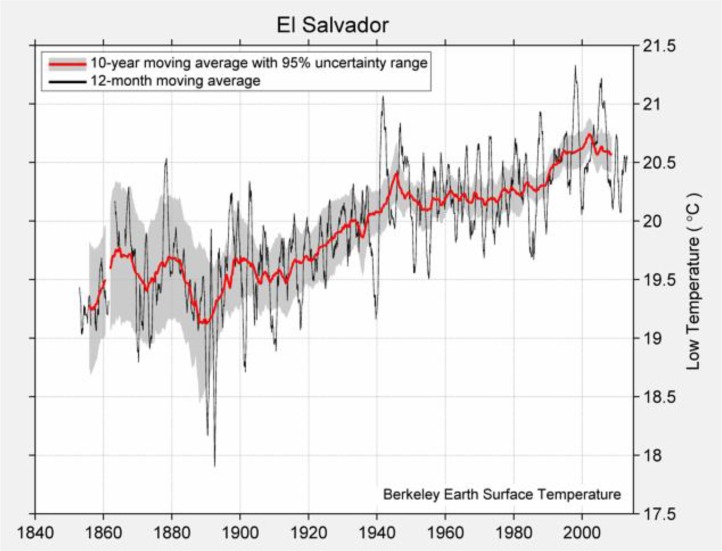
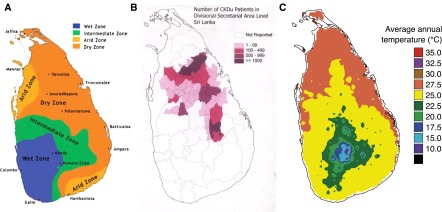
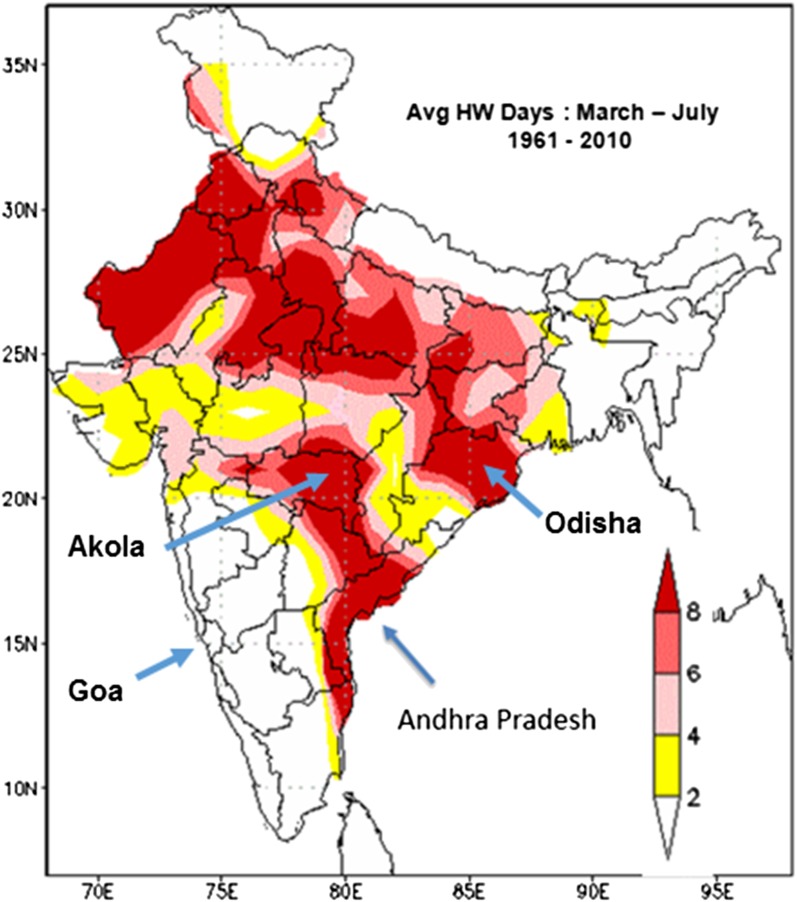
Climate change has led to significant rise of 0.8°C-0.9°C in global mean temperature over the last century and has been linked with significant increases in the frequency and severity of heat waves (extreme heat events). Climate change has also been increasingly connected to detrimental human health. One of the consequences of climate-related extreme heat exposure is dehydration and volume loss, leading to acute mortality from exacerbations of pre-existing chronic disease, as well as from outright heat exhaustion and heat stroke. Recent studies have also shown that recurrent heat exposure with physical exertion and inadequate hydration can lead to CKD that is distinct from that caused by diabetes, hypertension, or GN. Epidemics of CKD consistent with heat stress nephropathy are now occurring across the world. Here, we describe this disease, discuss the locations where it appears to be manifesting, link it with increasing temperatures, and discuss ongoing attempts to prevent the disease. Heat stress nephropathy may represent one of the first epidemics due to global warming. Government, industry, and health policy makers in the impacted regions should place greater emphasis on occupational and community interventions.

Keywords: Chronic; Climate; Climate Change; Dehydration; Health Policy; Heat Exhaustion; Hot Temperature; Physical Exertion; Renal Insufficiency; Rural Population; chronic kidney disease.


Figures

Figure 1.
Figure 1.
Temperature trends in Central America. The average maximum temperatures (Tmax) in Central America over the last 60 years (left panel) correspond closely with sites of the CKD epidemic, such as Chichigalpa and Quezalguaque in Nicaragua, San Alejo and the Bajo Lempa region in El Salvador, or Guanacaste in Costa Rica. Those areas are also generally colocated with the climatologically warmest zones (left panel). Maximum temperatures are also increasing, especially in Guatemala and El Salvador (right panel). Data from the US National Oceanic and Atmospheric Administration, Earth System Research Laboratory, Boulder, Colorado (public domain). Average daily Tmax at observing sites are averaged into monthly, and then into annual mean values. Data are then objectively interpolated to a half-degree grid. The left panel shows the 60-year (1951–2010) annual average, and the right panel shows the total linear trend change over the period 1945–2014.
Figure 2.
Figure 2.
Mechanism for heat stress nephropathy. Repeated heat stress and water shortage, especially when coupled with overexertion, can lead to several pathophysiologic processes, including low grade or overt rhabdomyolysis, hyperosmolarity, hyperthermia, and extracellular volume depletion. These processes can result in several mechanisms that can lead to AKI, including the acute effects of vasopressin on renal tubules, endogenous fructose metabolism in the proximal tubule via the fructokinase system, the development of uricosuria and urate crystal formation, hypokalemia-induced renal vasoconstriction and injury, and a generalized reduction in renal blood flow that may also cause ischemic damage. Repeated AKI, in turn, may lead to chronic tubulointerstitial disease.
Figure 3.
Figure 3.
Changing temperatures in El Salvador. Mean temperatures have increased by about 0.8°C during this period in El Salvador, which results in a significant (30%–75%) increase in the frequency of extremely hot days (>99th percentile) (image from Berkeley Earth [http://berkeleyearth.lbl.gov/regions/el-salvador], public domain).
Figure 4.
Figure 4.
Sri Lankan nephropathy. (A) and (B) An epidemic of CKD is occurring in the dry zone of the north central region of Sri Lanka. (C) The region is exceptionally hot, with average temperatures of approximately 30°C. While the relationship of CKD with higher average annual temperatures is evident, it is interesting that the most northern part of Sri Lanka is also hot but does not appear to be a site of the CKD epidemic. However, this is an area where little investigation has been done, and it remains possible to be a site of underreporting. (A) and (B) courtesy of Channa Jayasumana (106). (C) is from the Centre for Climate Change Studies, Department of Meteorology, Colombo, Sri Lanka (http://www.meteo.gov.lk/index.php?option=com_content&view=article&id=13&Itemid=132&lang=en). CKDu, CKD of unknown etiology.
Figure 5.
Figure 5.
Confirmed site (Andhra Pradesh) and suspected sites of CKD epidemics of unknown etiology in India. Average number of heat wave days (Avg HW days) between March and July (hottest time of the year) in India, based on the number of heat wave days over the 50-year period. Andhra Pradesh has had some of the longest heat waves, with one recorded at 35 days. Other suspected sites of CKD of unknown etiology, such as the Akola district of Maharashtra and the central Odisha region, are also sites with high number of heat waves. In contrast, Goa does not show this pattern. Courtesy: Editor Mausam—India Meteorological Department. Reprinted from reference 5, with permission.
Figure 6.
Figure 6.
Worldwide annual maximum temperature changes. Change in annual maximum temperature from 1945 to 2014 (top panel) and the average annual maximum temperature during 1945–2010 (bottom panel). From the US National Oceanic and Atmospheric Administration, Earth System Research Laboratory, Boulder, Colorado (public domain). Data definition as shown in Figure 1. EQ, equator; Tmax, annual maximum temperature.

References

    1. Fischer EM, Knutti R: Anthropogenic contribution to global occurrence of heavy precipitation and high temperature extremes. Nat Clim Chang 5: 560–565, 2015
    1. Meehl GA, Tebaldi C: More intense, more frequent, and longer lasting heat waves in the 21st century. Science 305: 994–997, 2004 - PubMed
    1. Rahmstorf S, Coumou D: Increase of extreme events in a warming world. Proc Natl Acad Sci U S A 108: 17905–17909, 2011 - PMC - PubMed
    1. Morak S, Hegerl G, Christidis N: Detectable changes in the frequency of temperature extremes. J Clim 26: 1561–1564, 2013
    1. Pai DS, Nair SA, Ramanthan AN: Long term climatology and trends of heat waves over India during the recent 50 years (1961-2010). Mausam (New Delhi) 64: 585–604, 2013

Publication types