

Bile acids promote diethylnitrosamine-induced hepatocellular carcinoma via increased inflammatory signaling
- PMID: 27151938
- PMCID: PMC4967172
- DOI: 10.1152/ajpgi.00027.2015
Bile acids promote diethylnitrosamine-induced hepatocellular carcinoma via increased inflammatory signaling
Abstract
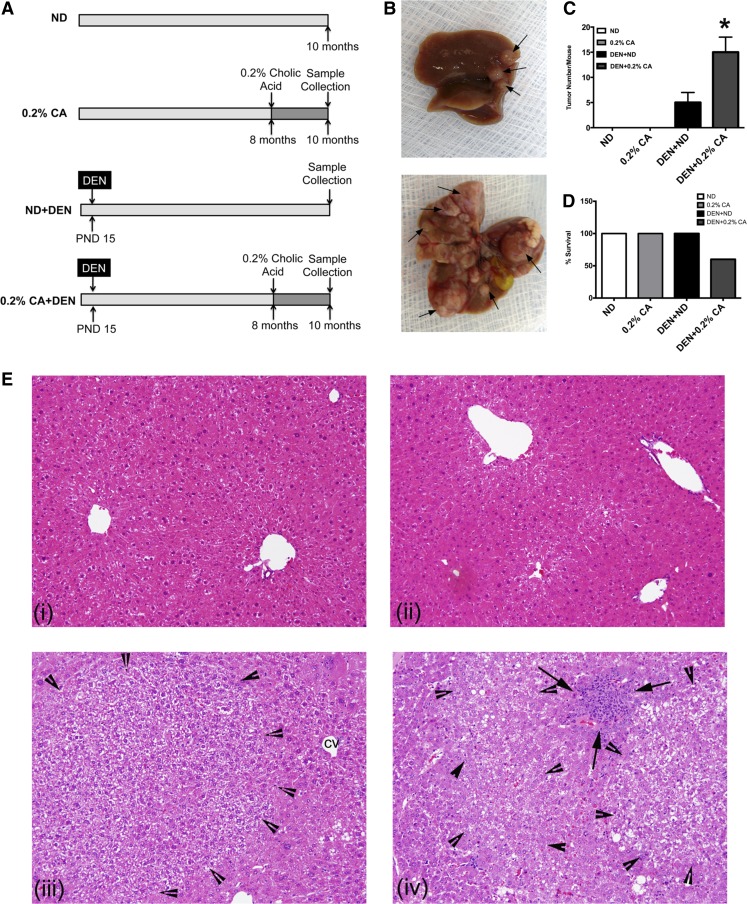
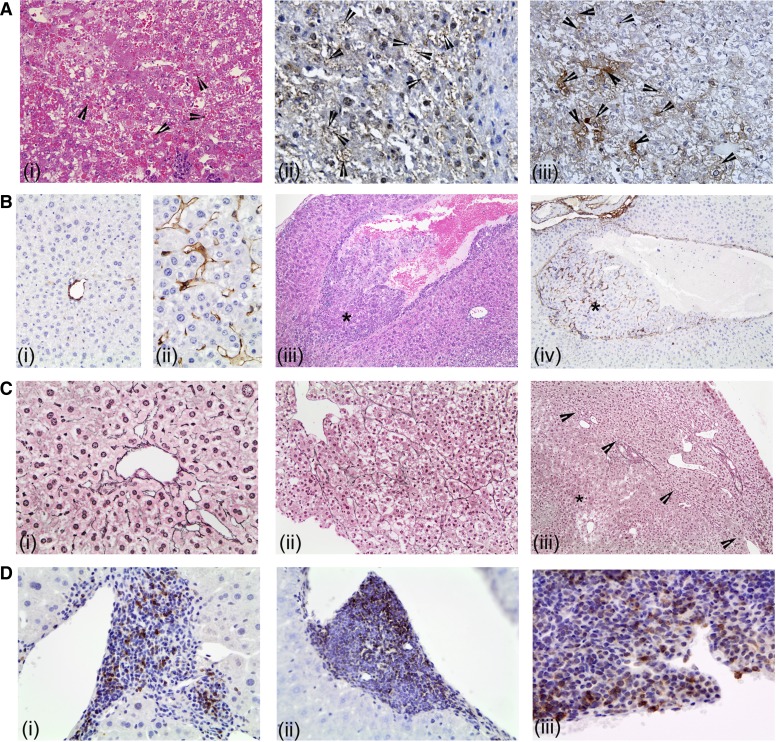
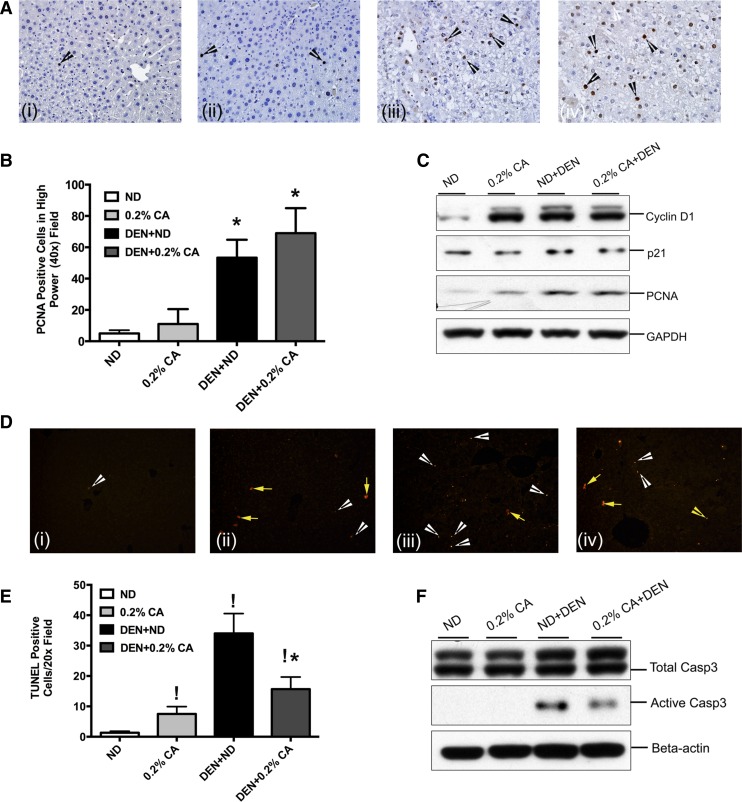
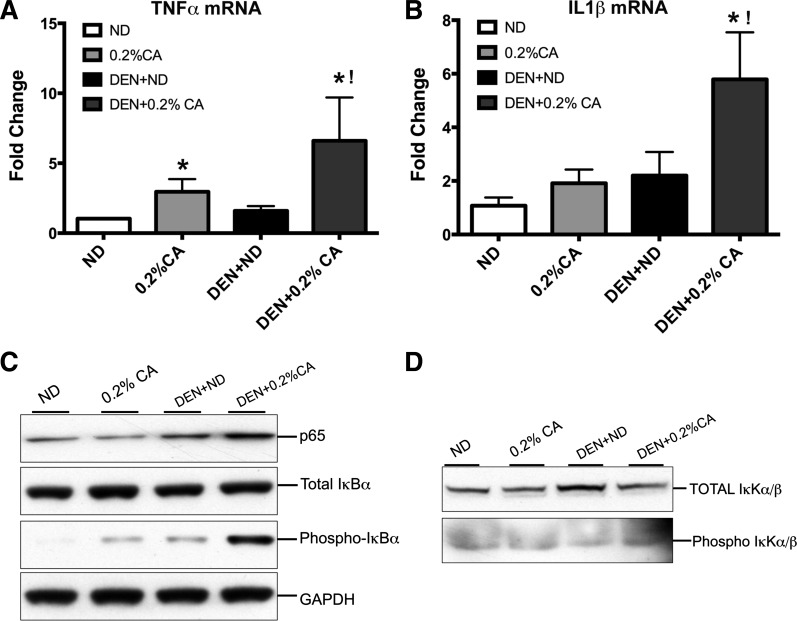
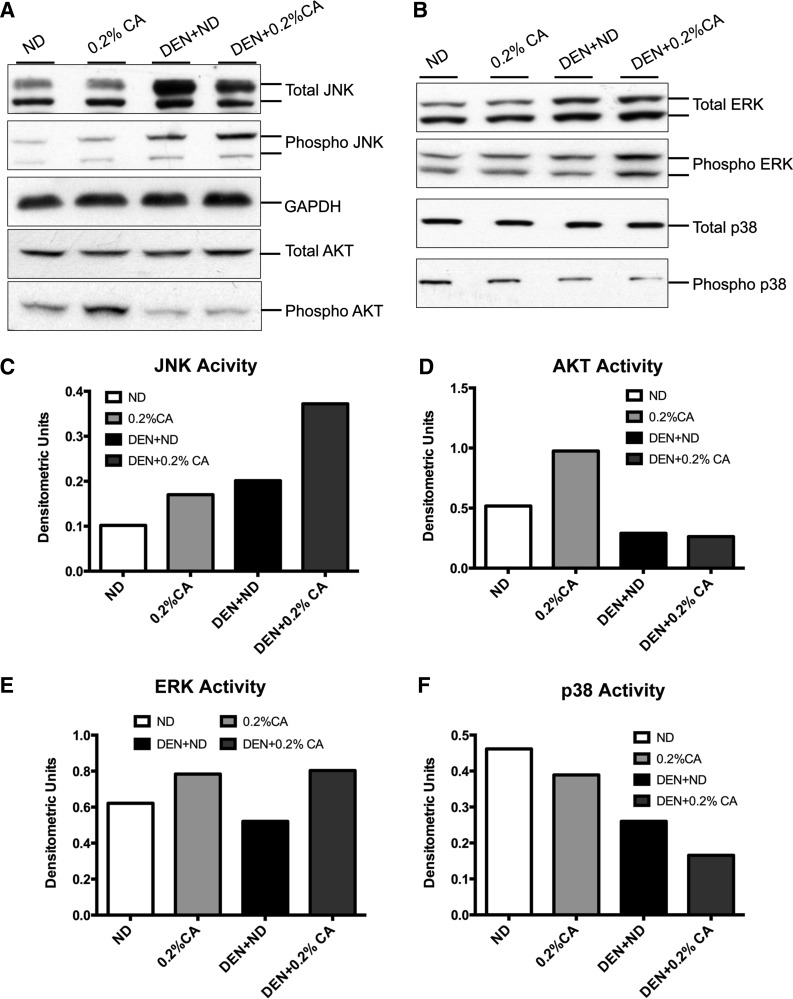
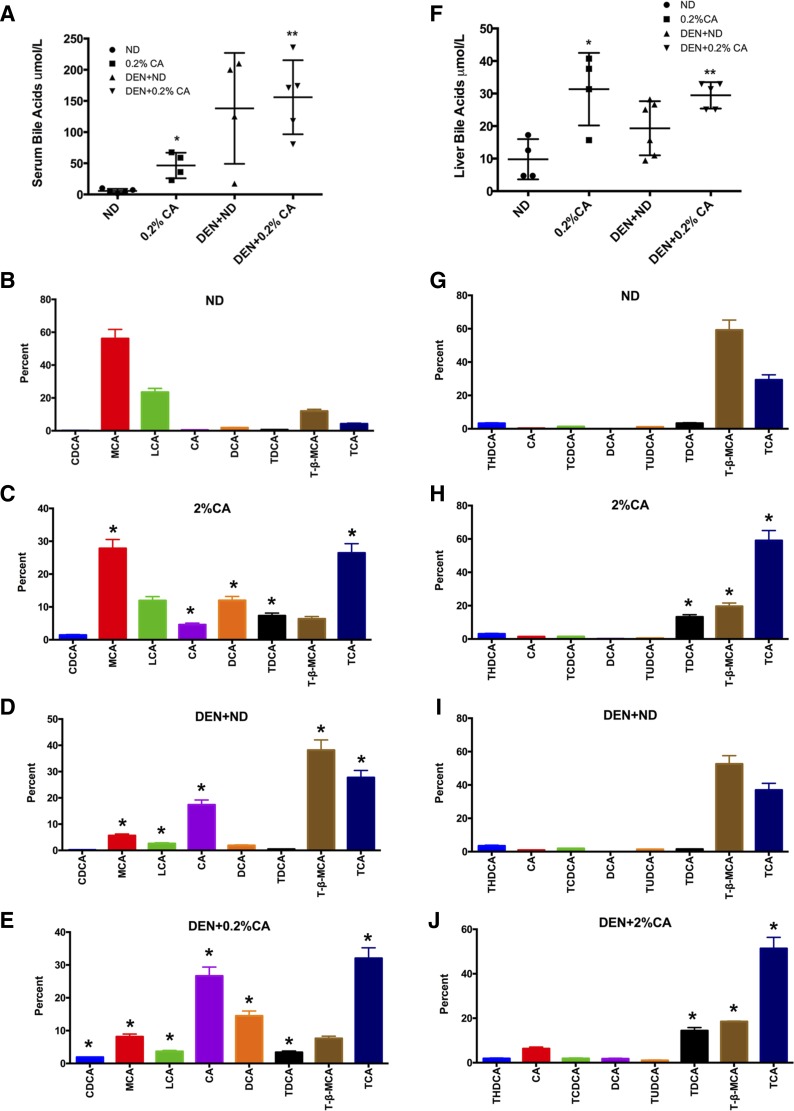
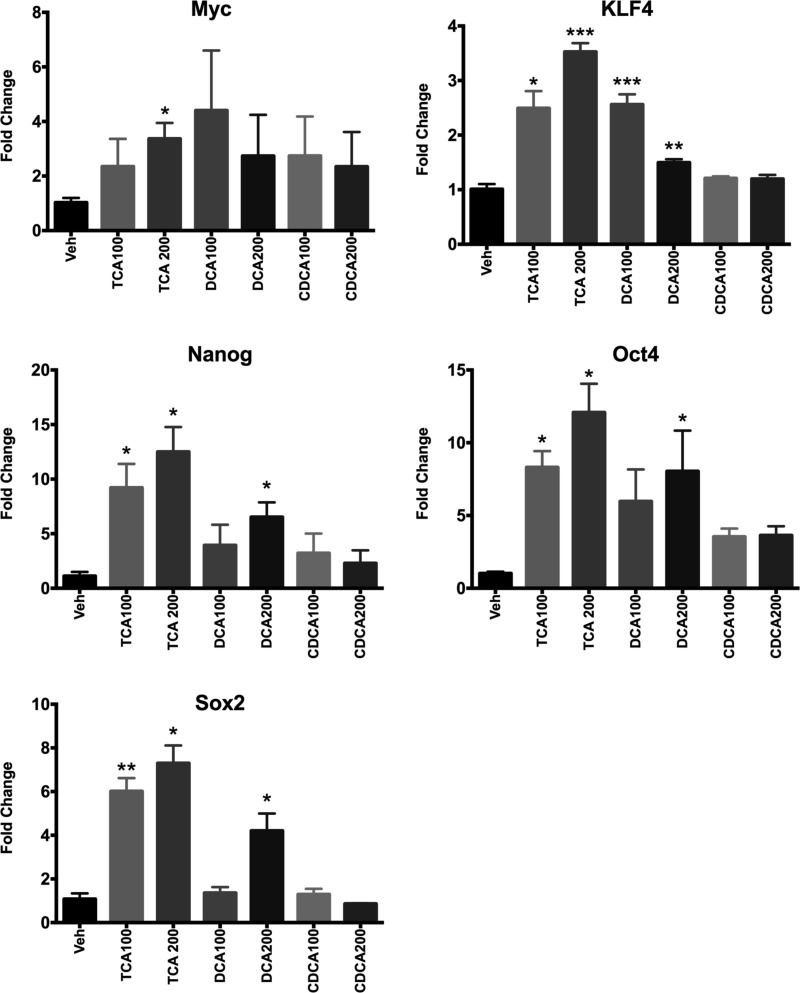
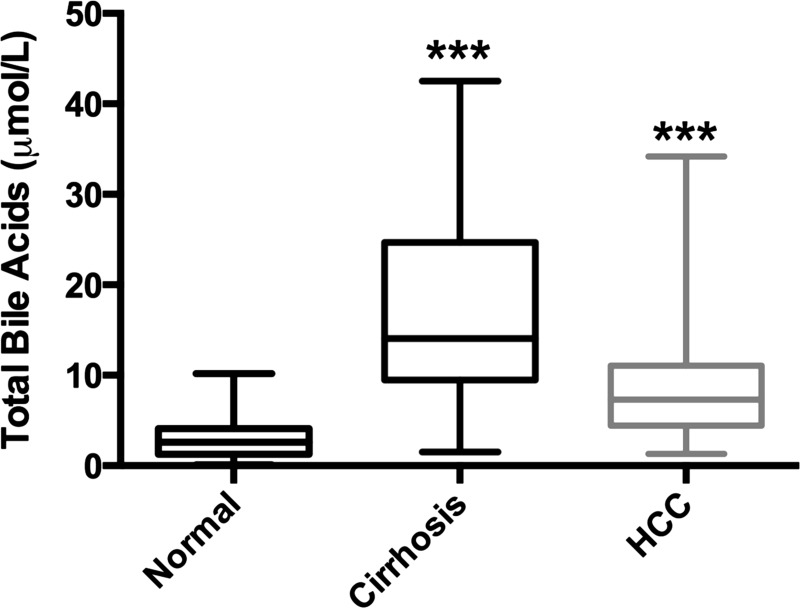
Hepatocellular carcinoma (HCC) is the most common hepatic malignancy and the third leading cause of cancer related deaths. Previous studies have implicated bile acids in pathogenesis of HCC, but the mechanisms are not known. We investigated the mechanisms of HCC tumor promotion by bile acids the diethylnitrosamine (DEN)-initiation-cholic acid (CA)-induced tumor promotion protocol in mice. The data show that 0.2% CA treatment resulted in threefold increase in number and size of DEN-induced liver tumors. All tumors observed in DEN-treated mice were well-differentiated HCCs. The HCCs observed in DEN-treated CA-fed mice exhibited extensive CD3-, CD20-, and CD45-positive inflammatory cell aggregates. Microarray-based global gene expression studies combined with Ingenuity Pathway Analysis revealed significant activation of NF-κB and Nanog in the DEN-treated 0.2% CA-fed livers. Further studies showed significantly higher TNF-α and IL-1β mRNA, a marked increase in total and phosphorylated-p65 and phosphorylated IκBα (degradation form) in livers of DEN-treated 0.2% CA-fed mice. Treatment of primary mouse hepatocytes with various bile acids showed significant induction of stemness genes including Nanog, KLF4, Sox2, and Oct4. Quantification of total and 20 specific bile acids in liver, and serum revealed a tumor-associated bile acid signature. Finally, quantification of total serum bile acids in normal, cirrhotic, and HCC human samples revealed increased bile acids in serum of cirrhotic and HCC patients. Taken together, these data indicate that bile acids are mechanistically involved pathogenesis of HCC and may promote HCC formation via activation of inflammatory signaling.
Keywords: NF-κB; Nanog; cholic acid; proliferation.
Copyright © 2016 the American Physiological Society.
Figures
Similar articles
-
Abberent expression of NOR1 protein in tumor associated macrophages contributes to the development of DEN-induced hepatocellular carcinoma.J Cell Physiol. 2018 Jun;233(6):5002-5013. doi: 10.1002/jcp.26349. Epub 2018 Jan 4. J Cell Physiol. 2018. PMID: 29227538
-
NADPH Oxidase 1 in Liver Macrophages Promotes Inflammation and Tumor Development in Mice.Gastroenterology. 2019 Mar;156(4):1156-1172.e6. doi: 10.1053/j.gastro.2018.11.019. Epub 2018 Nov 13. Gastroenterology. 2019. PMID: 30445007 Free PMC article.
-
Inhibitory role of Smad7 in hepatocarcinogenesis in mice and in vitro.J Pathol. 2013 Aug;230(4):441-52. doi: 10.1002/path.4206. J Pathol. 2013. PMID: 23625826
-
Cancer stem cells generated by alcohol, diabetes, and hepatitis C virus.J Gastroenterol Hepatol. 2012 Mar;27 Suppl 2(Suppl 2):19-22. doi: 10.1111/j.1440-1746.2011.07010.x. J Gastroenterol Hepatol. 2012. PMID: 22320911 Free PMC article. Review.
-
Liver cancer stem cells.J Clin Oncol. 2008 Jun 10;26(17):2800-5. doi: 10.1200/JCO.2007.15.5945. J Clin Oncol. 2008. PMID: 18539957 Free PMC article. Review.
Cited by
-
The causal relationship between immune cells and hepatocellular carcinoma: a Mendelian randomization (MR).Ecancermedicalscience. 2024 Nov 8;18:1794. doi: 10.3332/ecancer.2024.1794. eCollection 2024. Ecancermedicalscience. 2024. PMID: 39816386 Free PMC article.
-
Inhibition of Glycogen Synthase Kinase 3 Accelerated Liver Regeneration after Acetaminophen-Induced Hepatotoxicity in Mice.Am J Pathol. 2017 Mar;187(3):543-552. doi: 10.1016/j.ajpath.2016.11.014. Epub 2017 Jan 6. Am J Pathol. 2017. PMID: 28068511 Free PMC article.
-
MITOCHONDRIAL CHOLESTEROL AND CANCER.Semin Cancer Biol. 2021 Aug;73:76-85. doi: 10.1016/j.semcancer.2020.07.014. Epub 2020 Aug 14. Semin Cancer Biol. 2021. PMID: 32805396 Free PMC article. Review.
-
Bile Acids and Liver Cancer: Molecular Mechanism and Therapeutic Prospects.Pharmaceuticals (Basel). 2024 Aug 30;17(9):1142. doi: 10.3390/ph17091142. Pharmaceuticals (Basel). 2024. PMID: 39338306 Free PMC article. Review.
-
Taurohyocholic acid acts as a potential predictor of the efficacy of tyrosine kinase inhibitors combined with programmed cell death-1 inhibitors in hepatocellular carcinoma.Front Pharmacol. 2024 Feb 23;15:1364924. doi: 10.3389/fphar.2024.1364924. eCollection 2024. Front Pharmacol. 2024. PMID: 38464731 Free PMC article.
References
-
- Baptissart M, Vega A, Maqdasy S, Caira F, Baron S, Lobaccaro JM, Volle DH. Bile acids: from digestion to cancers. Biochimie 95: 504–517, 2013. - PubMed
MeSH terms
Substances
Grants and funding
LinkOut - more resources
Full Text Sources
Other Literature Sources
Molecular Biology Databases
Research Materials
Miscellaneous