. 2016 Jun 15;143(12):2238-47.
doi: 10.1242/dev.129908. Epub 2016 May 5.

Quantitative imaging of lipids in live mouse oocytes and early embryos using CARS microscopy

Affiliations

Quantitative imaging of lipids in live mouse oocytes and early embryos using CARS microscopy

Josephine Bradley et al. Development. .

Abstract

Mammalian oocytes contain lipid droplets that are a store of fatty acids, whose metabolism plays a substantial role in pre-implantation development. Fluorescent staining has previously been used to image lipid droplets in mammalian oocytes and embryos, but this method is not quantitative and often incompatible with live cell imaging and subsequent development. Here we have applied chemically specific, label-free coherent anti-Stokes Raman scattering (CARS) microscopy to mouse oocytes and pre-implantation embryos. We show that CARS imaging can quantify the size, number and spatial distribution of lipid droplets in living mouse oocytes and embryos up to the blastocyst stage. Notably, it can be used in a way that does not compromise oocyte maturation or embryo development. We have also correlated CARS with two-photon fluorescence microscopy simultaneously acquired using fluorescent lipid probes on fixed samples, and found only a partial degree of correlation, depending on the lipid probe, clearly exemplifying the limitation of lipid labelling. In addition, we show that differences in the chemical composition of lipid droplets in living oocytes matured in media supplemented with different saturated and unsaturated fatty acids can be detected using CARS hyperspectral imaging. These results demonstrate that CARS microscopy provides a novel non-invasive method of quantifying lipid content, type and spatial distribution with sub-micron resolution in living mammalian oocytes and embryos.

Keywords: Egg; Embryo; Lipid; Microscopy; Oocyte.


Conflict of interest statement

Competing interests

The authors declare no competing or financial interests.

Figures

Fig. 1.
Fig. 1.
CARS and DIC images in living oocytes, eggs and early embryonic stages. (A-G) DIC images (single z-plane, except E, which is a maximum intensity projection) representative of populations of mouse eggs and embryos, from (A) immature GV stage (n=∼90), (B) MII eggs (n=∼70), (C) two-cell (n=∼65), (D) four-cell (n=∼60), (E) eight-cell (n=∼10), (F) morula (n=∼35) and (G) blastocyst stage (n=∼20) embryos using a 1.27 NA water objective and a 1.4 NA oil condenser. (H-N) Depth colour-coded images of CARS z-stacks at wavenumber 2850 cm−1 through the same eggs and embryos, showing LDs throughout these developmental stages. Inset in (I) shows a typical LD cluster seen at this stage. 0.1×0.1 µm xy pixel size; 0.5 µm z-step; 0.01 ms pixel dwell time; ∼14 mW (∼9 mW) pump (Stokes) power at the sample. Scale bars: 10 µm. Colour bar shows depth colour-coding from –25 µm-25 µm of 101 z-stacks (0 µm being the approximately equatorial plane of the egg or embryo), the brightness of each colour is the maximum intensity at each corresponding z-plane. Data from ≥2 trials, using 1-3 mice each.
Fig. 2.
Fig. 2.
Lipid droplet quantification and clustering analysis. (A,B) Histograms of LD aggregate sizes (number of LDs in each cluster, and their occurrence) in a typical (A) GV oocyte, and (B) MII egg. Total number of LDs and total number of un-clustered LDs are also indicated. (C) Scatter plot of the square root of the mean square aggregate size (formula image
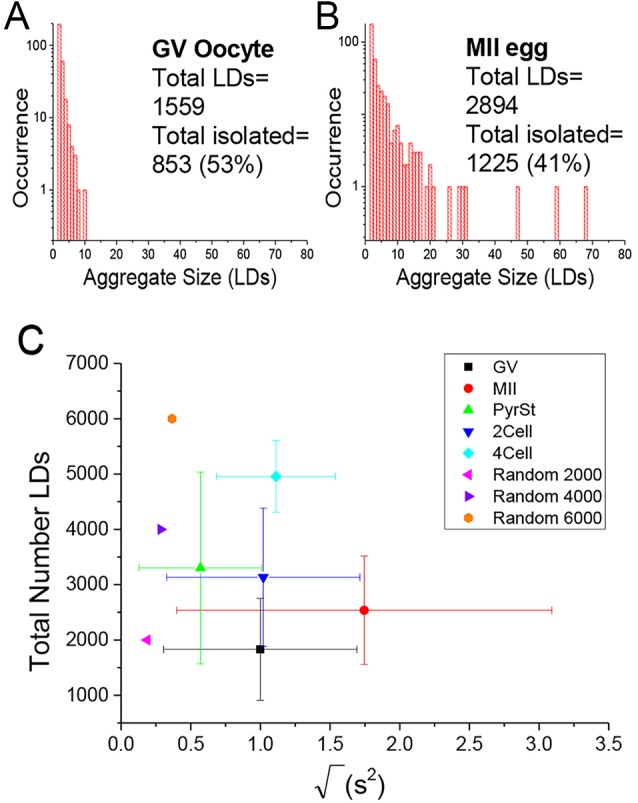
) against the total number of LDs, in ensembles of GV oocytes (n=33), MII eggs (n=30), MII eggs starved of pyruvate (PyrSt; n=8), two-cell (2Cell; n=10) and four-cell (4Cell; n=8) embryos (including those represented in Fig. 1). The distribution of each variable in the corresponding ensemble is shown as a mean (symbol) and standard deviation (bar). The case of a random LD distribution simulated for a range of total number of LDs is also shown for comparison.
Fig. 3.
Fig. 3.
Cell viability after live imaging with CARS. (A,D) Single z-plane DIC using a 1.27 NA water objective and a 1.4 NA oil condenser and (B,E) depth colour-coded images of CARS stacks at wavenumber 2850 cm−1, of an egg before and after in vitro maturation, showing that development can still occur after live imaging with CARS (n=40). (C,F) Histograms of the number of LDs making up clusters in these cells, demonstrating the change in LD distribution over time. 0.1×0.1 µm xy pixel size; 0.5 µm z-step; 0.01 ms pixel dwell time; ∼13 mW (∼9 mW) pump (Stokes) power at the sample. Scale bars: 10 µm. Colour bar shows depth colour-coding from –25 µm-25 µm (0 µm being the equatorial plane). Data from >5 trials, using 1-3 mice each.
Fig. 4.
Fig. 4.
Embryo viability after live imaging with CARS. (A) Single z-plane and (B) maximum intensity projection DIC images taken with a 1.27 NA water objective and a 1.4 NA oil condenser of an embryo at four-cell stage and blastocyst stage, without CARS imaging (n=10). (C-F) Single z-plane DIC and (G-J) depth colour-coded CARS stacks of four-cell embryos before their development to blastocyst stage after different CARS imaging at 2850 cm−1. Number of CARS images taken is indicated in the top right corner; (G) 1 CARS xy image (n=9), (H) 11 CARS xy images with 5 µm z-steps (n=10), (I) 21 CARS xy images with 0.5 µm z-steps (n=9), (J) 41 CARS xy images taken with 0.5 µm z-steps (n=10). (K-N) Maximum intensity projection DIC images of blastocyst stages of the same embryos seen at the four-cell stage in panels C-J; blastocyst developmental rate is indicated beneath panels. (O,P) DIC and CARS (1 xy) images of a two-cell embryo, and (Q) DIC image of the same embryo 5 days later, demonstrating arrest (n=49). 0.1×0.1 µm pixel size; 0.01 ms pixel dwell time; ∼14 mW (∼9 mW) pump (Stokes) power at the sample. Scale bars: 10 µm. Colour bar shows depth colour-coding from –25 µm-25 µm (0 µm being the equatorial plane). Data from >5 trials, using 1-3 mice each.
Fig. 5.
Fig. 5.
CARS images compared with conventional fluorescent lipid dyes on fixed eggs. (A-D) DIC (using a 1.27 NA water objective and a 1.4 NA oil condenser), (E-H) false-coloured CARS images at wavenumber 2850 cm−1 and (I-L) TPF xy images, accompanied by (M-P) false-coloured overlays, of GV and MII eggs stained with BODIPY (n=23 and 30, respectively) or LipidTox green neutral lipid stain (n=7 and 20, respectively). All images are maximum intensity projections of stacks with 0.5 µm z-steps. 0.1×0.1 µm pixel size; 0.01 ms pixel dwell time; ∼12 mW (∼9 mW) pump (Stokes) power at the sample. CARS and TPF signal intensities are given in photoelectrons per second (ph.e/s). Scale bars: 10 µm. (Q-T) Scatterplots of pixel-coordinate correlation between CARS (x-axis) and TPF images (y-axis), and the mean Pearson's correlation coefficients of all investigated eggs, to show the degree of reliability of these dyes. A colocalisation is apparent with a Pearson's coefficient of >0.5, but is only considered significant if >0.95 as in accordance with normal 95% confidence limits. Data from ≥4 trials, using 1-3 mice each.
Fig. 6.
Fig. 6.
Hyperspectral imaging of chemical content of oocytes, eggs and embryos. (A-E) Vibrational Raman-like spectra Im(χ) obtained from CARS hyperspectral images. (A) Example LDs in all GV oocytes (n=7) and (B) three LDs in the same GV oocyte, shown in the accompanying image. (C) Example LDs in all MII eggs (n=7) and (D) three LDs in the same MII egg, shown in the accompanying image. (E) Three LDs in two different blastocyst stage embryos, ‘Embryo 2’ shown in the accompanying image. (F-H) Raman spectra of (F) pure oleic acid (OA) and palmitic acid (PA) in the solid (ordered) phase (digitised from spectra given by Sigma), against the retrieved PCKK spectrum of glycerol trioleate (GTO; oleic acid in its triglyceride form), (G) three LDs in an MII egg in vitro matured in 100 µM oleic acid (n=16), and (H) three LDs in MII eggs in vitro matured in 100 µM (n=31) or 250 µM palmitic acid (n=33), LDs shown in the accompanying images. Spectra are normalised to the total area. Peaks: (*) ∼2850 cm−1 correspond to the symmetric CH2 stretch; ∼2880 cm−1 to the asymmetric CH2 stretch, especially enhanced in ordered/solid-phase; (φ) ∼2930 cm−1 to CH3 and asymmetric CH2 stretch vibrations, enhanced in disordered/liquid-phase acyl chains; (ψ) ∼3010 cm−1 correspond to the =CH stretch. Note, the intensity ratio between bands at 2880 cm−1 and 2850 cm−1 can be used as a measure of acyl chain order; the ratio between peaks at 2930 cm−1 and 2850 cm−1 can be used to ascertain chain disorder. Accompanying images show the 10 µm×80-100 µm area over which hyperspectral scans were obtained. Scale bars: 10 µm. Data from ≥2 trials, using 1-3 mice each.

References

    1. Aardema H., Vos P. L. A. M., Lolicato F., Roelen B. A. J., Knijn H. M., Vaandrager A. B., Helms J. B. and Gadella B. M. (2011). Oleic acid prevents detrimental effects of saturated fatty acids on bovine oocyte developmental competence. Biol. Reprod. 85, 62-69. 10.1095/biolreprod.110.088815 - DOI - PubMed
    1. Acton B. M., Jurisicova A., Jurisica I. and Casper R. F. (2004). Alterations in mitochondrial membrane potential during preimplantation stages of mouse and human embryo development. Mol. Hum. Reprod. 10, 23-32. 10.1093/molehr/gah004 - DOI - PubMed
    1. Del Collado M., Saraiva N. Z., Lopes F. L., Gaspar R. C., Padilha L. C., Costa R. R., Rossi G. F., Vantini R. and Garcia J. M. (2015). Influence of bovine serum albumin and fetal bovine serum supplementation during in vitro maturation on lipid and mitochondrial behaviour in oocytes and lipid accumulation in bovine embryos. Reprod. Fertil. Dev. (in press), 10.1071/rd15067. - DOI - PubMed
    1. Di Napoli C., Masia F., Pope I., Otto C., Langbein W. and Borri P. (2014a). Chemically-specific dual/differential CARS micro-spectroscopy of saturated and unsaturated lipid droplets. J. Biophotonics 7, 68-76. 10.1002/jbio.201200197 - DOI - PubMed
    1. Di Napoli C., Pope I., Masia F., Watson P., Langbein W. and Borri P. (2014b). Hyperspectral and differential CARS microscopy for quantitative chemical imaging in human adipocytes. Biomed. Opt. Express 5, 1378-1390. 10.1364/BOE.5.001378 - DOI - PMC - PubMed

Publication types

LinkOut - more resources