. 2016 Apr 13;3(4):150670.
doi: 10.1098/rsos.150670. eCollection 2016 Apr.

Assessing recognition memory using confidence ratings and response times

Affiliations

Assessing recognition memory using confidence ratings and response times

Christoph T Weidemann et al. R Soc Open Sci. .

Abstract

Classification of stimuli into categories (such as 'old' and 'new' in tests of recognition memory or 'present' versus 'absent' in signal detection tasks) requires the mapping of internal signals to discrete responses. Introspective judgements about a given choice response are regularly employed in research, legal and clinical settings in an effort to measure the signal that is thought to be the basis of the classification decision. Correlations between introspective judgements and task performance suggest that such ratings often do convey information about internal states that are relevant for a given task, but well-known limitations of introspection call the fidelity of this information into question. We investigated to what extent response times can reveal information usually assessed with explicit confidence ratings. We quantitatively compared response times to confidence ratings in their ability to qualify recognition memory decisions and found convergent results suggesting that much of the information from confidence ratings can be obtained from response times.

Keywords: confidence ratings; receiver operating characteristic; recognition memory; response times.


Figures

Figure 1.
Figure 1.
Response probabilities for bins of each measure (a) used to compute the ROC functions (b) with corresponding areas (c). Rows show analyses for confidence ratings and response times, respectively. For illustrative purposes, RT strength is shown partitioned into the same number of levels as there are confidence ratings (using equally-spaced quantiles) and the points on the ROC functions corresponding to these bins are indicated. However, smooth ROC functions taking advantage of the full resolution of the data are drawn and form the basis of the area calculations. The left-most points on the ROC functions correspond to the right-most bars in the left panels and subsequent points are calculated by cumulatively adding the probabilities for targets and lures to the hit and FA values, respectively. Probabilities for target and lures are shown with overlapping bar graphs with hatching as indicated in the legend (additional shading, blue for targets and yellow for lures, is added to help with the discrimination). The classification point (i.e. the point separating ‘old’ from ‘new’ responses) is shown as a diamond (solid-red and dashed-green parts of the ROC functions indicate the parts corresponding to ‘old’ and ‘new’ responses, respectively). Main diagonals as well as random ROC functions are shown as dotted lines in the ROC plots. The lowest value on the ordinate for the bar graphs on the right (0.87) corresponds to the area under the random ROC. Error bars on the area measure show the 95% confidence intervals.
Figure 2.
Figure 2.
Scatter-plots comparing areas under the ROC curve (AUC) for confidence ratings (C) and response latency (L). Corresponding correlations and the main diagonal are indicated in each panel. Data points correspond to the average AUCs across all sessions for each participant. Individual data points are transparent such that darkness indicates density of points in a given area. (a) Comparison of the areas under the entire ROC functions. (b) Comparison of the areas under the ROC functions for ‘old’ (O) responses only. (c) Comparison of the areas under the ROC functions for ‘new’ (N) responses only. Note that the scales in (a) differ from those in the other two panels.
Figure 3.
Figure 3.
Conditional response probabilities for bins of each measure (a) used to compute conditional ROC functions (b) with corresponding areas (c). Same data as in figure 1, but probabilities are conditioned on the respective classification responses. Separate ROC functions for ‘old’ and ‘new’ judgements are generated by cumulatively adding target and lure probabilities with decreasing strengths to the hit and FA values, respectively, for ‘old’ responses and vice versa for ‘new’ responses. The corresponding AUCs with 95% confidence intervals are shown in (c). As in figure 1 blue and yellow shadings correspond to data from targets and lures, respectively, and red and green shadings correspond to data from ‘old’ and ‘new’ responses, respectively.
Figure 4.
Figure 4.
Scatter-plots comparing areas under the ‘old’ (‘O’) and ‘new’ (‘N’) ROC functions (AUC) for confidence ratings (C; (a)) and response latency (L; (b)). Corresponding correlations and the main diagonal are indicated in each panel. Individual data points are transparent such that darkness indicates density of points in a given area.
Figure 5.
Figure 5.
Mean areas under the ROC functions (AUC) across participants for targets that were previously recalled and those that were previously unrecalled within each session (the same set of lures were used in the calculation of both sets of AUCs). Separate AUCs are shown for ROC functions based on confidence ratings (C), response latency (L) as well as corresponding ROC functions conditioned on the classification response (‘O’: ‘old’, ‘N’: ’new’). The darker shadings in the lower parts of the C and L bars indicate the portions of the total area that are attributable to the area of the random ROC. Error bars show the 95% confidence intervals.
Figure 6.
Figure 6.
Scatter-plots comparing areas under the ROC functions for targets that were previously recalled and those that were previously unrecalled within each session (the same set of lures were used in the generation of both ROC functions). Separate scatter-plots are shown for ROC functions based on confidence ratings (a) versus response latency (b). Corresponding correlations and the main diagonal are indicated in each panel. Individual data points are transparent such that darkness indicates density of points in a given area.
Figure 7.
Figure 7.
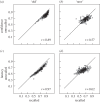
Scatter-plots comparing areas under the ROC functions for targets that were previously recalled and those that were previously unrecalled within each session (the same set of lures were used in the generation of both ROC functions). Separate scatter-plots are shown for ROC functions based on confidence ratings (top row, (a,b)) versus response latency (bottom row, (c,d)) and ‘old’ (left column, (a,c)) versus ‘new’ (right column, (b,d)) responses. Corresponding correlations and the main diagonal are indicated in each panel. Individual data points are transparent such that darkness indicates density of points in a given area.
Figure 8.
Figure 8.
ROC functions based on fictional data shown in table 1. (a) An ROC function based on both ‘old’ and ‘new’ responses (cf. table 2). The classification point (i.e. the point separating ‘old’ from ‘new’ responses) is shown as a diamond (solid-red and dashed-green parts of the ROC functions indicate the parts corresponding to ‘old’ and ‘new’ responses, respectively). (b) Separate ROC functions for ‘old’ and ‘new’ judgements (cf. tables 3 and 4). Main diagonals as well as the random ROC function (a) are shown as dotted lines.

Similar articles

Cited by

References

    1. Green DM, Swets JA. 1966. Signal detection theory and psychophysics. New York, NY: John Wiley and Sons Inc.
    1. Busey TA, Tunnicliff J, Loftus GR, Loftus EF. 2000. Accounts of the confidence-accuracy relation in recognition memory. Psychon. Bull. Rev. 7, 26–48. (doi:10.3758/BF03210724) - DOI - PubMed
    1. Jensen MP, Karoly P. 2011. Self-report scales and procedures for assessing pain in adults. In Handbook of pain assessment, 3rd edn (eds DC Turk, R Melzack), pp. 19–44, New York, NY: Guilford Press.
    1. Wundt W. 1862. Beiträge zur Theorie der Sinneswahrnehmung. Leipzig, Germany: C. F. Winter’sche Verlagshandlung.
    1. Baumgartner H, Steenkamp J-BEM. 2001. Response styles in marketing research: a cross-national investigation. J. Marketing Res. 38, 143–156. (doi:10.1509/jmkr.38.2.143.18840) - DOI

LinkOut - more resources