. 2016 May 4;5(2):150-64.
doi: 10.5492/wjccm.v5.i2.150.

Cost effectiveness of intensive care in a low resource setting: A prospective cohort of medical critically ill patients

Affiliations

Cost effectiveness of intensive care in a low resource setting: A prospective cohort of medical critically ill patients

Hajrunisa Cubro et al. World J Crit Care Med. .

Abstract

Aim: To calculate cost effectiveness of the treatment of critically ill patients in a medical intensive care unit (ICU) of a middle income country with limited access to ICU resources.

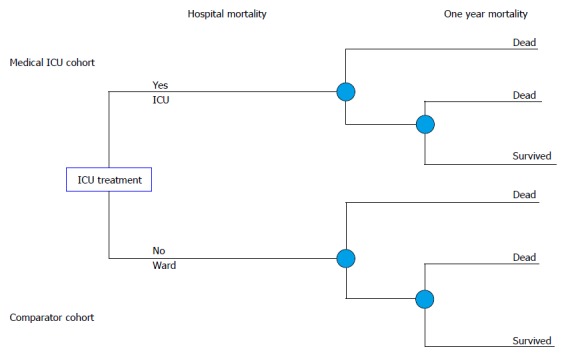
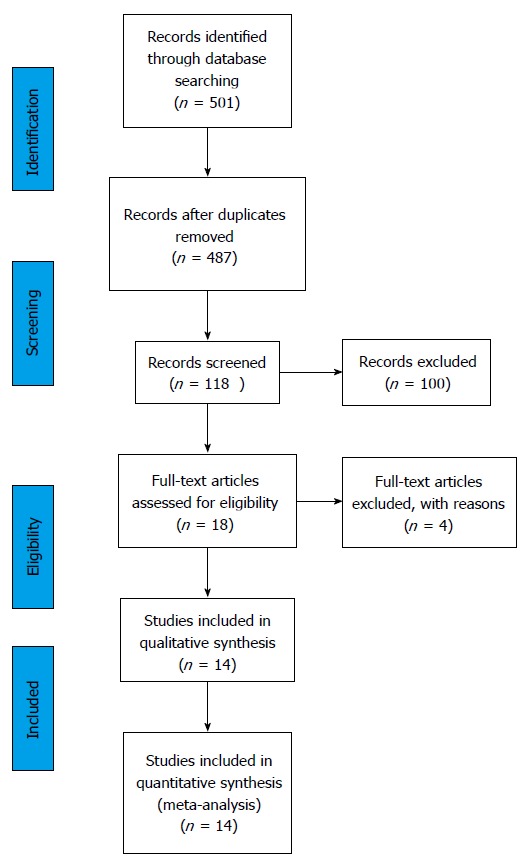
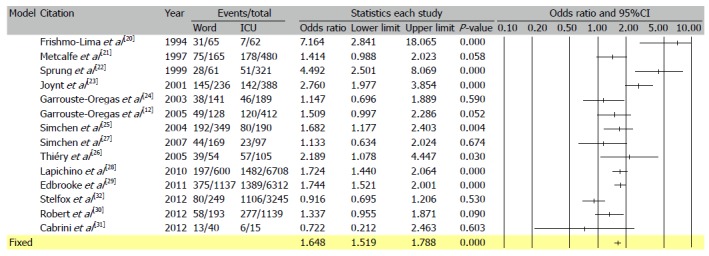
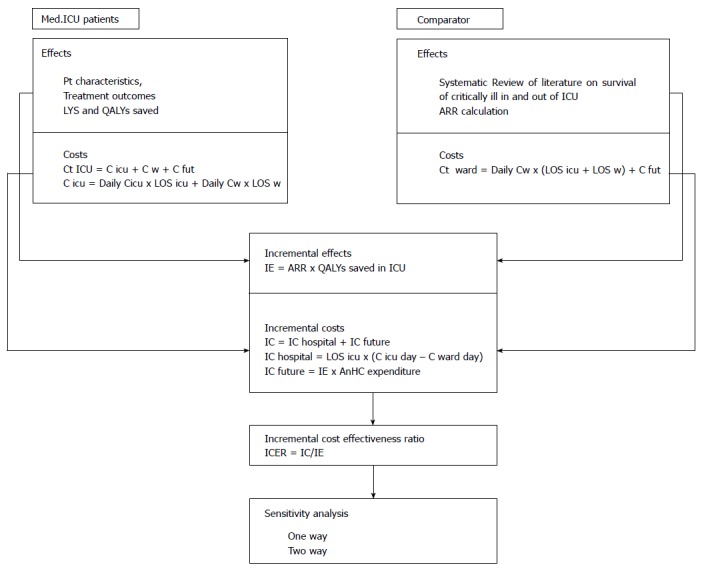
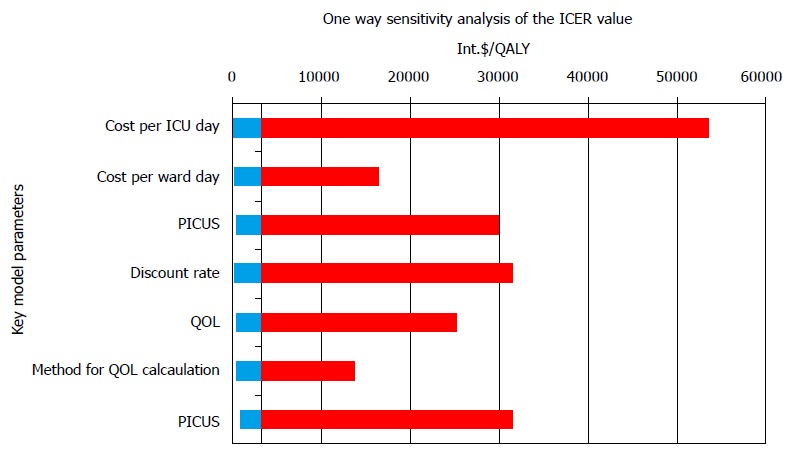
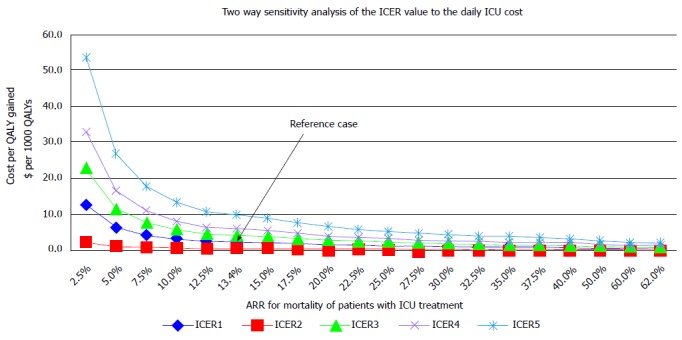
Methods: A prospective cohort study and economic evaluation of consecutive patients treated in a recently established medical ICU in Sarajevo, Bosnia and Herzegovina. A cost utility analysis of the intensive care of critically ill patients compared to the hospital ward treatment from the perspective of the health care system was subsequently performed. Incremental cost effectiveness was calculated using estimates of ICU vs non-ICU treatment effectiveness based on a formal systematic review of published studies. Decision analytic modeling was used to compare treatment alternatives. Sensitivity analyses of the key model parameters were performed.

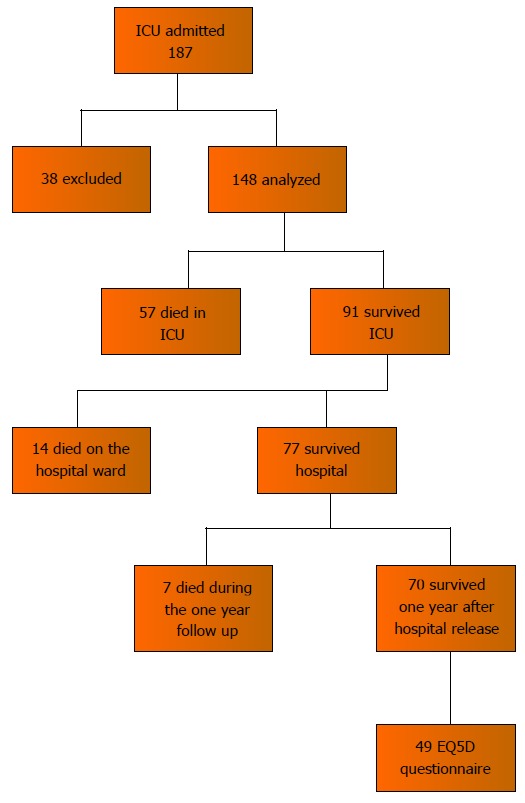
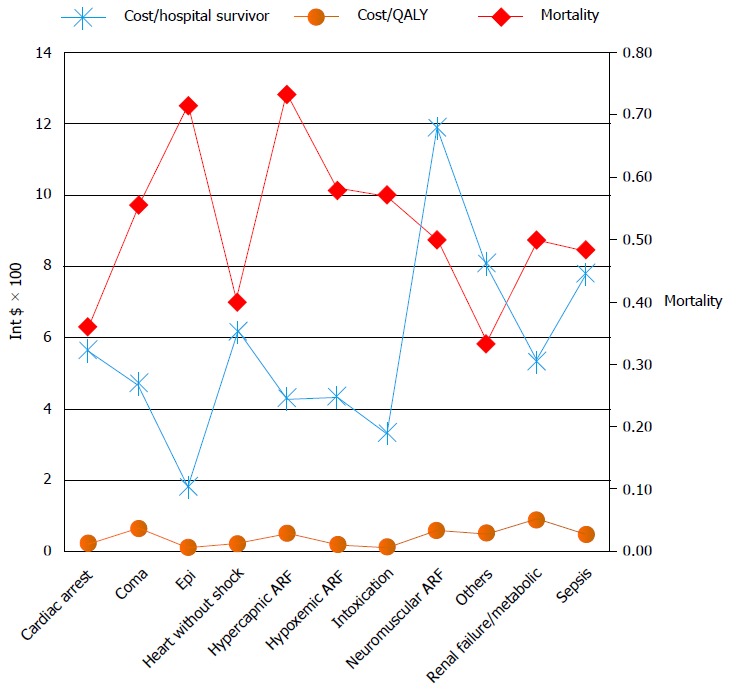
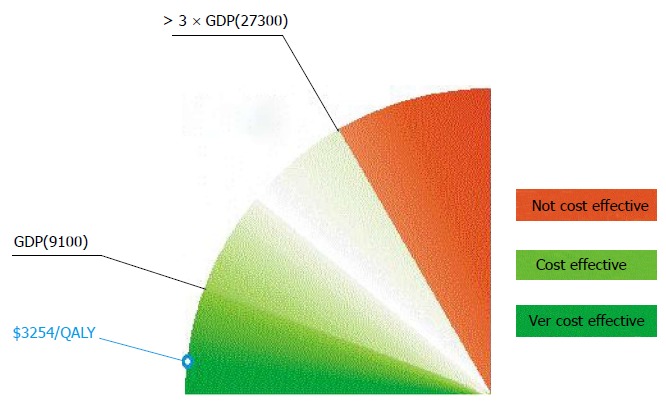
Results: Out of 148 patients, seventy patients (47.2%) survived to one year after critical illness with a median quality of life index 0.64 [interquartile range(IQR) 0.49-0.76]. Median number of life years gained per patient was 30 (IQR 16-40) or 18 quality adjusted life years (QALYs) (IQR 7-28). The cost of treatment of critically ill patients varied between 1820 dollar and 20109 dollar per hospital survivor and between 100 dollar and 2514 dollar per QALY saved. Mean factors that influenced costs were: Age, diagnostic category, ICU and hospital length of stay and number and type of diagnostic and therapeutic interventions. The incremental cost effectiveness ratio for ICU treatment was estimated at 3254 dollar per QALY corresponding to 35% of per capita GDP or a Very Cost Effective category according to World Health Organization criteria.

Conclusion: The ICU treatment of critically ill medical patients in a resource poor country is cost effective and compares favorably with other medical interventions. Public health authorities in low and middle income countries should encourage development of critical care services.

Keywords: Cost benefit analysis; Decision analysis; Economics; Intensive care; Intensive care unit; Mortality; Quality of life.


Figures

Figure 1
Figure 1
The decision tree in the decision analysis. Two branches of the decision tree represent two cohorts of critically ill patients. First one is represented with the patients that were treated in the medical ICU. The other branch represents comparator model of the same patients and shows the treatment outcomes if patients were treated on the hospital ward instead of the ICU. data on treatment outcomes for the comparator were extracted from the systemetic review of the literature. ICU: Intensive care unit.
Figure 2
Figure 2
The Preferred Reporting Items for Systematic Reviews and Meta-analyses flow diagram. The information flow in the different phases of the systematic review is presented. The first search through the data bases returned 501 studies, or 487 after the duplicates were removed. A total of 118 studies were screened based on the abstract and title and 18 full text articles were reviewed. Among them 14 studies were included in the meta-analysis.
Figure 3
Figure 3
Meta-analysis of unadjusted mortality rates from the 14 studies reporting mortality rates in patients admitted to and refused intensive care unit. Based on the reported international data odds ratio for mortality of critically ill patients when treated outside of intensive care unit on standard care wards was calculated, OR = 1.64, 95%CI: 1.51-1.78.
Figure 4
Figure 4
Overview of methodology used in the study. The first phase was data collection for two patient cohorts, observed medical ICU patients and comparator cohort, which was represented by the same number of critically ill patients, with the same characteristics who would be treated on general hospital ward. Costs and treatment outcomes (effects) were recorded and calculated. In the second phase incremental analysis of costs and effects was done. The third phase gave the main incremental cost effectiveness ratio and in fourth a sensitivity analysis of cost effectiveness ratio to key model parameters was performed. Costs and effects were discounted at an annual rate of 3%. LYS: Life years saved; QALY: Quality adjusted life years; ARR: Attributable risk reduction for mortality with treatment of critically ill in ICU; Ct: Total costs; C icu: Costs of ICU treatment; C w: Costs of ward treatment; C fut: Future health care costs, after hospital release; Daily C icu: Average cost per ICU day; Daily C w: Average cost per general hospital ward day in internal medical department; LOS icu/w: Length of stay in the ICU or on general ward; IE: Incremental effects; IC: Incremental costs; AnHC expenditure: Annual health care expenditure per capita for Bosnia and Herzegovina; ICER: Incremental cost-effectiveness ratio. ICU: Intensive care unit.
Figure 5
Figure 5
Patient flow diagram. Out of 148 patients that were included in the study, 57 (38.5%) died in the ICU, 14 (9.4%) died on the hospital wards after the ICU, 7 (4.7%) died during one year follow up, 70 (47.2%) survived one year after hospital release and 49 were interviewed for the health related quality of life assessment using the EuroQol-5D questionnaire. ICU: Intensive care unit.
Figure 6
Figure 6
Cost effectiveness measures (costs per hospital survivor, costs per quality adjusted life year saved by the hospital treatment) and hospital mortality, presented depending on the diagnostic category. The highest mortality had patients admitted for the treatment of status epilepticus, hypercapnic acute respiratory failure, acute renal failure and sepsis. The highest costs were with the neuromuscular ARF and the sepsis diagnostic category. ARF: Acute respiratory failure; QALY: Quality adjusted life year.
Figure 7
Figure 7
Variations of incremental cost effectiveness ratio values in the one way sensitivity analysis. The values are given in International dollar. The highest variations in ICER values and consequently the impact on ICER values had cost per ICU day, followed with post ICU survival rate and discount rate. ICU: Intensive care unit; PICUS: Post ICU survival; QOL: Quality of life; ICER: Incremental cost effectiveness ratio.
Figure 8
Figure 8
The two way sensitivity analysis. Horizontal axis represents different values of the ARR. Vertical axis-values of ICER when cost per ICU day and ARR change: ICER 1 - daily ICU cost 193 dollar, ICER 2 - daily ICU cost 96.5 dollar (50% of reference cost), ICER 3 - daily ICU cost 289.5 (150% of reference cost), ICER 4 - daily ICU cost 386 dollar (200% of reference cost), ICER 5 - daily ICU cost 579 dollar (300% of reference cost). Reference case, the ICER of 3254 dollar/ QALY when cost per ICU day is 193 dollar and ARR are value of 13.4. ICER: Incremental cost effectiveness ratio; ICU: Intensive care unit; QALY: Quality adjusted life year; ARR: Attributable mortality risk reduction.
Figure 9
Figure 9
The World Health Organization interpretation of the cost effectiveness of health care interventions. The WHO interprets the cost effectiveness of a health care intervention in relation to the country’s economic development represented by the GDP per capita. If the value of ICER is less than country’s GDP per capita, then the intervention is very cost effective. If the value of ICER falls between one and three times GDP per capita, then the intervention is cost effective and if the ICER is more than three times GDP per capita, the intervention is considered not cost effective. WHO: World Health Organization; GDP: Gross domestic product; ICER: Incremental cost effectiveness ratio.

References

    1. Russel LB, Siegel JE, Daniels N, Gold MR, Luce BR, Mandelblatt JS. Cost-effectiveness analysis as a guide to resource allocation in health: roles and limitations. In: Gold MR, Siegel JE, Russel LB, Weinstein MC. Cost-Effectiveness in Health and Medicine. Oxford University Press; 1996. pp. 3–24.
    1. Weinstein MC, Stason WB. Foundations of cost-effectiveness analysis for health and medical practices. N Engl J Med. 1977;296:716–721. - PubMed
    1. Basic types of economic evaluation. In: Drummond MF, Sculpher MJ, Torrance GW, O¡¯Brien BJ, Stoddart GL. Methods for the Economic Evaluation of Health Care Programmes. Oxford University Press, 2005: 7-26
    1. Cost Effectiveness Analysis: Introduction. CDC Econ Eval Tutorials (E). [updated 2013 Nov 22] Available from: http//www.cdc.gov/owcd/eet/costeffect2/fixed/1.html.
    1. Sukcharoen N. Basic Principles of Health Economics for Obstetricians and Gynecologists. Thai J Obstet Gynaecol. 2003;15:3–7.

LinkOut - more resources