. 2016 Apr 15;2(4):e1500465.
doi: 10.1126/sciadv.1500465. eCollection 2016 Apr.

Shape remodeling and blebbing of active cytoskeletal vesicles

Affiliations

Shape remodeling and blebbing of active cytoskeletal vesicles

Etienne Loiseau et al. Sci Adv. .

Abstract

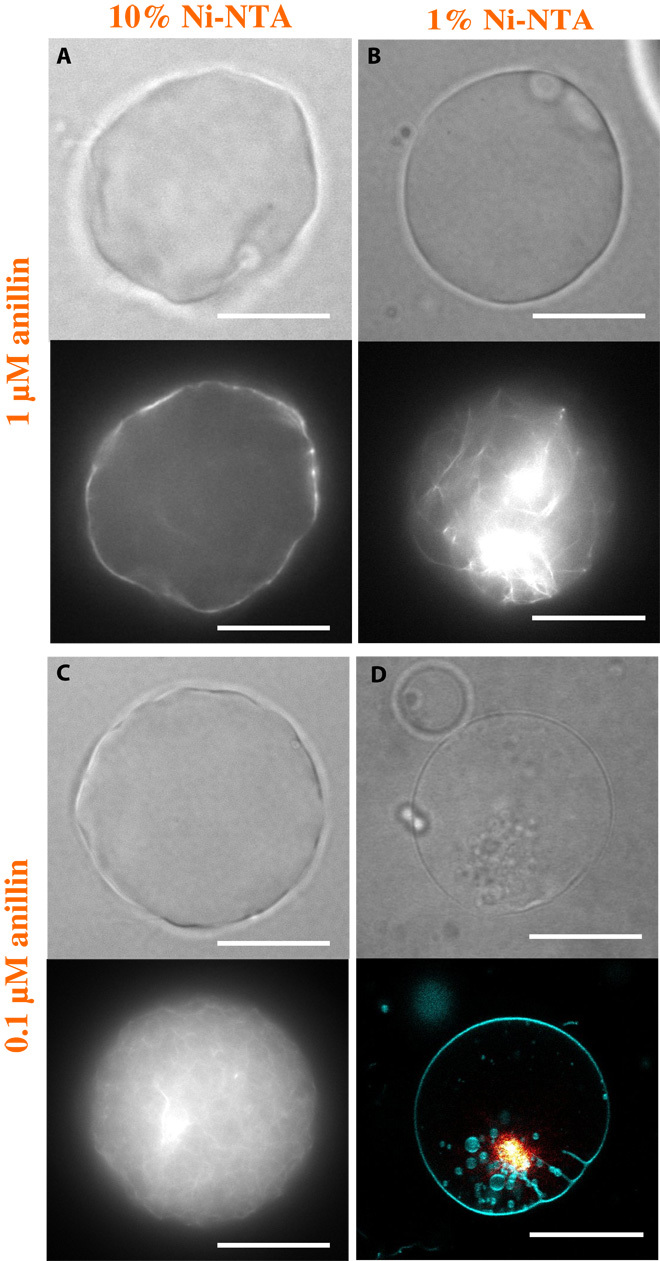
Morphological transformations of living cells, such as shape adaptation to external stimuli, blebbing, invagination, or tethering, result from an intricate interplay between the plasma membrane and its underlying cytoskeleton, where molecular motors generate forces. Cellular complexity defies a clear identification of the competing processes that lead to such a rich phenomenology. In a synthetic biology approach, designing a cell-like model assembled from a minimal set of purified building blocks would allow the control of all relevant parameters. We reconstruct actomyosin vesicles in which the coupling of the cytoskeleton to the membrane, the topology of the cytoskeletal network, and the contractile activity can all be precisely controlled and tuned. We demonstrate that tension generation of an encapsulated active actomyosin network suffices for global shape transformation of cell-sized lipid vesicles, which are reminiscent of morphological adaptations in living cells. The observed polymorphism of our cell-like model, such as blebbing, tether extrusion, or faceted shapes, can be qualitatively explained by the protein concentration dependencies and a force balance, taking into account the membrane tension, the density of anchoring points between the membrane and the actin network, and the forces exerted by molecular motors in the actin network. The identification of the physical mechanisms for shape transformations of active cytoskeletal vesicles sets a conceptual and quantitative benchmark for the further exploration of the adaptation mechanisms of cells.

Keywords: Active matter; actin networks; active cytoskeletal systems; biomimetic system; shape remodeling.


Figures

Fig. 1
Fig. 1. Reconstruction of a cytoskeleton inside vesicles.
(A) The lipid membrane contains a fraction of functionalized lipid with a Ni-NTA group. Elementary building blocks encapsulated in the vesicle consist of actin, a polyhistidine-tagged anillin cross-linker, and myosin II molecular motors. The self-organization of these bricks results in the formation of an active cytoskeletal network coupled to the lipid membrane. In the network, the myosin produces a stress σ, which is transduced to the membrane via the Ni-NTA lipid/His-anillin links. Pulling on the membrane leads to the generation of an internal overpressure, Δp, and, hence, an increase of the membrane tension. (B) Three-dimensional network coupled to the membrane (10 μM actin, 0.5 μM anillin, and 0.1% Ni-NTA lipid). (C) Intensity profile of the actin network along one diameter of the vesicle [dashed line in (B)]. a.u., arbitrary units. (D) Increasing the Ni-NTA from 0.1% to successively 1 and 10% favors the recruitment of anillin at the membrane. The bulk is depleted in anillin, which leads to thinner bundles. (E) At 10% Ni-NTA lipids, increasing the anillin concentration from 0.1 to 0.5 and 1 μM leads to a transition from a 3D network (0.1 and 0.5 μM) to a 2D cortex-like cytoskeleton (1 μM). (F) A 2D cortex-like structure is obtained for 10 μM actin, 1 μM anillin, and 10% Ni-NTA lipid. A confocal picture of the equatorial plane is shown. (G) Size distribution of the areas with a lower membrane/cortex anchoring. The size of the areas with a fluorescence intensity lower than the average intensity is extracted from the actin intensity profile plotted along the circumference of the cortex. An example of such a profile is given in the inset. (H) The intensity profile of the actin along one diameter [dashed line in (F)] of the vesicle. The two peaks show that actin is recruited at the membrane to form a 2D cortex, but some cytoskeletal material remains in the bulk of the vesicle. (I) Vesicle with a 2D cortex, 10 μM actin, 1.5 μM anillin, and 10% Ni-NTA lipid. (J) Heterogeneities in the cortex are characterized the same way as in (G). The higher anillin concentration favors the recruitment of actin at the membrane, and the heterogeneities are smaller. Scale bars, 20 μm.
Fig. 2
Fig. 2. Stability of single-bleb vesicles containing 1 μM myosin.
(A) At an anillin/myosin concentration of 0.2:1, we observe the formation of a single bleb that remains stable overtime. The internal overpressure is not strong enough to globally disrupt the coupling to the membrane. (B to E) Upon decreasing the number of membrane/cytoskeleton links (0.1:1, anillin/myosin), the contraction of the actomyosin network decreases the neck of the bleb (B) and the membrane/cytoskeleton links rupture until the vesicle recovers a spherical shape (C to E). Scale bars, 20 μm. d, diameter of the bleb; R0, radius of the spherical vesicle.
Fig. 3
Fig. 3. Cortex heterogeneities lead to blebbing vesicles with a 2D cortex-like structure.
(A and B) Two examples of blebbing vesicles at high anillin and myosin concentration (1 μM anillin/1 μM myosin; 10% Ni-NTA). Bright-field images are shown on the left, and their corresponding epifluorescence images are shown on the right. Scale bars, 20 μm. (C) Distribution of the number of blebs observed per vesicle, for the experimental conditions detailed above. (D) Size distribution of the small blebs.
Fig. 4
Fig. 4. Morphologies of active vesicles containing 0.5 μM myosin.
(A) Faceted vesicle with a 2D cortex. (B) Decreasing the amount of Ni-NTA lipids in the membrane down to 1% leads to the collapse of the 2D cortex. (C) At low anillin concentrations, faceted vesicles contain a 3D network. (D) At a lower Ni-NTA percentage, while contracting, the actomyosin extrudes tethers inward the vesicle. The membrane is labeled with 0.1% Texas Red 1,2-dihexadecanoyl-sn-glycero-3-phosphoethanolamine, triethylammonium salt (DHPE) lipid. Vesicles are imaged in bright field and epifluorescence in (A) to (C). A confocal image at the equatorial plane is presented in (D). Scale bars, 20 μm.
Fig. 5
Fig. 5. Experimental phase diagram.
(A and B) Internal overpressure from the actomyosin contraction results in blebs, once it overcomes the membrane/cytoskeleton binding force. We observe this regime for a myosin concentration of 1 μM and an anillin concentration lower than 1 μM. At 1 μm anillin (C), blebbing results from local heterogeneities of actin/membrane anchoring in the cortex. Blebbing can be inhibited either by increasing the density of membrane/cytoskeleton linkers [transition from (C) to (D)] or by lowering the myosin concentration to 0.5 μM [transition from (A) to (F) and from (C) to (E)]. Yet, the stress generated by the myosin contraction is strong enough to deform the vesicles. (G and H) In the absence of myosin, the vesicles remain spherical. Each experimental point results from three to five independent experiments, with up to 60 vesicles. Corresponding fluorescent images of the actin networks can be found in fig. S7. Interlinker distances are summarized in table S1. Scale bars, 20 μm.

References

    1. Le Clainche C., Carlier M.-F., Regulation of actin assembly associated with protrusion and adhesion in cell migration. Physiol. Rev. 88, 489–513 (2008). - PubMed
    1. Lecuit T., Lenne P.-F., Munro E., Force generation, transmission, and integration during cell and tissue morphogenesis. Annu. Rev. Cell Dev. Biol. 27, 157–184 (2011). - PubMed
    1. Charras G., Paluch E., Blebs lead the way: How to migrate without lamellipodia. Nat. Rev. Mol. Cell Biol. 9, 730–736 (2008). - PubMed
    1. Döbereiner H.-G., Evans E., Kraus M., Seifert U., Wortis M., Mapping vesicle shapes into the phase diagram: A comparison of experiment and theory. Phys. Rev. E 55, 4458–4474 (1997).
    1. Berndl K., Käs J., Lipowsky R., Sackmann E., Seifert U., Shape transformations of giant vesicles: Extreme sensitivity to bilayer asymmetry. Europhys. Lett. 13, 659 (1990).

Publication types

LinkOut - more resources