

Stochastic Assembly of Bacteria in Microwell Arrays Reveals the Importance of Confinement in Community Development
- PMID: 27152511
- PMCID: PMC4859483
- DOI: 10.1371/journal.pone.0155080
Stochastic Assembly of Bacteria in Microwell Arrays Reveals the Importance of Confinement in Community Development
Erratum in
-
Correction: Stochastic Assembly of Bacteria in Microwell Arrays Reveals the Importance of Confinement in Community Development.PLoS One. 2016 Jul 21;11(7):e0160135. doi: 10.1371/journal.pone.0160135. eCollection 2016. PLoS One. 2016. PMID: 27441627 Free PMC article.
Abstract
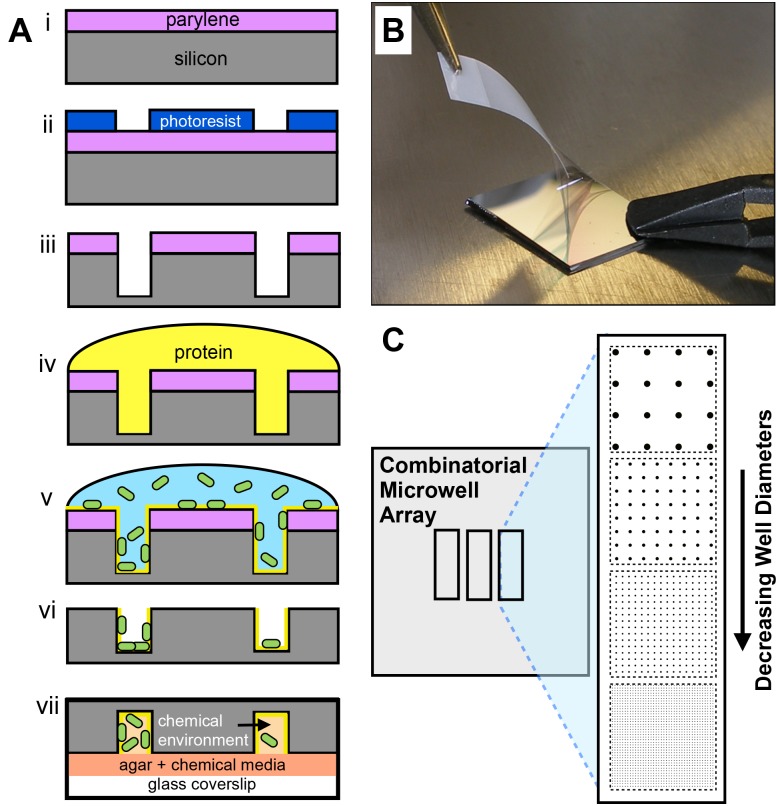
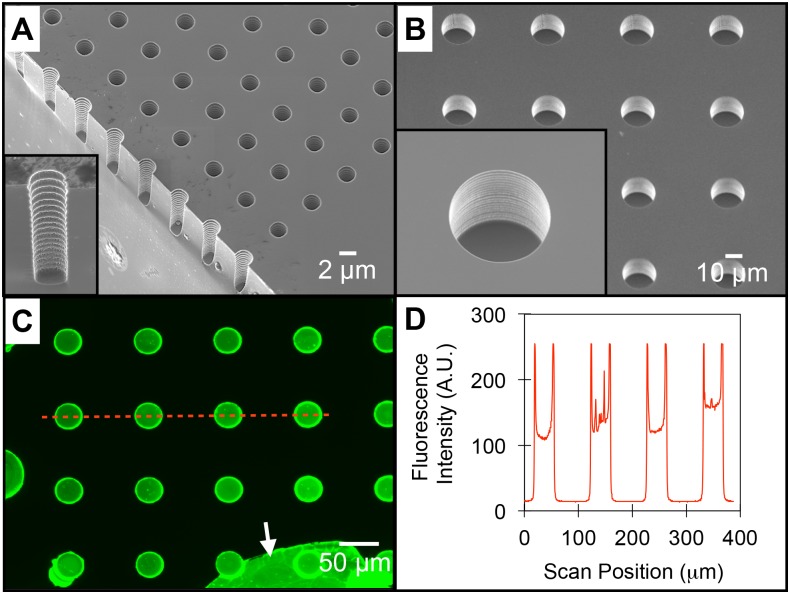
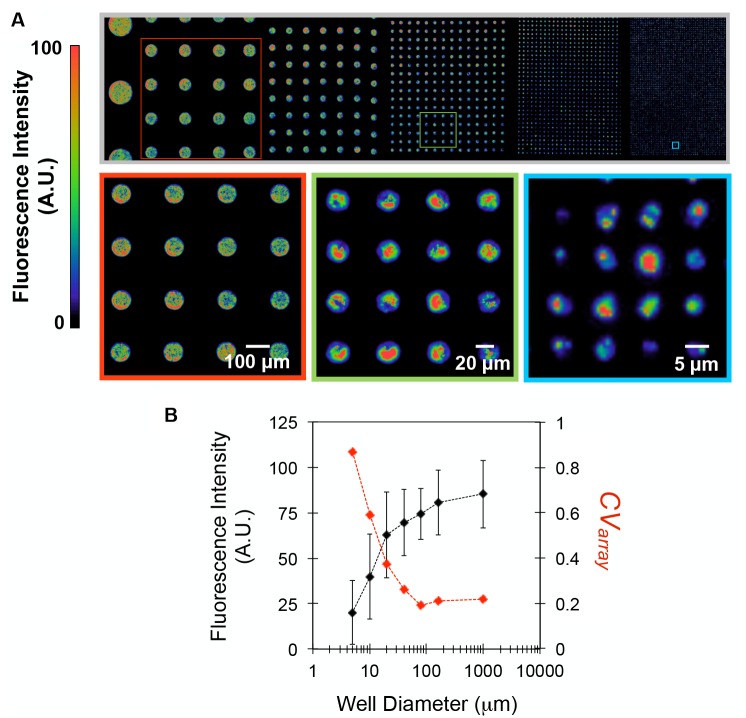
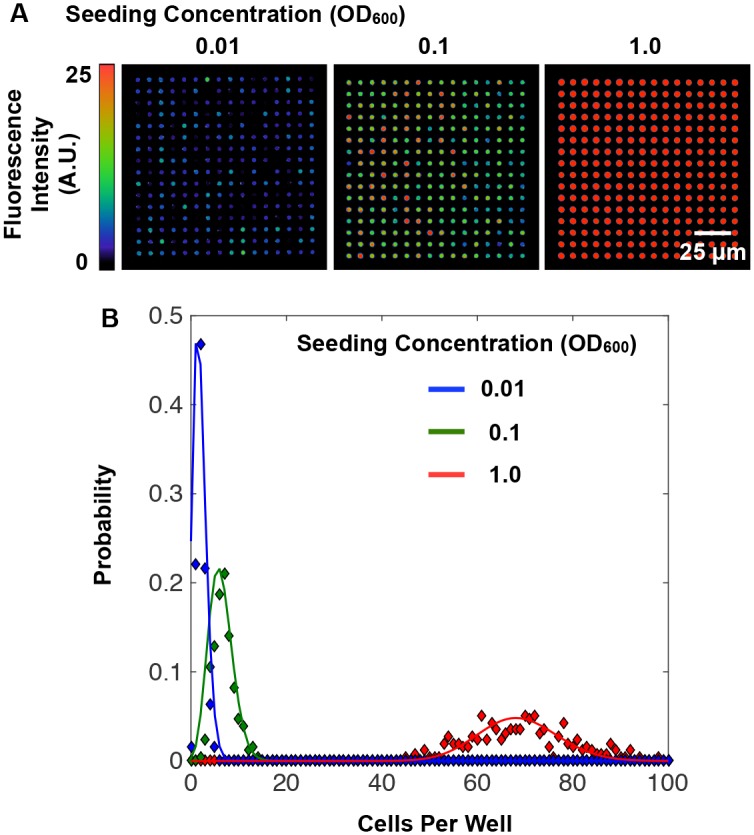
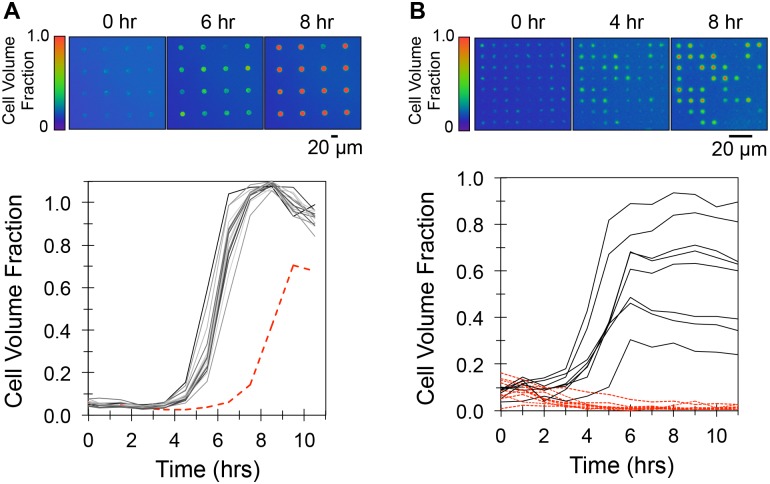
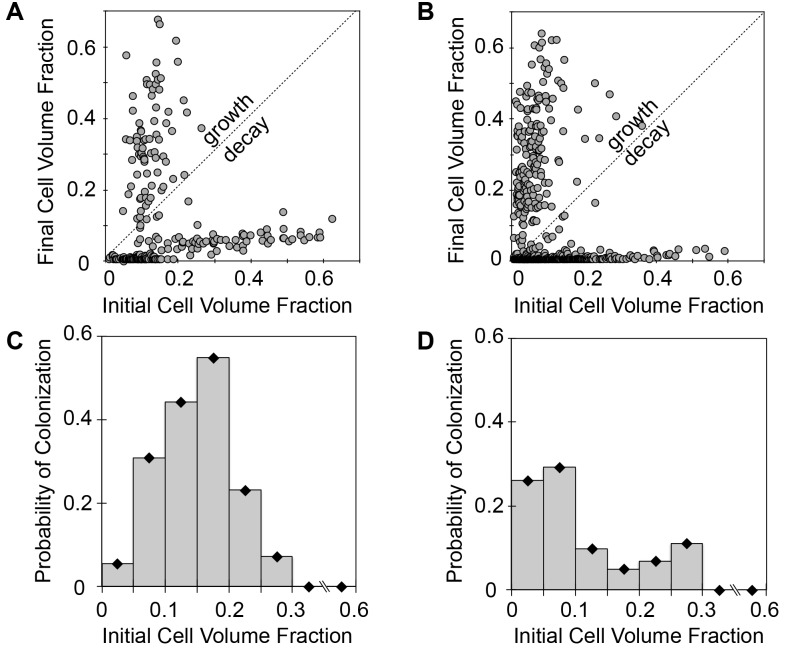
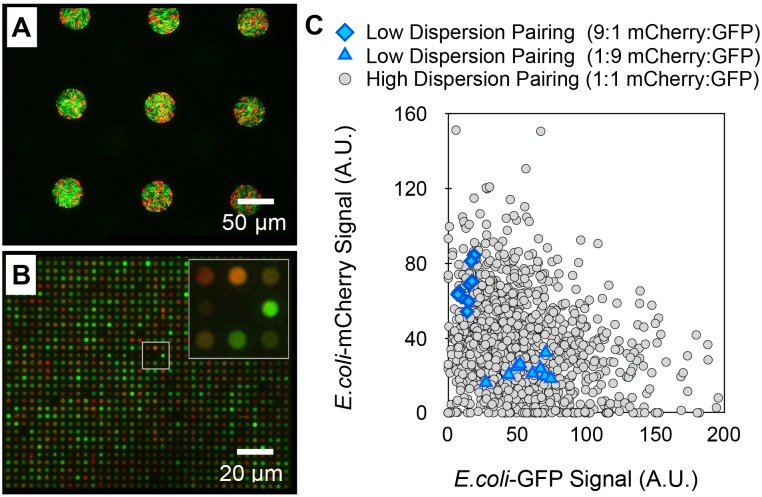
The structure and function of microbial communities is deeply influenced by the physical and chemical architecture of the local microenvironment and the abundance of its community members. The complexity of this natural parameter space has made characterization of the key drivers of community development difficult. In order to facilitate these characterizations, we have developed a microwell platform designed to screen microbial growth and interactions across a wide variety of physical and initial conditions. Assembly of microbial communities into microwells was achieved using a novel biofabrication method that exploits well feature sizes for control of innoculum levels. Wells with incrementally smaller size features created populations with increasingly larger variations in inoculum levels. This allowed for reproducible growth measurement in large (20 μm diameter) wells, and screening for favorable growth conditions in small (5, 10 μm diameter) wells. We demonstrate the utility of this approach for screening and discovery using 5 μm wells to assemble P. aeruginosa colonies across a broad distribution of innoculum levels, and identify those conditions that promote the highest probability of survivial and growth under spatial confinement. Multi-member community assembly was also characterized to demonstrate the broad potential of this platform for studying the role of member abundance on microbial competition, mutualism and community succession.
Conflict of interest statement
Figures
Similar articles
-
Assembly and Tracking of Microbial Community Development within a Microwell Array Platform.J Vis Exp. 2017 Jun 6;(124):55701. doi: 10.3791/55701. J Vis Exp. 2017. PMID: 28654053 Free PMC article.
-
A Microfluidics and Agent-Based Modeling Framework for Investigating Spatial Organization in Bacterial Colonies: The Case of Pseudomonas Aeruginosa and H1-Type VI Secretion Interactions.Front Microbiol. 2018 Feb 6;9:33. doi: 10.3389/fmicb.2018.00033. eCollection 2018. Front Microbiol. 2018. PMID: 29467721 Free PMC article.
-
On Demand Release and Retrieval of Bacteria from Microwell Arrays Using Photodegradable Hydrogel Membranes.ACS Appl Bio Mater. 2019 Jan 22;2(1):266-276. doi: 10.1021/acsabm.8b00592. Epub 2019 Jan 4. ACS Appl Bio Mater. 2019. PMID: 35016349
-
Microbial communities and their interactions in biofilm systems: an overview.Water Sci Technol. 2004;49(11-12):327-36. Water Sci Technol. 2004. PMID: 15303758 Review.
-
Upflow anaerobic sludge blanket reactor--a review.Indian J Environ Health. 2001 Apr;43(2):1-82. Indian J Environ Health. 2001. PMID: 12397675 Review.
Cited by
-
Low-cost gel-filled microwell array device for screening marine microbial consortium.Front Microbiol. 2022 Dec 16;13:1031439. doi: 10.3389/fmicb.2022.1031439. eCollection 2022. Front Microbiol. 2022. PMID: 36590440 Free PMC article.
-
Microfluidic devices for studying bacterial taxis, drug testing and biofilm formation.Microb Biotechnol. 2022 Feb;15(2):395-414. doi: 10.1111/1751-7915.13775. Epub 2021 Mar 1. Microb Biotechnol. 2022. PMID: 33645897 Free PMC article. Review.
-
Video frame prediction of microbial growth with a recurrent neural network.Front Microbiol. 2023 Jan 5;13:1034586. doi: 10.3389/fmicb.2022.1034586. eCollection 2022. Front Microbiol. 2023. PMID: 36687639 Free PMC article.
-
A Review of Capillary Pressure Control Valves in Microfluidics.Biosensors (Basel). 2021 Oct 19;11(10):405. doi: 10.3390/bios11100405. Biosensors (Basel). 2021. PMID: 34677361 Free PMC article. Review.
-
Habitat fragmentation enhances microbial collective defence.J R Soc Interface. 2025 Feb;22(223):20240611. doi: 10.1098/rsif.2024.0611. Epub 2025 Feb 12. J R Soc Interface. 2025. PMID: 39933594 Free PMC article.
References
MeSH terms
LinkOut - more resources
Full Text Sources
Other Literature Sources
