. 2016 May 6;11(5):e0153594.
doi: 10.1371/journal.pone.0153594. eCollection 2016.

Association between Insulin Monotherapy versus Insulin plus Metformin and the Risk of All-Cause Mortality and Other Serious Outcomes: A Retrospective Cohort Study

Affiliations

Association between Insulin Monotherapy versus Insulin plus Metformin and the Risk of All-Cause Mortality and Other Serious Outcomes: A Retrospective Cohort Study

Sarah E Holden et al. PLoS One. .

Abstract

Aims: To determine if concomitant metformin reduced the risk of death, major adverse cardiac events (MACE), and cancer in people with type 2 diabetes treated with insulin.

Methods: For this retrospective cohort study, people with type 2 diabetes who progressed to insulin with or without metformin from 2000 onwards were identified from the UK Clinical Practice Research Datalink (≈7% sample of the UK population). The risks of all-cause mortality, MACE and incident cancer were evaluated using multivariable Cox models comparing insulin monotherapy with insulin plus metformin. We accounted for insulin dose.

Results: 12,020 subjects treated with insulin were identified, including 6,484 treated with monotherapy. There were 1,486 deaths, 579 MACE (excluding those with a history of large vessel disease), and 680 cancer events (excluding those in patients with a history of cancer). Corresponding event rates were 41.5 (95% CI 39.4-43.6) deaths, 20.8 (19.2-22.5) MACE, and 21.6 (20.0-23.3) cancer events per 1,000 person-years. The adjusted hazard ratios (aHRs) for people prescribed insulin plus metformin versus insulin monotherapy were 0.60 (95% CI 0.52-0.68) for all-cause mortality, 0.75 (0.62-0.91) for MACE, and 0.96 (0.80-1.15) for cancer. For patients who were propensity-score matched, the corresponding aHRs for all-cause mortality and cancer were 0.62 (0.52-0.75) and 0.99 (0.78-1.26), respectively. For MACE, the aHR was 1.06 (0.75-1.49) prior to 1,275 days and 1.87 (1.22-2.86) after 1,275 days post-index.

Conclusions: People with type 2 diabetes treated with insulin plus concomitant metformin had a reduced risk of death and MACE compared with people treated with insulin monotherapy. There was no statistically significant difference in the risk of cancer between people treated with insulin as monotherapy or in combination with metformin.


Conflict of interest statement

Competing Interests: C. J. C. is a director of and S. E. H. and S. J-J. are employed by Pharmatelligence, a research consultancy that receives funding from various pharmaceutical companies and other healthcare related organisations. S. E. H. received a fully funded PhD studentship from Cardiff University. This does not alter the authors' adherence to PLOS ONE policies on sharing data and materials. However, as data for this study were obtained from the Clinical Practice Research Datalink some restrictions will apply. This dataset is not the property of the authors and is only available under licence from the United Kingdom Medicines and Healthcare Products Regulatory Agency. Full details are available at: http://www.cprd.com <http://www.cprd.com/>.

Figures

Fig 1
Fig 1. Reasons for censorship.
Censorship crieria were applied in the order shown in the key below'.
Fig 2
Fig 2. Kaplan–Meier and adjusted survival curves comparing insulin monotherapy and insulin plus metformin for all-cause mortality (a and b), MACE (c and d), and cancer (e and f).
Blue = insulin monotherapy, green = insulin plus metformin. Time zero refers to index date plus 180 days. For the adjusted survival curves, a non-time-dependent Cox model was used, where insulin dose was modelled as the mean value for the follow-up period. The proportional hazards assumption was violated for history of cancer (all-cause mortality), history of receiving antihypertensive therapy (all-cause mortality), and serum creatinine (cancer).
Fig 3
Fig 3. Adjusted hazard ratios for all-cause mortality for insulin plus metformin compared with insulin monotherapy.
Notes: Final model specification: estimated cumulative insulin dose, therapy (±metformin), HbA1c, BMI, diabetes duration, index year, insulin regimen, smoking status, serum creatinine, prior cancer, prior large vessel disease, prior lipid-lowering therapy, prior anti-hypertensive therapy, prior anti-platelet therapy, prior GP contacts, Charlson comorbidity index, gender, and age at index. Insulin dose (units/kg/day) was added as a cumulative dose as an annually updated, time-dependent covariate. Baseline values were used for the remaining covariates as defined in the Statistical Methods section. Prior anti-hypertensive therapy and history of cancer violated the proportional hazards assumption of the Cox model and so were added as Heaviside functions (<1,095 and ≥1,095 days). The covariate used to categorize each subgroup was removed from the model for the respective analysis.
Fig 4
Fig 4. Adjusted hazard ratios for MACE for insulin plus metformin compared with insulin monotherapy.
Notes: Final model specification: insulin exposure, therapy (±metformin), HbA1c, BMI, diabetes duration, index year, insulin regimen, smoking status, serum creatinine, prior cancer, prior lipid-lowering therapy, prior anti-hypertensive therapy, prior anti-platelet therapy, prior GP contacts, Charlson comorbidity index, gender, and age at index. Cumulative mean insulin dose (units/kg/day) was added as an annually updated, time-dependent covariate. Baseline values were used for the remaining covariates as defined in the Statistical Methods section.
Fig 5
Fig 5. Adjusted hazard ratios for cancer for insulin plus metformin compared with insulin monotherapy.
Notes: Final model specification: insulin exposure, therapy (±metformin), HbA1c, BMI, diabetes duration, index year, insulin regimen, smoking status, serum creatinine, prior large vessel disease, prior lipid-lowering therapy, prior anti-hypertensive therapy, prior anti-platelet therapy, prior GP contacts, Charlson comorbidity index, gender, and age at index. Insulin dose (units/kg/day) was added as a cumulative dose as an annually updated, time-dependent covariate. Baseline values were used for the remaining covariates as defined in the Statistical Methods section. Regimen violated the proportional hazards assumption of the Cox model and was therefore added as Heaviside functions (<1,095 and ≥1,095 days).
Fig 6
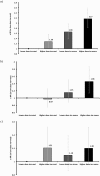
Fig 6. Adjusted hazard ratios for a) all-cause mortality, b) MACE, and c) cancer by lower and higher cumulative insulin dose.
Notes: Model specification: categorical variable comprising insulin exposure and therapy (lower- and higher-dose insulin monotherapy, and lower- and higher-dose insulin plus metformin), HbA1c, BMI, diabetes duration, index year, smoking status, serum creatinine, prior cancer, prior large vessel disease, prior lipid-lowering therapy, prior anti-hypertensive therapy, prior anti-platelet therapy, prior GP contacts, Charlson comorbidity index, gender, insulin regimen, and age at index. The combined insulin exposure and therapy variable was added to the Cox model as an annually updated, time-dependent covariate. Baseline values were used for the remaining covariates as defined in the Statistical Methods section. Lower insulin dose was defined as ≤0.648 units/kg/day and higher dose was defined as >0.648 units/kg/day. For all-cause mortality, prior cancer and prior anti-hypertensives violated the proportional hazards assumption of the Cox model and so were entered as Heaviside functions (≤1,095 and >1,095 days). For cancer, insulin regimen type violated the proportional hazards assumption of the Cox model and so this was added as Heaviside functions (<1,095 and ≥1,095 days).

References

    1. Holden SE, Gale EAM, Jenkins-Jones S, Currie CJ. How many people inject insulin? UK estimates from 1991 to 2010. Diabetes Obes Metab. 2014;16: 533–9. - PubMed
    1. Inzucchi SE, Bergenstal RM, Buse JB, Diamant M, Ferrannini E, Nauck M, et al. Management of hyperglycemia in type 2 diabetes: a patient-centered approach: position statement of the American Diabetes Association (ADA) and the European Association for the Study of Diabetes (EASD). Diabetes Care. 2012;35: 1364–79. 10.2337/dc12-0413 - DOI - PMC - PubMed
    1. Goudswaard AN, Furlong NJ, Valk GD, Stolk RP, Rutten GEHM. Insulin monotherapy versus combinations of insulin with oral hypoglycaemic agents in patients with type 2 diabetes mellitus. Cochrane Database Syst Rev. 2004: CD003418 - PMC - PubMed
    1. Kirpichnikov D, McFarlane SI, Sowers JR. Metformin: an update. Ann Intern Med. 2002;137: 25–33. - PubMed
    1. Beisswenger PJ, Howell SK, Touchette AD, Lal S, Szwergold BS. Methylglyoxal Metformin reduces systemic methylglyoxal levels in type 2 diabetes. Diabetes. 1999;4: 198–202. - PubMed

Publication types