Review
. 2016 Jul 25;45(15):4074-126.
doi: 10.1039/c5cs00287g.

Design of virus-based nanomaterials for medicine, biotechnology, and energy

Affiliations
Review

Design of virus-based nanomaterials for medicine, biotechnology, and energy

Amy M Wen et al. Chem Soc Rev. .

Abstract

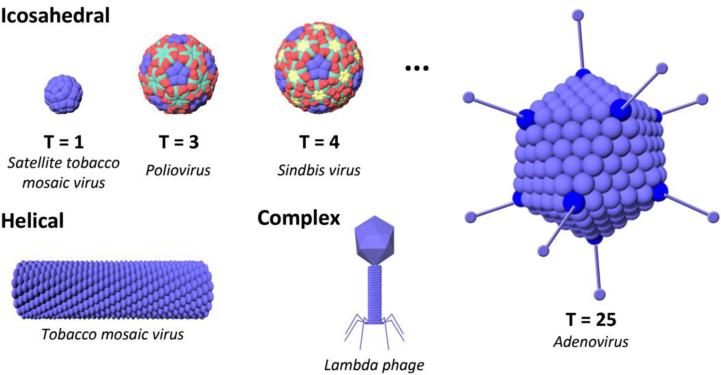
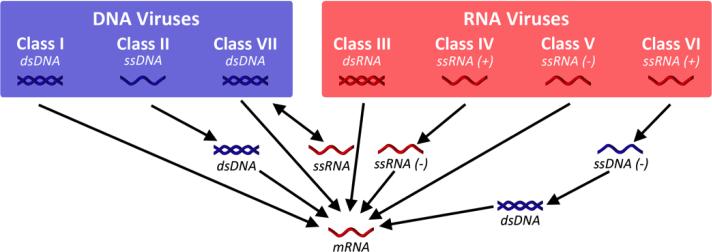
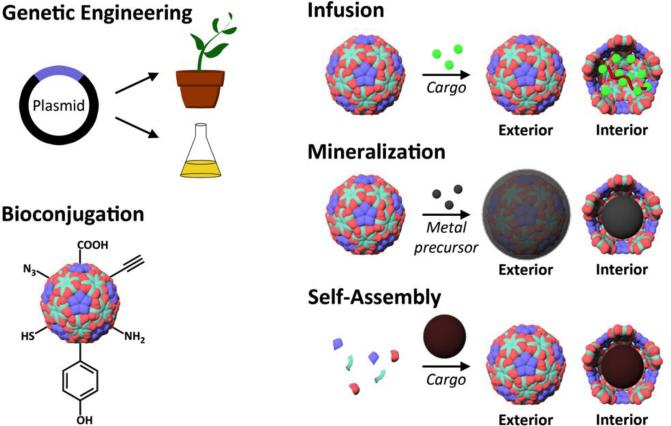
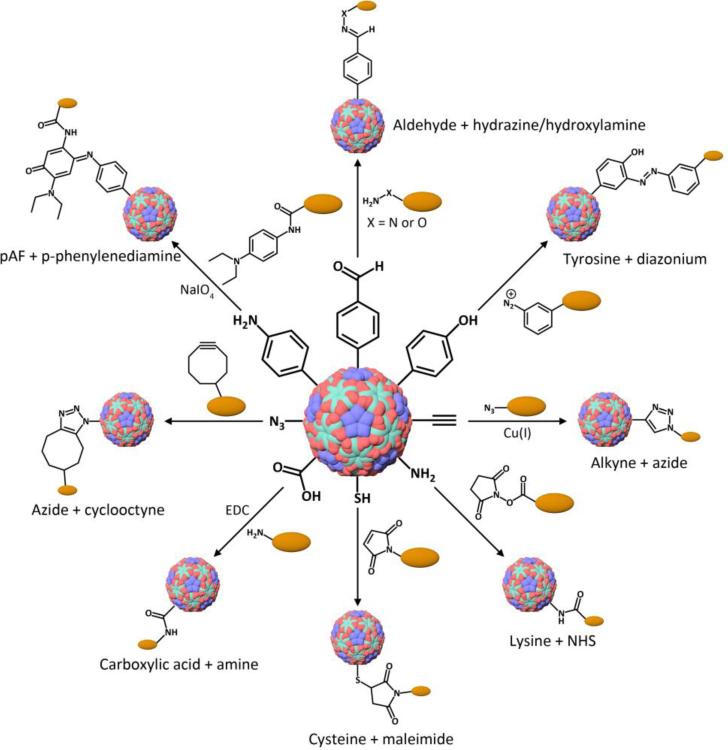
This review provides an overview of recent developments in "chemical virology." Viruses, as materials, provide unique nanoscale scaffolds that have relevance in chemical biology and nanotechnology, with diverse areas of applications. Some fundamental advantages of viruses, compared to synthetically programmed materials, include the highly precise spatial arrangement of their subunits into a diverse array of shapes and sizes and many available avenues for easy and reproducible modification. Here, we will first survey the broad distribution of viruses and various methods for producing virus-based nanoparticles, as well as engineering principles used to impart new functionalities. We will then examine the broad range of applications and implications of virus-based materials, focusing on the medical, biotechnology, and energy sectors. We anticipate that this field will continue to evolve and grow, with exciting new possibilities stemming from advancements in the rational design of virus-based nanomaterials.


Figures

Figure 1
Figure 1. Some common viral architectures
Viruses come in diverse shapes and sizes, with icosahedral and helical symmetries as well as more complex head-to-tail assemblies. For icosahedral viruses, examples of different triangulation numbers are shown (explained in Section 2.1), giving rise to different capsid sizes and structures. An example of a virus for each architecture is given in italics below the figures.
Figure 2
Figure 2. Baltimore classification of viruses
With the Baltimore classification, viruses are classified based on their genomic material as well as their method of replication.
Figure 3
Figure 3. Techniques for modification of virus-based scaffolds
Simplified illustrations show common methods for interior and exterior virus modification. To alter the composition of the protein capsid itself, genetic engineering can be used. With available exposed residues, bioconjugate chemistries can be performed. Through pores in the structure, small cargo can be infused into the capsid and then retained by reducing the pore size or electrostatic interactions. Interactions of metal precursors with the capsid can be used to selectively direct mineralization on the interior or exterior surface. Taking advantage of self-assembly of the viral scaffold, cargo introduced during assembly can be encapsulated.
Figure 4
Figure 4. Bioconjugation reactions that can be used for virus modification
Presented in the figure are some of the more common reactions for functionalization of viruses. Other methods discussed in the text include atom-transfer radical polymerization, ring-opening metathesis polymerization, and supramolecular interactions.
Figure 5
Figure 5. Design parameters to consider for nanoparticle engineering
Parameters include charge (positive or negative), shape and size (different aspect ratio filaments and diameter spheres), shielding (self proteins/peptides and polymers of various sizes and densities), and targeting (ligands for receptors or environmental factors displayed on different linkers and at various densities).
Figure 6
Figure 6. Effect of PEG shielding on PVX clearance
a) Diagram of conformations of PEGs of different lengths and geometries displayed on PVX based on calculations of grafting density and Flory dimension. b) Pharmacokinetics of the various PEGylated particles when injected in Balb/C mice show better shielding of the 5k branched polymer. Reproduced with permission from ref. . Copyright 2015 Elsevier.
Figure 7
Figure 7. Imaging of tumor uptake and distribution of CPMV and PVX
a) Comparison of icosahedral CPMV (green) and filamentous PVX (red) distribution when coinjected in a CAM model of chick embryos prepared with vascularized GFP-expressing human fibrosarcoma HT1080 or human epithelial carcinoma HEp3 tumors (magenta), with PVX better able to penetrate to the tumor core. Scale bar = 190 μm. b) Fluorescence microscopy of 8 μm tumor sections showing CPMV having limited distribution, while PVX is spread throughout the tumor and found in areas devoid of CPMV (white arrowheads). c) Image of tumors from an HT-29 colon cancer mouse xenograft model after intravenous injection of CPMV and PVX particles (left) and quantitation of fluorescence intensity (right). d) Immunofluorescence staining of 10 μm tumor sections showing CPMV (pseudocolored in yellow) remaining close to the endothelium (stained with FITC-labeled CD31 antibody pseudocolored in pink) and PVX (pseudocolored in green) having better tissue penetration properties. Nuclei were stained with DAPI (blue). Scale bars are 30 μm. Reproduced with permission from ref. . Copyright 2012 American Chemical Society.
Figure 8
Figure 8. Targeted MR imaging of prostate cancer with M13
a) Diagram of M13 structure with the major p8 proteins displaying a triglutamate motif for the multivalent display of iron oxide nanocrystals (black circles) and the p3 proteins at the end of the virus displaying SPARC binding peptide (pink) for targeting. b) MR scans of mice using a 7 T small animal MR scanner with subcutaneous C4-2B tumors (encircled) before (left) and 24 hours after (right) M13 injection displayed dark contrast from the targeted particles against the bright image of the tumor. Reproduced with permission from ref. . Copyright 2012 Nature Publishing Group.
Figure 9
Figure 9. Oncolytic virus therapy action and potential synergy
a) Immune clearance of tumors at baseline is inhibited by inactivation of T cells through binding of their programmed cell death protein 1 (PD1) receptor to programmed death ligand 1 (PDL1) expressed on tumor cells as well as by secretion of inhibitory cytokines. b) OV treatment triggers local expression of pro-inflammatory cytokines and/or overrides immune checkpoint inhibition, resulting in immune stimulation and recruitment of immune cells. c) Combination of OV therapy with other immunotherapies such as PDL1 antibodies and chimeric antigen receptor-expressing T cells can be used to enhance immune responses. Reproduced with permission from ref. . Copyright 2015 Nature Publishing Group.
Figure 10
Figure 10. Systemic anti-tumor immunity after in situ vaccination with eCPMV
a) Images of mice with flank B16F10 melanoma tumors three days after intradermal injection of either eCPMV or PBS demonstrate slower growth with eCPMV. b) Tumor measurements of the mice after treatment (arrows indicate treatment days), with significant decrease in tumor progression rate for eCPMV (n = 8 for eCPMV, n = 6 for PBS). c) Kaplan-Meier curves illustrate survival of half the mice treated with eCPMV, with complete elimination of primary tumors observed for those mice. d) Rechallenge on the opposite flank 4 weeks later (n = 4/group) also saw delayed growth for eCPMV, and 3 out of 4 mice did not develop new tumors. *p < 0.05; **p < 0.01; ***p < 0.001. Reproduced with permission from ref. . Copyright 2015 Nature Publishing Group.
Figure 11
Figure 11. Gene delivery to mammalian cells using CCMV plant virus
a) Strategy for delivering DI[EYFP], defective interfering RNA for enhanced yellow fluorescent protein (EYFP) derived from SINV, through cotransfection of CCMV containing the gene with Lipofectamine-2000. b) Flow cytometry analysis of transduction efficiency showing lower efficiency for VLP transduction than naked RNA but the cargo is protected from RNase A. c) Corresponding fluorescence microscopy images (columns are in same order as bar graph) showing EYFP signal due to transduction for all conditions except for naked RNA incubated with RNase A. Reproduced with permission from ref. . Copyright 2013 Elsevier.
Figure 12
Figure 12. FA targeting for specific cell killing with Dox
a) Schematic of formation of HCRSV-based protein cages without (PC-Dox) and with FA conjugation (fPC-Dox) where Dox is encapsulated during capsid reassembly with the inclusion of polyacid. b) Confocal microscopy of Dox uptake for OVCAR-3 ovarian cancer cells and CCL-186 fibroblast cells incubated with free doxorubicin, PC-Dox, fPC-Dox, and fPC-Dox in the presence of FA. c) Cell viability curves of cells after treatment with varying concentrations of the different formulations showing fPC-Dox had greater inhibition of OVCAR-3 cells without affecting pattern of CCL-186 inhibition. Reproduced with permission from ref. . Copyright 2007 American Chemical Society.
Figure 13
Figure 13. 3D printed virus-activated bone scaffold with angiogenesis
a) Schematic of 3D printed bioceramic bone scaffold incorporating negatively charged RGD-labeled phage nanofibers using positively charged chitosan for new bone and blood formation when seeded with MSCs. b) Images of scaffold architecture. Scanning electron microscopy (SEM) of bone scaffold showed macro-scale (1) and micro-scale (2) pores, as well as pores filled with chitosan and phage matrix (5). Atomic force microscopy (AFM) (3) and transmission electron microscopy (TEM) (4) demonstrated morphology of phage nanofibers. 3D confocal fluorescence imaging showed presence of dye-labeled phage (red) within matrix-filled pores (6), and brightfield imaging revealed support of MSC adhesion for both the scaffold pores (7) and columns (8). c) Immunofluorescence staining for endothelial CD31 (1, 3, 5) and hematoxylin and eosin (H&E) staining (2, 4, 6) of implants of negative control (wild-type phage), virus-activated matrix (VAM), and positive control (RGD-phage with VEGF) scaffolds, respectively, as well as quantitative analysis (7) showed VAM promotes angiogenesis at an intermediate level. (**p<0.01). Reproduced with permission from ref. . Copyright 2014 John Wiley & Sons.
Figure 14
Figure 14. Filamentous phage structure
a) Schematic of phage structure showing how the five structural proteins are arranged around its ssDNA genome. b) Legend labeling the structural proteins with approximate values for size, weight, and copies/virion. Reproduced with permission from ref. . Copyright 2011 Løset et al.
Figure 15
Figure 15. Phage display cycle with phagemid
A library of DNA sequences with random variations of the protein of interest (POI) displayed on the pIII coat protein is cloned into a phagemid vector. After transformation of E. coli cells and subsequent infection with helper phages, the phage library is created. Using an immobilized target molecule, rounds of selection and amplification are performed until phages with the highest affinity are isolated. DNA sequencing can be used to identify the phages, and/or directed evolution can be used to create new libraries for panning. Reproduced with permission from ref. . Copyright 2011 Biochemical Society.
Figure 16
Figure 16. Microarrays hybridized with cDNA made from rat total RNA
a) Result from cDNA labeled with Cy5-dCTP control. b) Result from cDNA labeled with biotin-functionalized dCTP and dUTP followed by binding with NeutrAvidin-functionalized CPMV-Cy5. Both strategies resulted in a density of labeling of about one every 50 bases, but the CPMV-based probe resulted in greater sensitivity, detecting 71% of the features compared to 57% for the control. Reproduced with permission from ref. . Copyright 2009 Elsevier.
Figure 17
Figure 17. Example of Armored RNA packaging
Transcribed recombinant RNA, in this case an exogenous HCV-2b consensus sequence, can be packaged within self-assembled MS2 coat proteins. Reproduced with permission from ref. . Copyright 2009 American Association for Clinical Chemistry.
Figure 18
Figure 18. Manufacture of EBOV-TMV
a) EBOV-TMV is manufactured by disassembly of TMV propagated in N. benthamiana plants into individual coat proteins that are then reassembled around synthetic RNA transcripts containing EBOV and TMV gene sequences. b) TEM of negatively-stained wild-type TMV rods. c) TEM of shorter EBOV-TMV rods demonstrating successful reconstitution. Scale bar = 100 nm. Reproduced with permission from ref. . Copyright 2016 Nature Publishing Group.
Figure 19
Figure 19. Encapsulation of enzyme cascade in P22
a) Schematic of P22 nanoreactor assembly where a multienzyme GALK, GLUK, and CelB fusion gene with an additional SP scaffolding domain is encapsulated in the capsid. The expression of the fusion protein allows the enzymes to form the oligomers required for activity (tetramer for CelB, dimer for GLUK). The enzymes are colored green, blue, and red, respectively, for the GALK, GLUK, and CelB fusion, and the CP is shown in gray and SP in purple. b) Illustration of the metabolic pathways of the enzymes and how they are coupled. Reproduced with permission from ref. . Copyright 2014 American Chemical Society.
Figure 20
Figure 20. Quantitative analysis of GFP expression with TRBO vector
Fluorescence (in μg GFP/g infiltrated tissue) was measured from N. benthamiana leaves after agrobacterium infiltration (top). Leaves were also imaged under UV light (bottom). The labels in the figure indicate the plasmids used for transformation, and the results indicate the superior expression of protein with TRBO vector compared to previous expression vectors, even with P19 enhancement. pJL-24 is a previous iteration of a 35S promoter-driven TMV-based expression vector that included the expression of all the TMV genes in addition to the gene insert, pJL3:P19 is a plasmid for the expression of the RNA-silencing suppressor protein P19, pJL TRBO-G is a GFP-expressing TRBO vector, and p35S:GFP is a plasmid with GFP expression under the control of a 35S promoter. Reproduced with permission from ref. . Copyright 2007 American Society of Plant Biologists.
Figure 21
Figure 21. Ordered assembly of phage trimer by DNA hybridization
a) Diagram of design of multiphage structure using DNA hybridization. pIX protein displaying DNA sequence A and pIII protein displaying sequence B are linked by complementary sequence C. Similiarly, pIX and pIII proteins displaying sequences D and E, respectively, are linked by complementary sequence F. b) Fluorescence microscopy image of phages after assembly illustrated the specific arrangement of the phages. Reproduced with permission from ref. . Copyright 2013 American Chemical Society.
Figure 22
Figure 22. Phage litmus for TNT detection
a) Phages genetically engineered with binding peptide for TNT were self-assembled through dip coating with varying pulling speeds to form bundled structures that resulted in colored matrices. b) Structural changes upon TNT binding resulted in color changes that can be detected using an iPhone-based analysis system down to a level of 300 ppb, with dashed red line showing the sensitivity limit. c) Images and processed fingerprints from the colorimetric sensor after exposure to MNT, DNT, and TNT demonstrated selective sensing of TNT over the similar molecules. d) Principal component analysis of the color changes further verified selectivity. Reproduced with permission from ref. . Copyright 2014 Nature Publishing Group.
Figure 23
Figure 23. Creation of free-standing Janus mesoporous virus film
Topographical tapping mode AFM images illustrate the initial formation of close-packed PS microspheres (a), partial removal of PS spheres (b) after patterned poly(pyrrole-co-pyrrole-3-carboxylic acid) electropolymerization (c), and a non-patterned film (d). e) Optical microscope image (480 μm by 360 μm) after overlaying CPMV on the patterned polymer through electrostatics and delaminating the film to create a free-standing film. Insets show topographical AFM images at indicated points in the film. Reproduced with permission from ref. .
Figure 24
Figure 24. TMV-based digital memory device
a) TEM image of TMV with approximately 10 nm-sized Pt nanoparticles uniformly attached. b) I-V curves of device created with an active layer derived from the TMV-Pt nanowires (illustrated in inset). The curves demonstrate the conductance switching behavior of the device, with a switch to the ON state during the first bias scan (blue filled circles) at 3.1 V, stability in the ON state with the second scan (blue open circles), and a return to the OFF state during a reverse scan (blue squares) at −2.4 V. On the other hand, devices made from only TMV (red triangles) and only Pt nanoparticles (red diamonds) showed no conductance switching behavior. Reproduced with permission from ref. . Copyright 2006 Nature Publishing Group.
Figure 25
Figure 25. M13 Super-Förster clone for enhanced exciton transport
a) M13 Classical Förster (left) and Super-Förster clones (right) showing engineered binding sites for chromophores (N-terminus in blue, pre-existing lysine residue in green, and inserted lysine residue in orange) and the networks for energy transport between the residues. Blue arrows show classical incoherent exciton hopping, while red ellipses indicate exciton delocalization. b) Experimental data of fluorescence per acceptor to donor-to-acceptor ratio of the Super-Förster clone is best matched by numerical simulations based on Super-Förster theory and decohered quantum walk (QW) rather than based on classical Förster. Reproduced with permission from ref. . Copyright 2016 Nature Publishing Group.
Figure 26
Figure 26. Controlled display of gold nanoparticles and fluorophores for enhanced fluorescence
a) Schematic for the assembly of MS2 around gold nanoparticles followed by attachment of DNA hairpins to place fluorophores a fixed distance away from the capsid. b) Images from total internal reflection fluorescence microscopy of MS2 labeled with fluorophores set 3 bp away from the capsid, with (left) and without (right) gold encapsulated, demonstrating metal-enhanced fluorescence. Reproduced with permission from ref. . Copyright 2013 American Chemical Society.

References

    1. Averhoff FM, Glass N, Holtzman D. Clin. Infect. Dis. 2012;55:S10–S15. - PubMed
    1. De Cock KM, Jaffe HW, Curran JW. Aids. 2012;26:1205–1213. - PubMed
    1. Graham-Rowe D. Nature. 2011;480:S2–S3. - PubMed
    1. Ebola Response Team WHO. N. Engl. J. Med. 2014;371:1481–1495. - PMC - PubMed
    1. Fauci AS, Morens DM. N. Engl. J. Med. 2016;374:601–604. - PubMed

Publication types

MeSH terms