

AS160 controls eukaryotic cell cycle and proliferation by regulating the CDK inhibitor p21
- PMID: 27152871
- PMCID: PMC4957568
- DOI: 10.1080/15384101.2016.1183853
AS160 controls eukaryotic cell cycle and proliferation by regulating the CDK inhibitor p21
Abstract
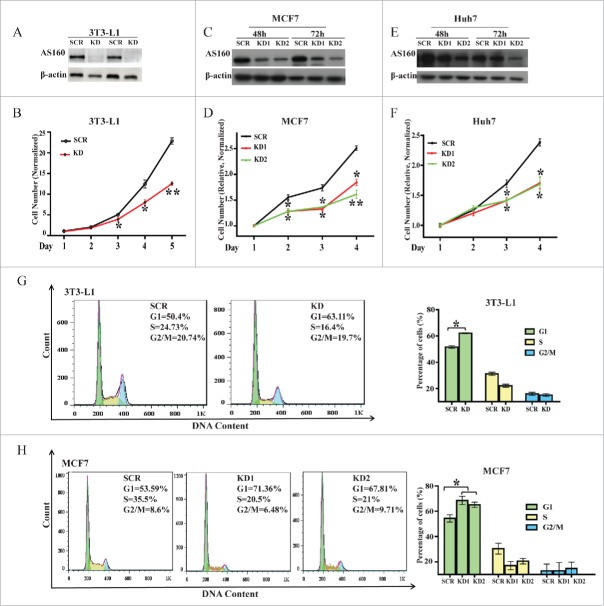
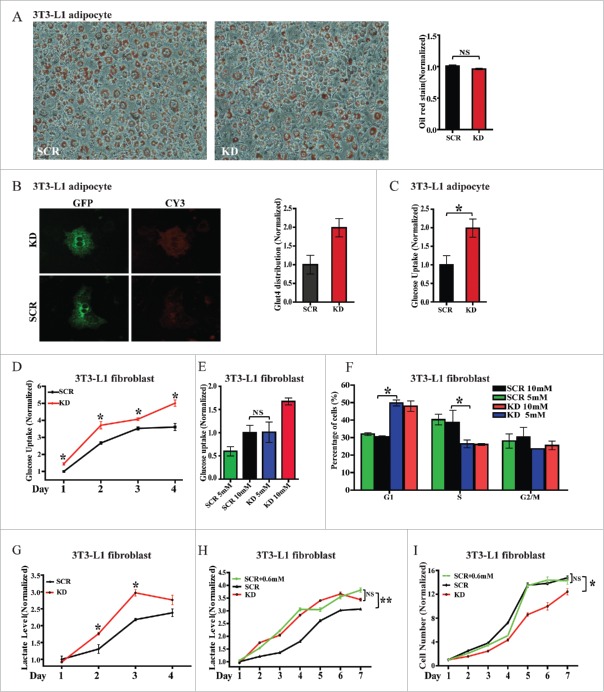
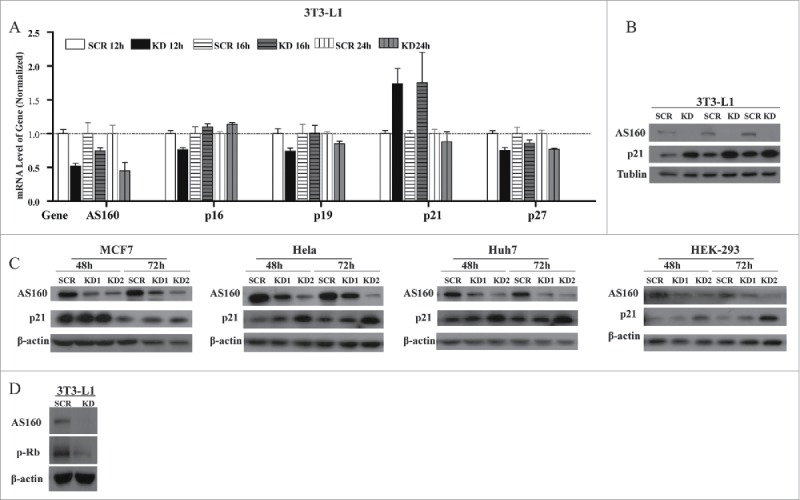
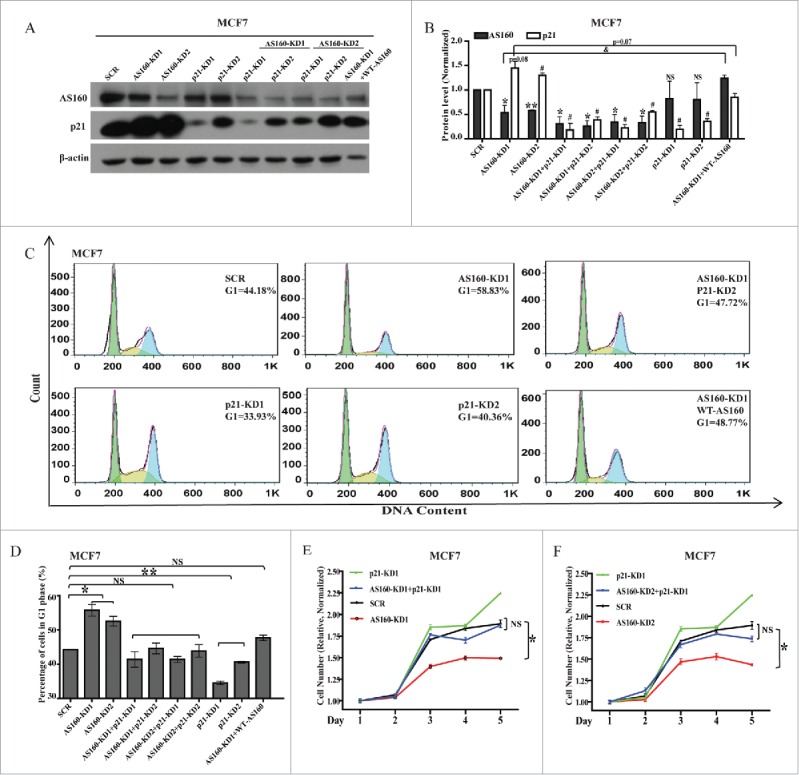
AS160 (TBC1D4) has been implicated in multiple biological processes. However, the role and the mechanism of action of AS160 in the regulation of cell proliferation remain unclear. In this study, we demonstrated that AS160 knockdown led to blunted cell proliferation in multiple cell types, including fibroblasts and cancer cells. The results of cell cycle analysis showed that these cells were arrested in the G1 phase. Intriguingly, this inhibition of cell proliferation and the cell cycle arrest caused by AS160 depletion were glucose independent. Moreover, AS160 silencing led to a marked upregulation of the expression of the cyclin-dependent kinase inhibitor p21. Furthermore, whereas AS160 overexpression resulted in p21 downregulation and rescued the arrested cell cycle in AS160-depeleted cells, p21 silencing rescued the inhibited cell cycle and proliferation in the cells. Thus, our results demonstrated that AS160 regulates glucose-independent eukaryotic cell proliferation through p21-dependent control of the cell cycle, and thereby revealed a molecular mechanism of AS160 modulation of cell cycle and proliferation that is of general physiological significance.
Keywords: AS160/TBC1D4; G1/S; cell cycle; cell proliferation; p21.
Figures
Similar articles
-
Simvastatin-induced cell cycle arrest through inhibition of STAT3/SKP2 axis and activation of AMPK to promote p27 and p21 accumulation in hepatocellular carcinoma cells.Cell Death Dis. 2017 Feb 23;8(2):e2626. doi: 10.1038/cddis.2016.472. Cell Death Dis. 2017. PMID: 28230855 Free PMC article.
-
LYG-202 inhibits the proliferation of human colorectal carcinoma HCT-116 cells through induction of G1/S cell cycle arrest and apoptosis via p53 and p21(WAF1/Cip1) expression.Biochem Cell Biol. 2011 Jun;89(3):287-98. doi: 10.1139/o10-162. Epub 2011 Apr 14. Biochem Cell Biol. 2011. PMID: 21491996
-
Differential role of diphenyleneiodonium, a flavoenzyme inhibitor, on p53-dependent and -independent cell cycle progression.Int J Oncol. 2008 Dec;33(6):1299-306. Int J Oncol. 2008. PMID: 19020764
-
[Molecular mechanisms controlling the cell cycle: fundamental aspects and implications for oncology].Cancer Radiother. 2001 Apr;5(2):109-29. doi: 10.1016/s1278-3218(01)00087-7. Cancer Radiother. 2001. PMID: 11355576 Review. French.
-
Adult neurogenesis, cell cycle and drug discovery in psychiatry.Neuropsychopharmacology. 2009 Jan;34(1):244. doi: 10.1038/npp.2008.164. Neuropsychopharmacology. 2009. PMID: 19079068 Free PMC article. Review. No abstract available.
Cited by
-
Astragalus polysaccharides decrease proliferation, migration, and invasion but increase apoptosis of human osteosarcoma cells by up-regulation of microRNA-133a.Braz J Med Biol Res. 2018 Nov 14;51(12):e7665. doi: 10.1590/1414-431X20187665. Braz J Med Biol Res. 2018. PMID: 30462772 Free PMC article.
-
TET2-mediated 5-hydroxymethylcytosine of TXNIP promotes cell cycle arrest in systemic anaplastic large cell lymphoma.Clin Epigenetics. 2025 Jan 21;17(1):10. doi: 10.1186/s13148-025-01816-0. Clin Epigenetics. 2025. PMID: 39838392 Free PMC article.
-
TBC1D4 antagonizes RAB2A-mediated autophagic and endocytic pathways.Autophagy. 2024 Nov;20(11):2426-2443. doi: 10.1080/15548627.2024.2367907. Epub 2024 Jul 4. Autophagy. 2024. PMID: 38964379 Free PMC article.
-
miR-421 promotes the viability of A549 lung cancer cells by targeting forkhead box O1.Oncol Lett. 2020 Dec;20(6):306. doi: 10.3892/ol.2020.12169. Epub 2020 Sep 29. Oncol Lett. 2020. PMID: 33093915 Free PMC article.
-
Clinical and genetic analyses of patients with lateralized overgrowth.BMC Med Genomics. 2022 Sep 30;15(1):206. doi: 10.1186/s12920-022-01362-1. BMC Med Genomics. 2022. PMID: 36175890 Free PMC article.
References
-
- Kane S, Sano H, Liu SC, Asara JM, Lane WS, Garner CC, Lienhard GE. A method to identify serine kinase substrates. Akt phosphorylates a novel adipocyte protein with a Rab GTPase-activating protein (GAP) domain. J Biol Chem 2002; 277:22115-8; PMID:11994271; http://dx.doi.org/10.1074/jbc.C200198200 - DOI - PubMed
-
- Jung HJ, Kwon T-H. Membrane Trafficking of Collecting Duct Water Channel Protein AQP2 Regulated by Akt/AS160. Electrolyte Blood Press 2010; 8:59-65; http://dx.doi.org/10.5049/EBP.2010.8.2.59 - DOI - PMC - PubMed
-
- Kim HY, Choi HJ, Lim JS, Park EJ, Jung HJ, Lee YJ, Kim SY, Kwon TH. Emerging role of Akt substrate protein AS160 in the regulation of AQP2 translocation. Am J Physiol Renal Physiol 2011; 301:F151-61; PMID:21511697; http://dx.doi.org/10.1152/ajprenal.00519.2010 - DOI - PubMed
-
- Alves DS, Thulin G, Loffing J, Kashgarian M, Caplan MJ. Akt Substrate of 160 kD Regulates Na+,K+-ATPase Trafficking in Response to Energy Depletion and Renal Ischemia. J Am Soc Nephrol 2015; 26:2765-76; PMID:25788531; http://dx.doi.org/10.1681/ASN.2013101040 - DOI - PMC - PubMed
-
- Liang X, Butterworth MB, Peters KW, Frizzell RA. AS160 modulates aldosterone-stimulated epithelial sodium channel forward trafficking. Mol Biol Cell 2010; 21:2024-33; PMID:20410134; http://dx.doi.org/10.1091/mbc.E10-01-0042 - DOI - PMC - PubMed
Publication types
MeSH terms
Substances
LinkOut - more resources
Full Text Sources
Other Literature Sources