. 2016 Dec;10(12):2958-2972.
doi: 10.1038/ismej.2016.62. Epub 2016 May 6.

Specific microbiome-dependent mechanisms underlie the energy harvest efficiency of ruminants

Affiliations

Specific microbiome-dependent mechanisms underlie the energy harvest efficiency of ruminants

Sheerli Kruger Ben Shabat et al. ISME J. 2016 Dec.

Abstract

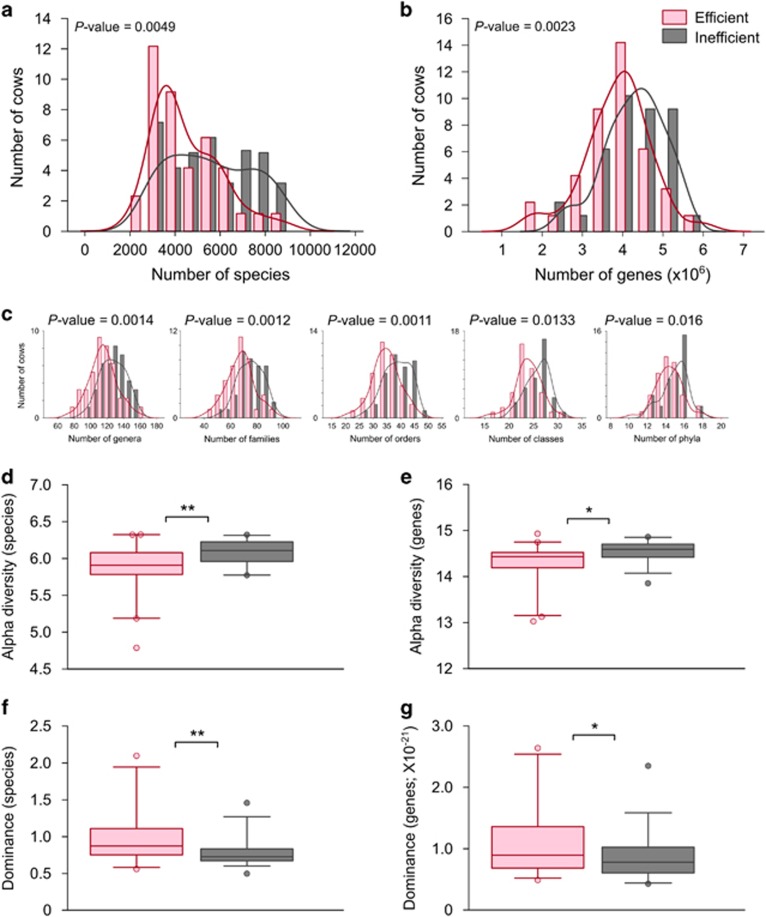
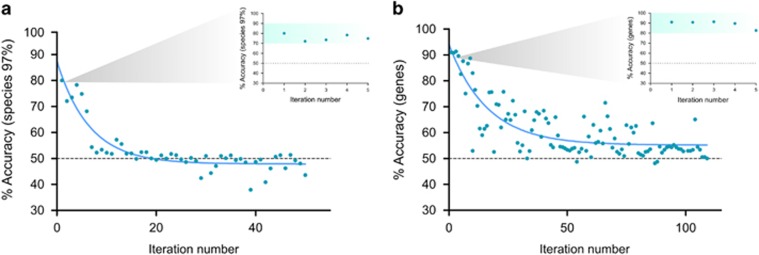
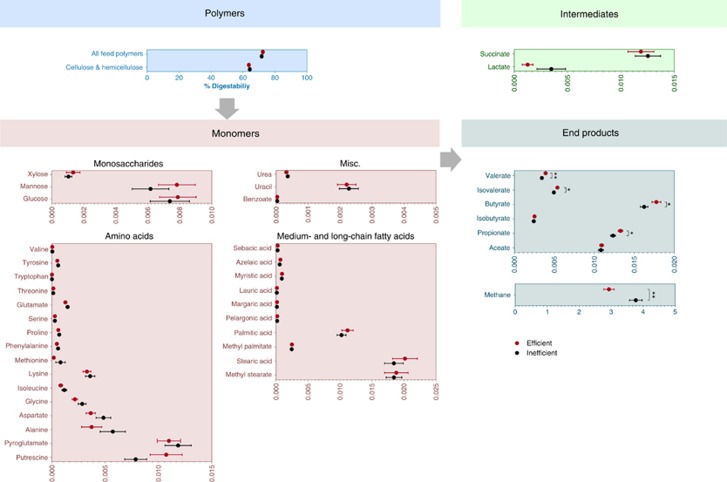
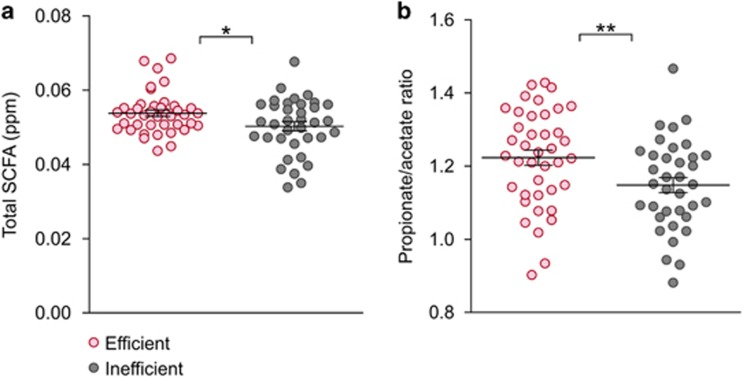
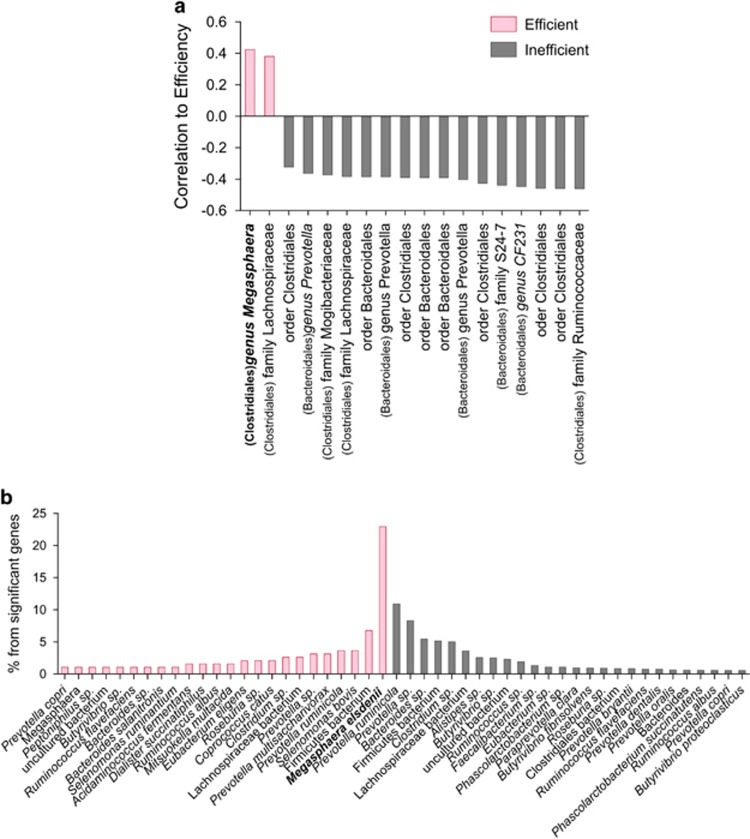
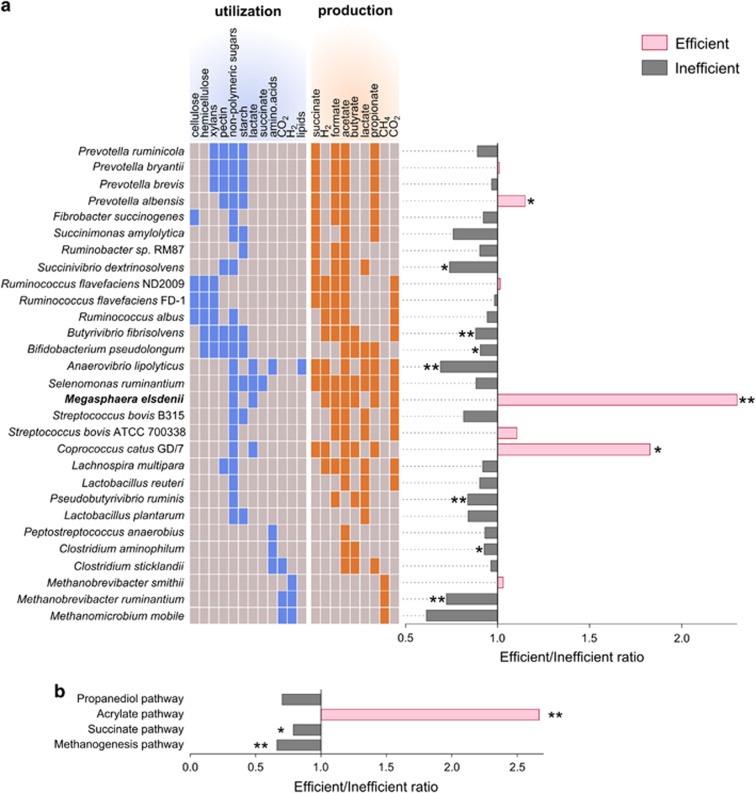
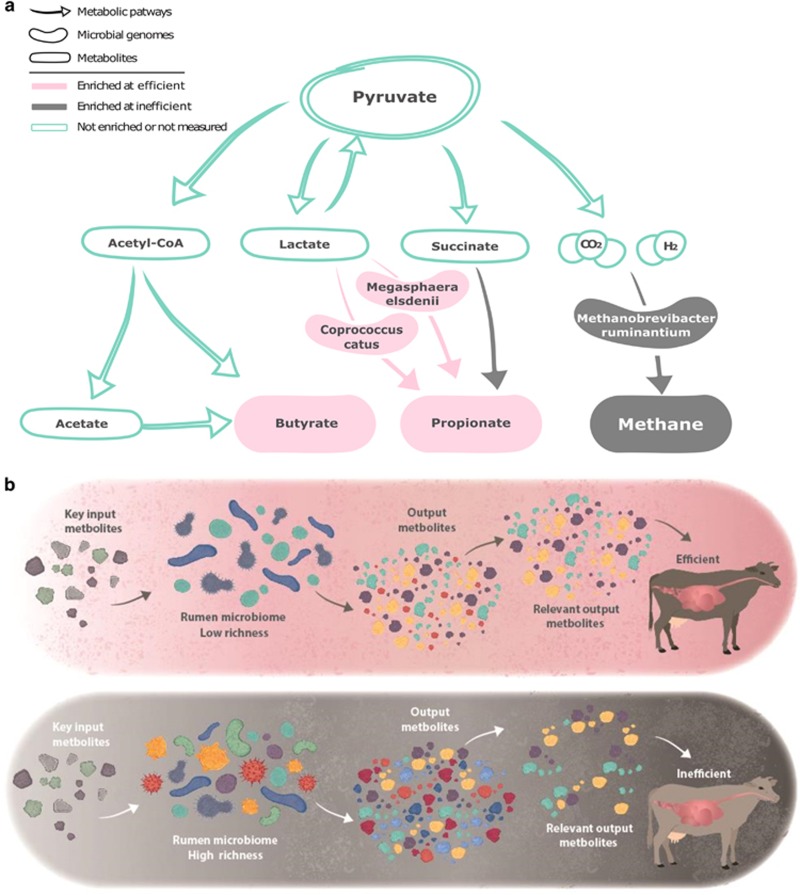
Ruminants have the remarkable ability to convert human-indigestible plant biomass into human-digestible food products, due to a complex microbiome residing in the rumen compartment of their upper digestive tract. Here we report the discovery that rumen microbiome components are tightly linked to cows' ability to extract energy from their feed, termed feed efficiency. Feed efficiency was measured in 146 milking cows and analyses of the taxonomic composition, gene content, microbial activity and metabolomic composition was performed on the rumen microbiomes from the 78 most extreme animals. Lower richness of microbiome gene content and taxa was tightly linked to higher feed efficiency. Microbiome genes and species accurately predicted the animals' feed efficiency phenotype. Specific enrichment of microbes and metabolic pathways in each of these microbiome groups resulted in better energy and carbon channeling to the animal, while lowering methane emissions to the atmosphere. This ecological and mechanistic understanding of the rumen microbiome could lead to an increase in available food resources and environmentally friendly livestock agriculture.


Figures

Figure 1
Figure 1
Community parameters of efficient and inefficient cows' microbiomes. (a, b) Microbiome richness. Species (based on 16S amplicon sequencing) (a) and gene (based on metagenomics sequencing) (b) counts were calculated and expressed as simple richness. Kernel density of the efficient and inefficient histograms emphasizes the different distribution of counts in each microbiome group. P-values of the difference in richness between efficient and inefficient cows are shown. (c) Microbiome richness at different phylogenetic levels. (d, e) Alpha diversity (Shannon index) measurements according to species (d) and genes (e). (f, g) Dominance of the microbiome according to species (f) and genes (g). Data are expressed as mean±s.e.m. Wilcoxon rank-sum, *P<0.05, **P<0.01.
Figure 2
Figure 2
Feed efficiency predictions according to species and genes. Species (a) and genes (b) that differed in presence/absence between efficient and inefficient cows were ranked according to their P-values and grouped into bins of 100. The bins were used as predictive features for the RFI feed efficiency parameter using the k-Nearest Neighbors (KNN) algorithm with k=3. Each iteration used a different bin as predictive features, in ascending P-value order. Inset in both graphs represents the first five prediction accuracy values (permutations of random classes shuffling, P-value=0.009).
Figure 3
Figure 3
Metabolome and microbial activity of rumen microbiomes of efficient and inefficient cows. In-vivo and in-vitro digestibility methods were performed on rumen fluid of efficient and inefficient cows in addition to extraction, identification and quantification of 41 different metabolites by GC and gas chromatography mass spectrometry. These metabolites were normalized to the organic matter content of the rumen fluid from which they were extracted. Metabolites are organized according to trophic levels. Multiple hypothesis correction with 9999 permutations was performed individually for each metabolic or activity test using the t-statistic (Materials and methods section). Data are expressed as mean±s.e.m. *P<0.05, **P<0.01.
Figure 4
Figure 4
SCFA concentration in rumen fluids of efficient and inefficient cows. (a) Total SCFA concentrations in efficient and inefficient rumen samples. (b) Propionate/acetate ratio in the efficient and inefficient rumen samples. Data are expressed as mean±s.e.m. *P<0.05, **P<0.01.
Figure 5
Figure 5
Taxonomic annotations of species and genes enriched in each microbiome group. (a) Spearman's correlation of significantly enriched species to the feed efficiency parameter. The annotations are presented at the lowest phylogenetic level obtained, as well as at the order level in parentheses. (b) The distribution of the phylogenetic annotations of genes enriched in each of the microbiome groups. Phylogenetic annotations above a threshold of 2% are presented.
Figure 6
Figure 6
Microbiome features enriched in each microbiome group. (a) Reads from each sample were aligned to sequenced genomes of known rumen microorganisms using the burrows-wheeler alignment tool. The ratios between alignments of efficient/inefficient samples to each genome are presented. The utilization and production of metabolites for each microorganism based on the known growth characteristics (Holdman and Moore, 1974; Russell and Rychlik, 2001; Duncan et al., 2009) are colored in blue and orange, respectively. (b) Reads from each sample were aligned to KEGG enzymes of different metabolic pathways using the burrows-wheeler alignment tool. Propanediol, acrylate and succinate pathways are different propionate production pathways. The ratios between alignments of efficient/inefficient samples to each pathway are presented. Data are expressed as ratio of means. Permutations t-test,*P<0.05, **P<0.01.
Figure 7
Figure 7
Consolidated results and model. (a) Consolidation of results from the metabolomics, genome and pathway recruitment analyses. Green: pathways and metabolites that were not significantly different or that were not assessed. Pink: enriched in efficient microbiomes. Grey: enriched in inefficient microbiomes. (b) Proposed model. From left to right: identical key input metabolites are ingested by the cow and presented to either an efficient microbiome (top panel) with lower richness and diversity, or an inefficient microbiome (bottom panel) with higher richness and diversity. Differences in richness result in the production of different metabolites. The efficient microbiome produces a smaller range of output metabolites than the inefficient microbiome, however, with larger amounts of relevant output metabolites, which are available for the animal's energetic needs.

References

    1. Aha DW. (1997) Lazy Learning. Kluwer Academic Publishers: Norwell, MA, USA.
    1. Ajmone-Marsan P, Garcia JF, Lenstra JA. (2010). On the origin of cattle: how aurochs became cattle and colonized the world. Evol Anthropol Issues News Rev 19: 148–157.
    1. Archer JA, Richardson EC, Herd RM, Arthur PF. (1999). Potential for selection to improve efficiency of feed use in beef cattle. Aust J Agric Res 50: 147–162.
    1. Benjamini Y, Hochberg Y. (1995). Controlling the false discovery rate: a practical and powerful approach to multiple testing. J R Stat Soc Series B (Methodological) 57: 289–300.
    1. Bradford GE. (1999). Contributions of animal agriculture to meeting global human food demand. Livest Prod Sci 59: 95–112.