

Effect of Interaction between Chromatin Loops on Cell-to-Cell Variability in Gene Expression
- PMID: 27153118
- PMCID: PMC4859557
- DOI: 10.1371/journal.pcbi.1004917
Effect of Interaction between Chromatin Loops on Cell-to-Cell Variability in Gene Expression
Abstract
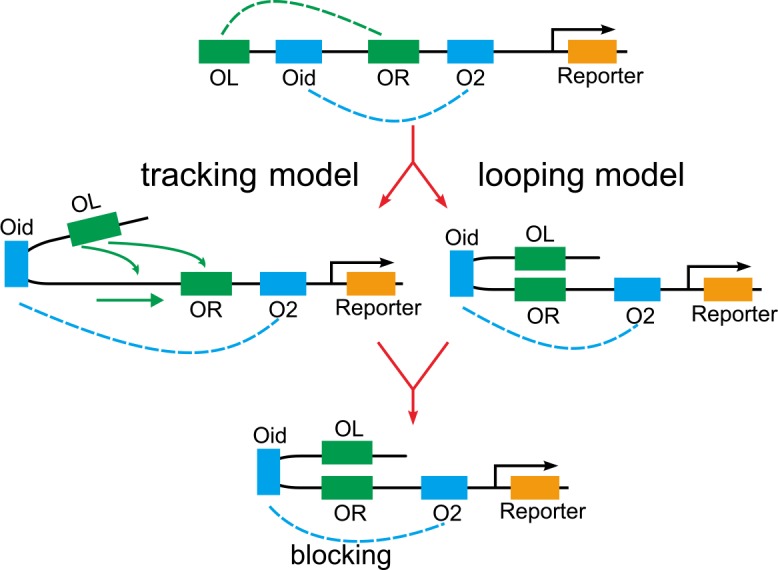
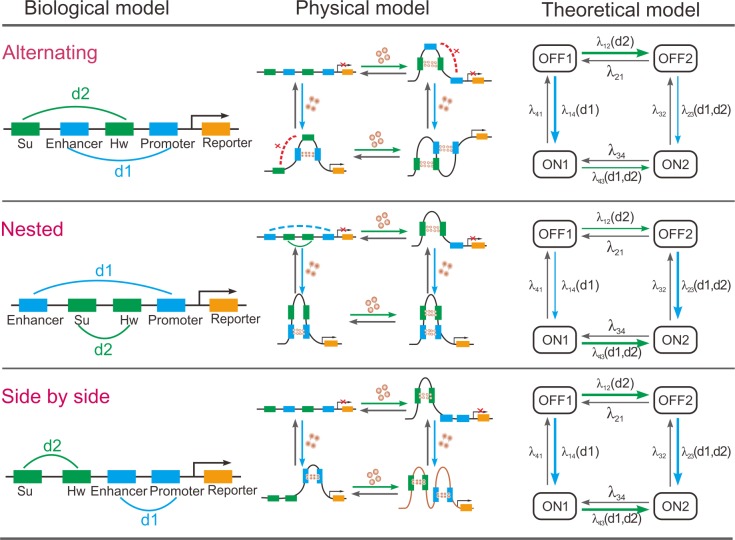
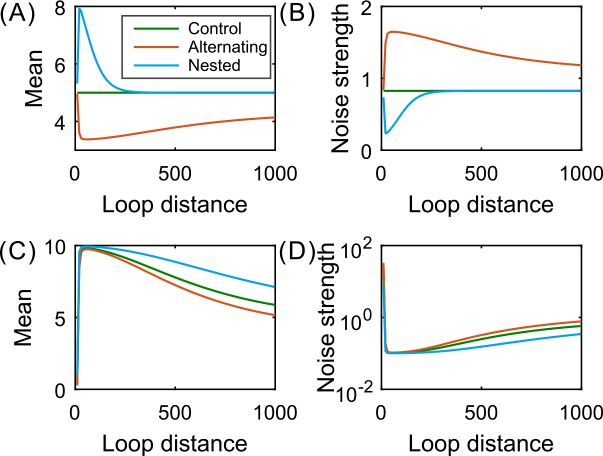
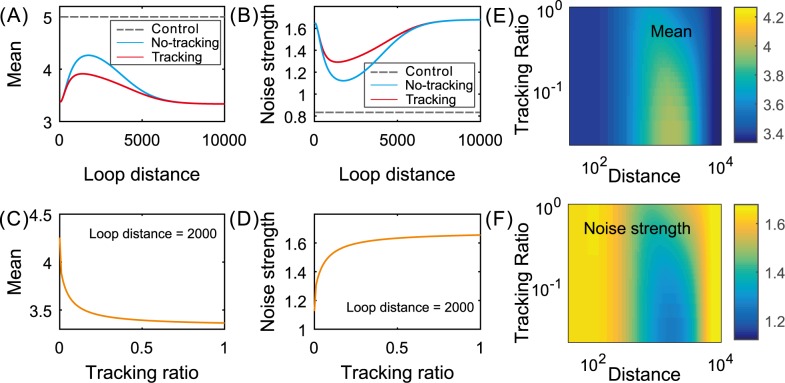
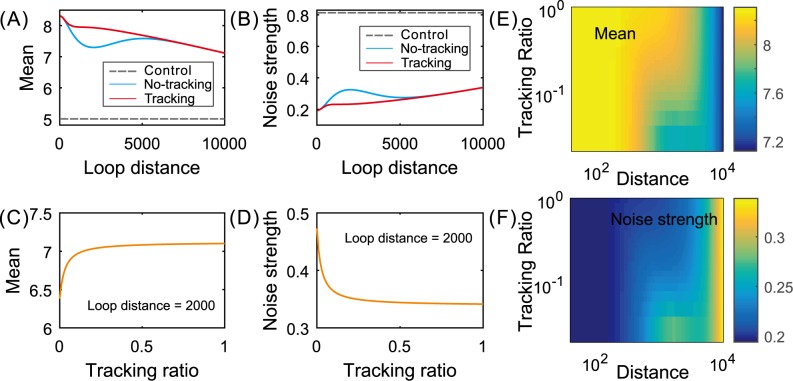
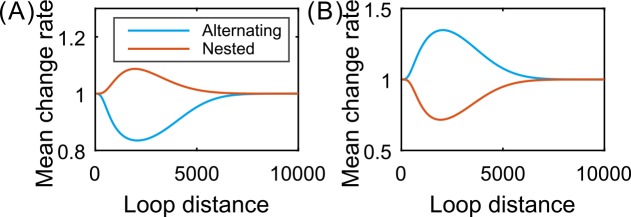
According to recent experimental evidence, the interaction between chromatin loops, which can be characterized by three factors-connection pattern, distance between regulatory elements, and communication form, play an important role in determining the level of cell-to-cell variability in gene expression. These quantitative experiments call for a corresponding modeling effect that addresses the question of how changes in these factors affect variability at the expression level in a systematic rather than case-by-case fashion. Here we make such an effort, based on a mechanic model that maps three fundamental patterns for two interacting DNA loops into a 4-state model of stochastic transcription. We first show that in contrast to side-by-side loops, nested loops enhance mRNA expression and reduce expression noise whereas alternating loops have just opposite effects. Then, we compare effects of facilitated tracking and direct looping on gene expression. We find that the former performs better than the latter in controlling mean expression and in tuning expression noise, but this control or tuning is distance-dependent, remarkable for moderate loop lengths, and there is a limit loop length such that the difference in effect between two communication forms almost disappears. Our analysis and results justify the facilitated chromatin-looping hypothesis.
Conflict of interest statement
The authors have declared that no competing interests exist.
Figures
Similar articles
-
The free-energy cost of interaction between DNA loops.Sci Rep. 2017 Oct 3;7(1):12610. doi: 10.1038/s41598-017-12765-x. Sci Rep. 2017. PMID: 28974770 Free PMC article.
-
Effect of promoter architecture on the cell-to-cell variability in gene expression.PLoS Comput Biol. 2011 Mar;7(3):e1001100. doi: 10.1371/journal.pcbi.1001100. Epub 2011 Mar 3. PLoS Comput Biol. 2011. PMID: 21390269 Free PMC article.
-
Chromatin loops as allosteric modulators of enhancer-promoter interactions.PLoS Comput Biol. 2014 Oct 23;10(10):e1003867. doi: 10.1371/journal.pcbi.1003867. eCollection 2014 Oct. PLoS Comput Biol. 2014. PMID: 25340767 Free PMC article.
-
Communication over a large distance: enhancers and insulators.Biochem Cell Biol. 2003 Jun;81(3):241-51. doi: 10.1139/o03-051. Biochem Cell Biol. 2003. PMID: 12897858 Review.
-
Minor Loops in Major Folds: Enhancer-Promoter Looping, Chromatin Restructuring, and Their Association with Transcriptional Regulation and Disease.PLoS Genet. 2015 Dec 3;11(12):e1005640. doi: 10.1371/journal.pgen.1005640. eCollection 2015 Dec. PLoS Genet. 2015. PMID: 26632825 Free PMC article. Review.
Cited by
-
Anticipating response function in gene regulatory networks.J R Soc Interface. 2021 Jun;18(179):20210206. doi: 10.1098/rsif.2021.0206. Epub 2021 Jun 2. J R Soc Interface. 2021. PMID: 34062105 Free PMC article.
-
Perspectives: using polymer modeling to understand the formation and function of nuclear compartments.Chromosome Res. 2017 Mar;25(1):35-50. doi: 10.1007/s10577-016-9548-2. Epub 2017 Jan 14. Chromosome Res. 2017. PMID: 28091870 Free PMC article. Review.
-
The Blueprint of Logical Decisions in a NF-κB Signaling System.ACS Omega. 2024 May 13;9(21):22625-22634. doi: 10.1021/acsomega.4c00049. eCollection 2024 May 28. ACS Omega. 2024. PMID: 38826544 Free PMC article.
-
Stochastic fluctuations in apoptotic threshold of tumour cells can enhance apoptosis and combat fractional killing.R Soc Open Sci. 2020 Feb 19;7(2):190462. doi: 10.1098/rsos.190462. eCollection 2020 Feb. R Soc Open Sci. 2020. PMID: 32257298 Free PMC article.
-
Omics Analyses Uncover Host Networks Defining Virus-Permissive and -Hostile Cellular States.Mol Cell Proteomics. 2025 May;24(5):100966. doi: 10.1016/j.mcpro.2025.100966. Epub 2025 Apr 7. Mol Cell Proteomics. 2025. PMID: 40204275 Free PMC article.
References
Publication types
MeSH terms
Substances
LinkOut - more resources
Full Text Sources
Other Literature Sources
Miscellaneous
