. 2016 May 5;165(4):854-66.
doi: 10.1016/j.cell.2016.04.008.

Temporal Stability of the Human Skin Microbiome

Affiliations

Temporal Stability of the Human Skin Microbiome

Julia Oh et al. Cell. .

Abstract

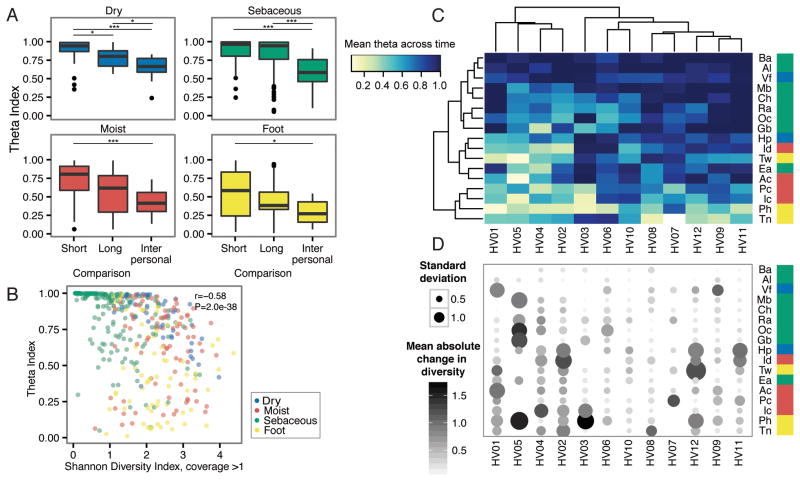
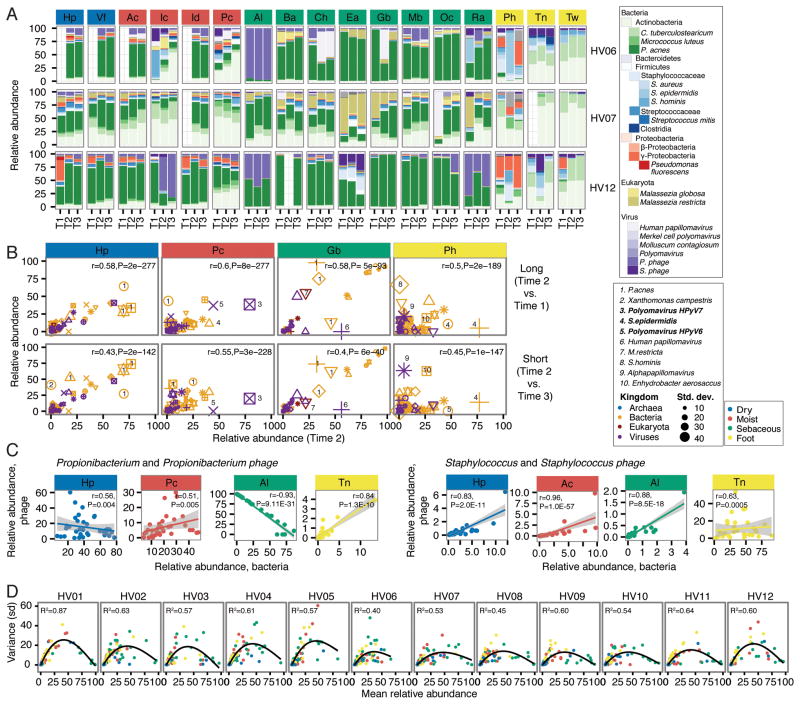
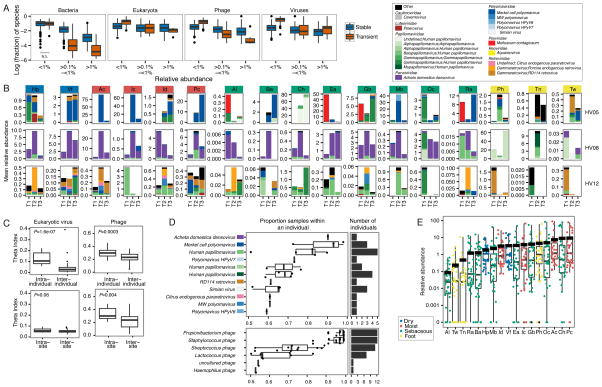
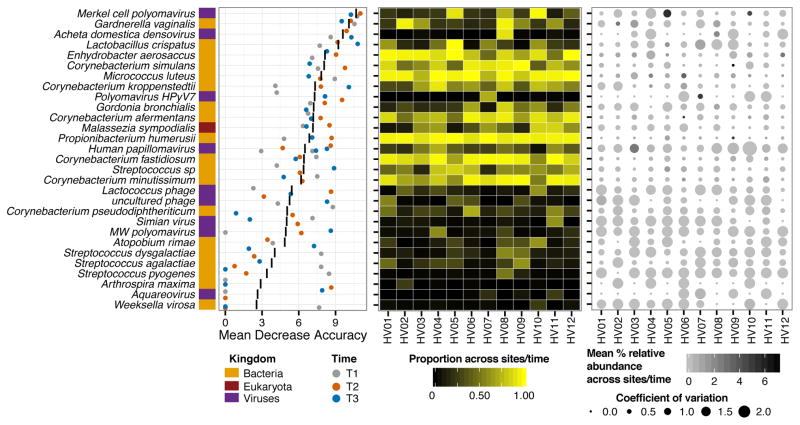
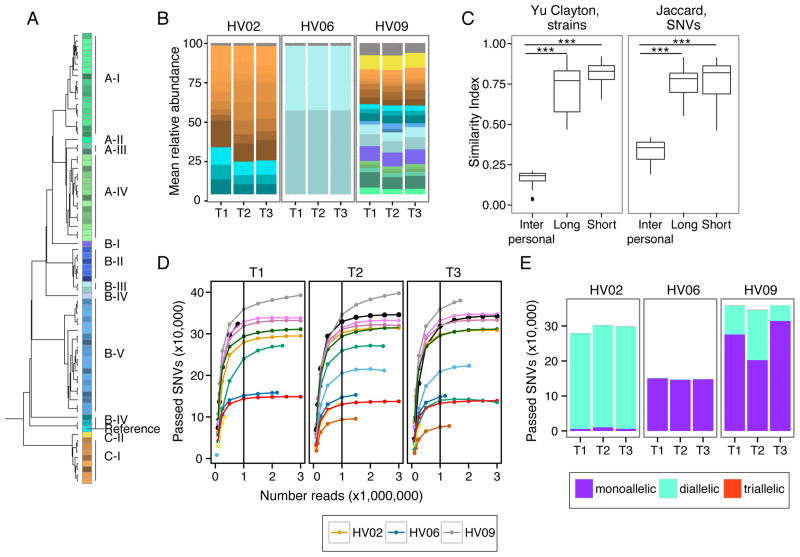
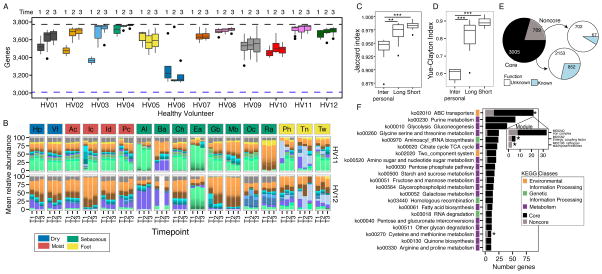
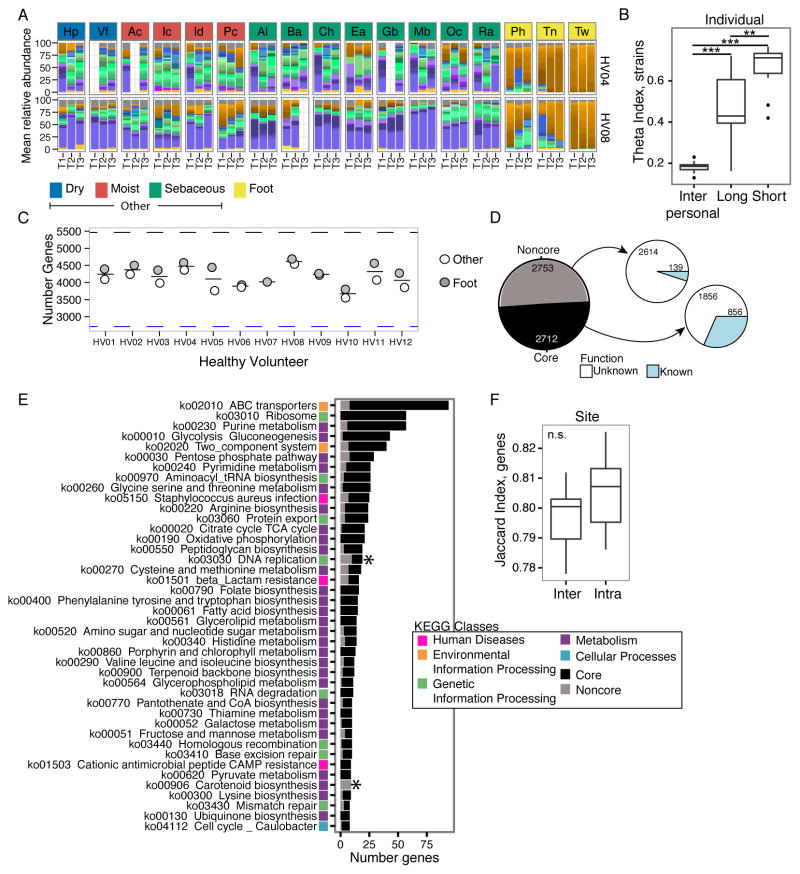
Biogeography and individuality shape the structural and functional composition of the human skin microbiome. To explore these factors' contribution to skin microbial community stability, we generated metagenomic sequence data from longitudinal samples collected over months and years. Analyzing these samples using a multi-kingdom, reference-based approach, we found that despite the skin's exposure to the external environment, its bacterial, fungal, and viral communities were largely stable over time. Site, individuality, and phylogeny were all determinants of stability. Foot sites exhibited the most variability; individuals differed in stability; and transience was a particular characteristic of eukaryotic viruses, which showed little site-specificity in colonization. Strain and single-nucleotide variant-level analysis showed that individuals maintain, rather than reacquire, prevalent microbes from the environment. Longitudinal stability of skin microbial communities generates hypotheses about colonization resistance and empowers clinical studies exploring alterations observed in disease states.


Figures

Figure 1
Figure 1. Community Stability is Dependent on Both Site and Individuality
Sites are color coded by characteristic and defined in Figure S1. (A) Boxplots of Yue–Clayton theta indices calculate similarity between sites aggregrated by characteristic. ‘Long’ duration indicates ~1–2 years between samplings; ‘Short’ duration averages a month (T2 to T3). For comparison, ‘Interpersonal’ values shows the average between individuals. Bonferroni-adjusted *P <0 .05 value, **P <0 .01 value, ***P < .001 value. (B) Quantification of community stability relative to community diversity by partial Spearman correlation. Diversity is measured by the Shannon Diversity Index, calculated for genomes with coverage greater than 1. (C) Hierarchical clustering (complete linkage) of mean theta indices over average of ‘long’ and ‘short’ values for each individual at each site sampled. (D) Mean change in community diversity over time, ordered as in (C) to show that community stability tracks with stability in diversity. Circle size shows the standard deviation of diversity, and color indicates magnitude of changes in diversity. See also Figure S1.
Figure 2
Figure 2. Community Stability is Defined by Different Species Characteristics, Depending on Site and Individual
For all panels, sites are color coded by site characteristic. (A) Relative abundances of the most common skin bacteria, fungi, and viruses shown for 3 representative individuals. Full set of taxonomic classifications is shown in Figure S3. T1, T2, and T3 indicate order in time series. (B) Correlating taxon abundances for ‘Long’ vs ‘Short’ time series for select sites from (A) that showed higher variability. Different shapes represent different individuals; different colors represent kingdom of species, and size of point indicates species standard deviation between samples. Select abundant taxa (five most highly variable) are numbered as indicated. Partial Spearman correlations adjusting for repeated measures with associated P-values are in the upper right. (C) Phage and host dynamics at select sites. For Propionibacterium acnes and Staphylococcus, relative abundances of phage versus bacteria are plotted for each sample. A linear model was fitted to the data with shading showing the 95% confidence interval for the goodness of fit. To quantify correlation or anticorrelation, partial Spearman correlation coefficients and associated adjusted P-values were calculated. (D) The relationship between taxon abundance and variance, measured as standard deviation, is shown for taxa > 0.25% relative abundance in the population. A generalized additive model, showing a second order relationship, was fitted to the data to generate correlation coefficients (upper left). All P-values ≪0.05. See also Figure S2.
Figure 3
Figure 3. Assessment of Transient vs. Non-transient Species Across Time by Kingdom, and Eukaryotic Viral Stability in the Skin
For panels in (A and B), sites are color coded by site characteristic. (A) Fraction of species that are transient or not transient for each complete longitudinal set of sites per individual. Transience, defined as present in only one of three time points, is measured at three ranges of abundances. All comparisons were adjusted P-value < 0.05 between transient/non-transient except for Bacteria, <0.1%, which is marked not significant (N.S.). (B) Relative abundances of the most common predicted eukaryotic viruses are shown for 3 representative individuals. Full set of classifications is shown in Figure S3. T1, T2, T3 indicate order in time series. (C) Predicted eukaryotic viruses tend to be individual-specific, with significantly more sharedness, calculated with the Yue-Clayton theta coefficient, within an individual than between individuals and with little site-specificity. P-value, Wilcoxon rank-sum test shown in left corner. (D) Coreness of predicted eukaryotic viruses. Box plots and overlaid points show the proportion of samples within an individual in which a virus is observed, with a cutoff of >50% occurrence. For lineage, color code is based on panel (B) legend. Right panel shows number of individuals in which a eukaryotic virus is observed. (E) Relative abundance of eukaryotic viruses arranged by site with each individual’s value overlaid and colored by site characteristic. Thick black line indicates mean relative abundance of total (eukayotic and bacterial) DNA viruses at that site. See also Figure S3.
Figure 4
Figure 4. Individual-specific Signature Taxa are Shared across Time, Sites, and are Typically Low Abundance and Highly Stable
Left, variable importance plot of supervised random forest algorithm output. Top 30 taxa contributing to model are shown on the y-axis ranked by importance, quantified by the mean decrease in accuracy; i.e., degree to which inclusion of this predictor in model reduces classification error. Black line indicates the mean decrease in accuracy across the three timepoints; colored points indicate the score for each timepoint. Center, for each individual, proportion of body sites for which each taxa is present, averaged across timepoints. Right, variation in mean relative abundance across sites and timepoints (color) with coefficient of variation.
Figure 5
Figure 5. Individual Specific Strain and SNV Signatures are Stable Over Time
(A) Dendrogram of P. acnes strain genome similarity based on core SNVs. (B) P. acnes strain relative abundance plots of 3 representative individuals’ manubrium, colors as in (A). Full set of strain classifications is shown in Figure S6B. (C) Boxplots of Yue-Clayton (left) and Jaccard (right) theta indices indicate similarity between strains (all body sites) and SNVs (manubrium and back) of P. acnes in a time series (θ = 1 is identical). ***P < .001 value, Wilcoxon rank-sum test. (D) Rarefaction curves demonstrate core SNV accumulation with read subsampling for manubrium sites. For remaining panels, SNVs are reported for samples subsampled to 1 million reads. Colors correspond to individuals as shown in Figure S1B. (D) Number of SNVs that are mono, di, and triallelic. T1, T2, and T3 indicate order in time series. HV is healthy volunteer. See also Figure S4.
Figure 6
Figure 6. P. acnes Pan-genome Reaches Functional Saturation with Distinct Strain Combinations
(A) Boxplots show number of genes present at > 40% coverage across sites of individuals at 3 time points. Black dashed line indicates the 3,774 genes in P. acnes pangenome. Blue dashed line indicates the 3,005 genes present in every individual at every time point in at least 50% of body sites. Sites with < 1 million P. acnes reads were excluded. (B) Relative abundance plots of P. acnes strains across all body sites, color-coded by site characteristic. Strain colors defined in Figure 5A. T1, T2, and T3 indicate order in time series. (C) Boxplots of Jaccard theta indices indicate stability of gene presence over time (θ = 1 is identical). **P <0 .01, ***P < 0.001, Wilcoxon rank-sum test. (D) Boxplots of Yue-Clayton theta indices indicate the stability of gene copy numbers over time (θ = 1 means identical). (E) Pie chart indicates distribution of P. acnes genes between those present in all individuals “core” and those absent from some individuals “noncore”. Majority of core and noncore genes are pathway “unknown” when compared to a KEGG database. (F) Distribution of core and noncore genes for prevalent KEGG pathways. Colors indicate broader KEGG class of each pathway. Pathways with * are functionally enriched in noncore based on Fisher exact test with FDR <0.05. See also Figure S5.
Figure 7
Figure 7. S. epidermidis Strains Remain Stable over Time and Communities do not Reach Gene Saturation
(A) Relative abundance plots of S. epidermidis strains across body sites, color-coded by site characteristic. Full set of taxonomic classifications is shown in Figure S6B. Strain colors defined in Figure S6A. Due to coverage S. epidermidis, foot sites were combined as “foot” and all moist, dry, and sebaceous sites were combined as “other” (Figure S6E). Combined samples with <1 million S. epidermidis reads were excluded. (B) Boxplots of theta indices indicate the stability of S. epidermidis strains within an individual over long or short time compared to between individuals (Inter) (θ = 1 means identical). **P < 0.01; ***P < 0.001, Wilcoxon rank-sum test. (C) Number of genes present on foot and other body sites, with mean number shown as thin bar. Black dashed line indicates the 5,465 genes present in S. epidermidis pangenome. Blue dashed lines indicate the 2,712 genes present in all foot and other combined samples. (D) Pie chart indicates distribution of S. epidermidis genes between those present in all individuals “core” and those missing from some individuals “noncore”. Majority of core and noncore genes are pathway “unknown” when compared to a KEGG database. (E) Distribution of genes between core and noncore for the most prevalent KEGG pathways. Colors indicate the broader KEGG class of each pathway. Pathways indicated with * are functionally enriched in noncore based on Fisher exact test with FDR < 0.05. (F) S. epidermidis gene repertoire is not statistically more similar within a site (‘Intra’) than between (‘Inter’) sites, calculated with Jaccard theta. See also Figure S6.

Comment in

References

    1. Alekseyenko AV, Perez-Perez GI, De Souza A, Strober B, Gao Z, Bihan M, Li K, Methe BA, Blaser MJ. Community differentiation of the cutaneous microbiota in psoriasis. Microbiome. 2013;1:31. - PMC - PubMed
    1. Belkaid Y, Segre JA. Dialogue between skin microbiota and immunity. Science. 2014;346:954–959. - PubMed
    1. Caporaso JG, Lauber CL, Costello EK, Berg-Lyons D, Gonzalez A, Stombaugh J, Knights D, Gajer P, Ravel J, Fierer N, et al. Moving pictures of the human microbiome. Genome biology. 2011;12:R50. - PMC - PubMed
    1. Conlan S, Mijares LA, Becker J, Blakesley RW, Bouffard GG, Brooks S, Coleman H, Gupta J, Gurson N, et al. NISC Comp Seq Program. Staphylococcus epidermidis pan-genome sequence analysis reveals diversity of skin commensal and hospital infection-associated isolates. Genome biology. 2012;13:R64. - PMC - PubMed
    1. Costello EK, Lauber CL, Hamady M, Fierer N, Gordon JI, Knight R. Bacterial community variation in human body habitats across space and time. Science. 2009;326:1694–1697. - PMC - PubMed

Publication types